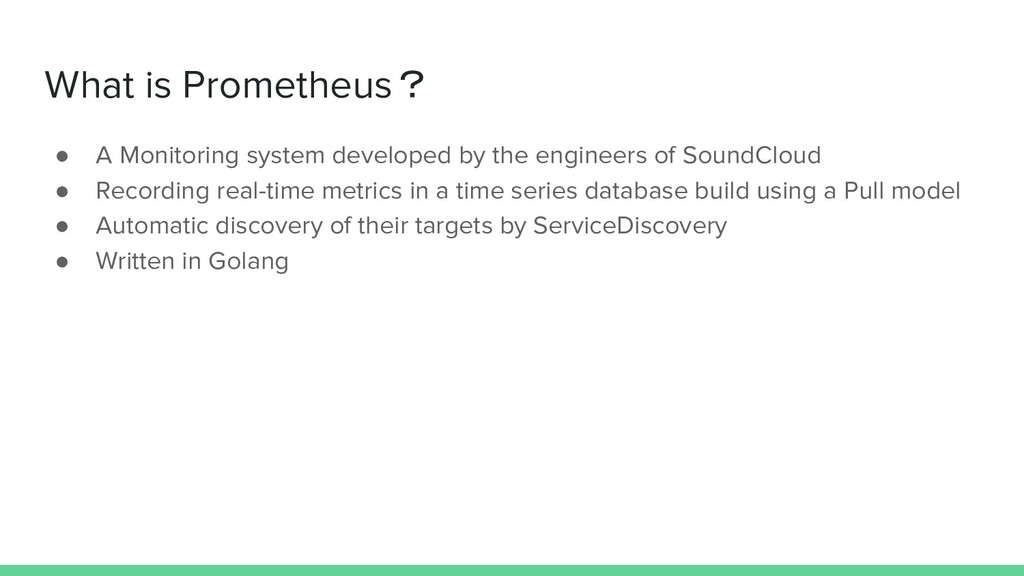
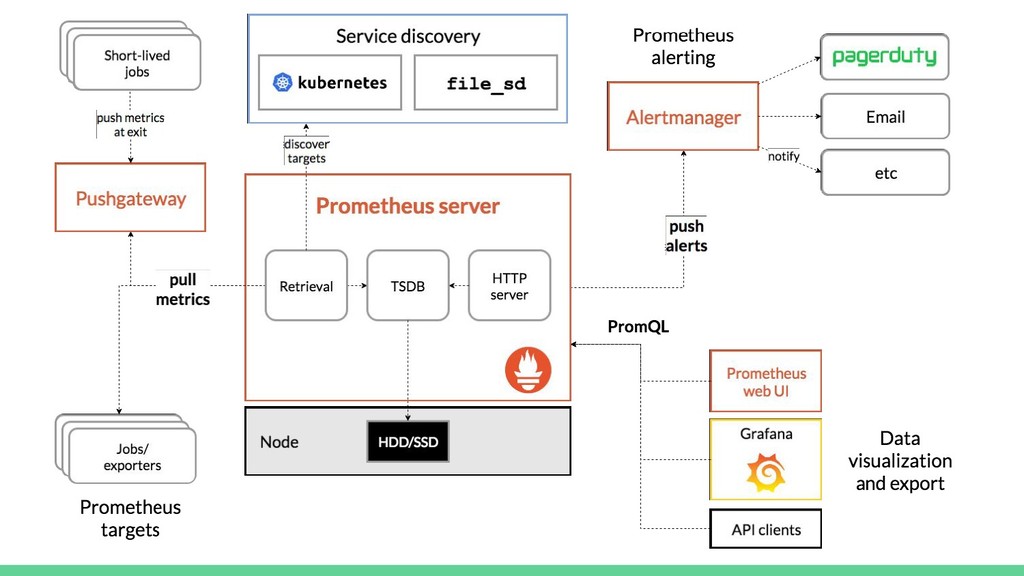
Upgrade to Pro — share decks privately, control downloads, hide ads and more …

Introduction Prometheus

Introduction Prometheus

This slide was presented at "CloudNative Days Tokyo Meetup w/ Melanie Cebula" held on July 20, 2019.
It's 5 minutes Lightning Talks.

CloudNative Days Tokyo Meetup w/ Melanie Cebula - connpass
https://wantedly.connpass.com/event/135968/

kameneko

July 23, 2019
Tweet

More Decks by kameneko

Other Decks in Technology

Transcript

  1. Introduction Prometheus
    Takuma Nakagame, SAKURA internet Inc.

    View Slide

  2. Takuma Nakagame
    @kameneko1004
    ● SAKURA internet Inc.
    ○ Cloud Service Provider
    ● IT infrastructure engineer
    ● Evangelist
    ● LIKE
    ○ Prometheus
    ○ FreeNAS

    View Slide

  3. What is Prometheus?

    View Slide

  4. What is Prometheus?
    ● A Monitoring system developed by the engineers of SoundCloud
    ● Recording real-time metrics in a time series database build using a Pull model
    ● Automatic discovery of their targets by ServiceDiscovery
    ● Written in Golang

    View Slide

  5. Dream Hack Monitoring with Prometheus
    ● 10,000 computers
    ● 500 
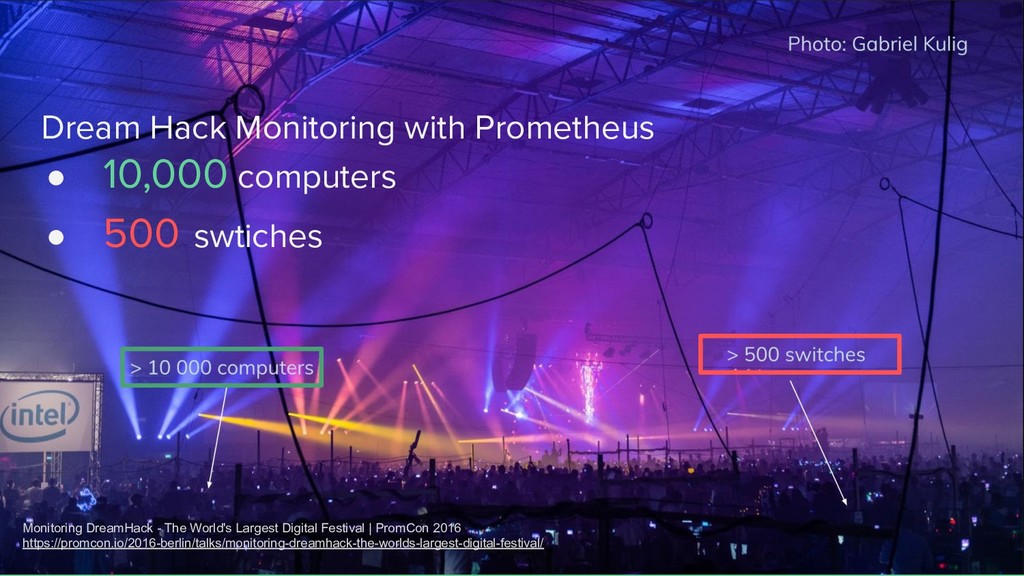
swtiches
    Monitoring DreamHack - The World's Largest Digital Festival | PromCon 2016
    https://promcon.io/2016-berlin/talks/monitoring-dreamhack-the-worlds-largest-digital-festival/

    View Slide

  6. Prometheus Architecture

    View Slide

  7. View Slide

  8. What ?

    View Slide

  9. The minimum essential componets to
    use Prometheus

    View Slide

  10. ● Prometheus Server
    ● Exporter
    ● Service Discovery
    ● PromQL

    View Slide

  11. ● Collecting the metrics from its targes
    ● Filtering its metrics by PromQL
    ○ WebGUI
    ● Crating Alerts
    Prometheus Server

    View Slide

  12. Exporter
    ● Monitoring Agent
    ● Expanding its metrics by HTTP and
    periodically pull these to show
    ● So-called Web server for just hitting
    API

    View Slide

  13. Exporter
    Exporters by their targets
    ● Server : NodeExporter
    ● MySQL : MySQL Server Exporter
    ● Nginx : NGINX Exporter
    ● Apache : Apache Exporter
    ● and more!

    View Slide

  14. Service Discovery
    Automatic target discovery
    ● Kubernetes
    ● AWS EC2
    ● GCP GCE
    ● OpenStack
    ● Azure

    View Slide

  15. PromQL
    ● Prometheus Query Language
    ● Filtering metrics
    ● Defining Alert
    ● WebGUI
    ● API
    ● Grafana

    View Slide

  16. An Example of PromQL
    http_requests_total
    Total number of requests in http
    http_requests_total{pod_name=”nginx1”}
    Total number of requests of POD ‘nginx1’ in http
    sum(http_requests_total)
    Sum of total requests in http

    View Slide

  17. Run Prometheus

    View Slide

  18. Run Prometheus Step
    1. Binary download
    2. Unarchive
    3. Run!

    View Slide

  19. Download Binary
    https://github.com/prometheus/prometheus/releases
    $ wget https://github.com/prometheus/prometheus/releases/download/v2.11.1/prometheus-2.11.1.linux-amd64.tar.gz

    View Slide

  20. Unarchive
    $ tar -xvf prometheus-2.9.2.linux-amd64.tar.gz

    View Slide

  21. Run
    $ cd prometheus-2.9.2.linux-amd64/
    $ ./prometheus

    View Slide

  22. Run
    $ cd prometheus-2.9.2.linux-amd64/
    $ ./prometheus
    FINISH!

    View Slide

  23. Takeaways

    View Slide

  24. 3 Takeaways
    ● Automatic target discovery
    ● Plenty of Exporters
    ● Simple

    View Slide