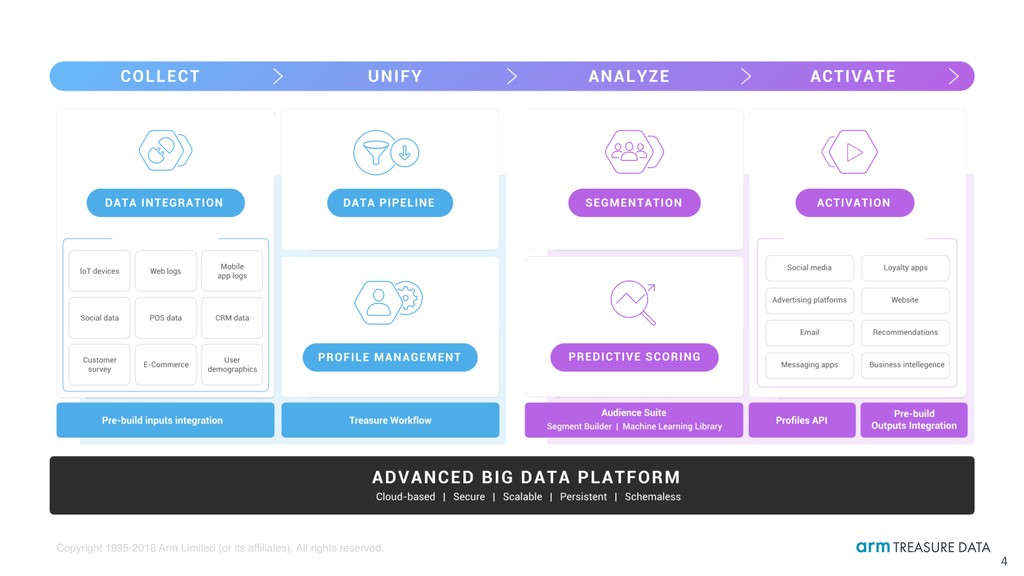
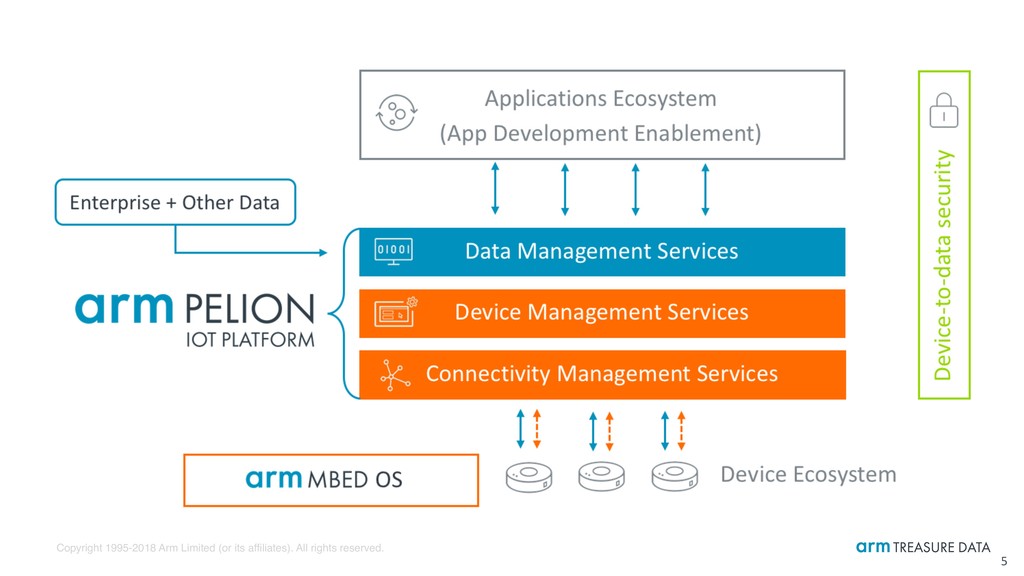
1. Understand what Arm Treasure Data Customer Data Platform is [5mins] Data management layer of Arm Pelion IoT platform 2. Learn how machine learning and data science works [5mins] Capture characteristics of historical data, and predict unseen result 3. See every single steps of real-world data science workflow on TD [50mins] IoT-ish sample scenario based on real-life environmental data from City of Chicago 2
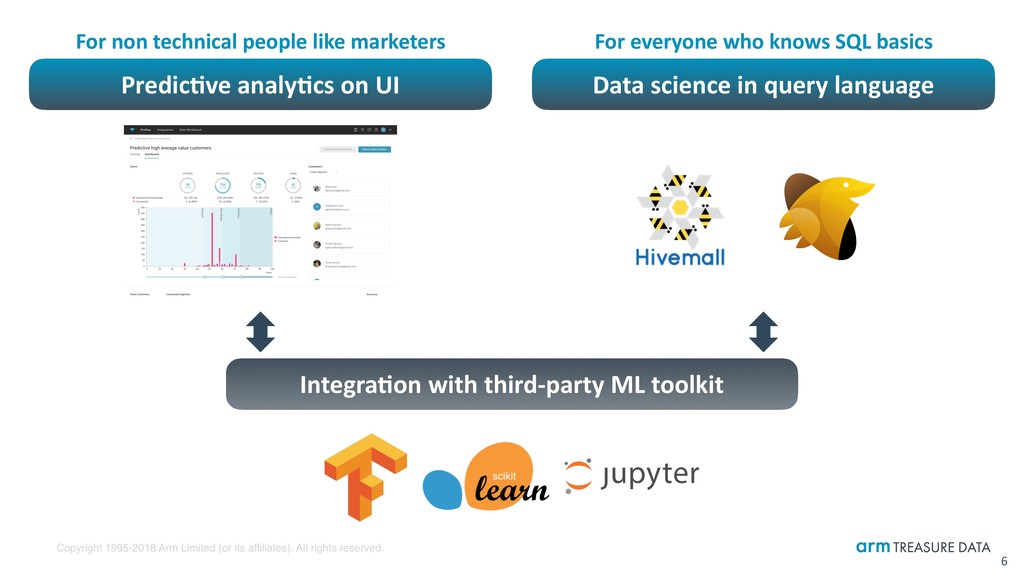
6 Predic:ve analy:cs on UI Data science in query language Integra:on with third-party ML toolkit For everyone who knows SQL basics For non technical people like marketers
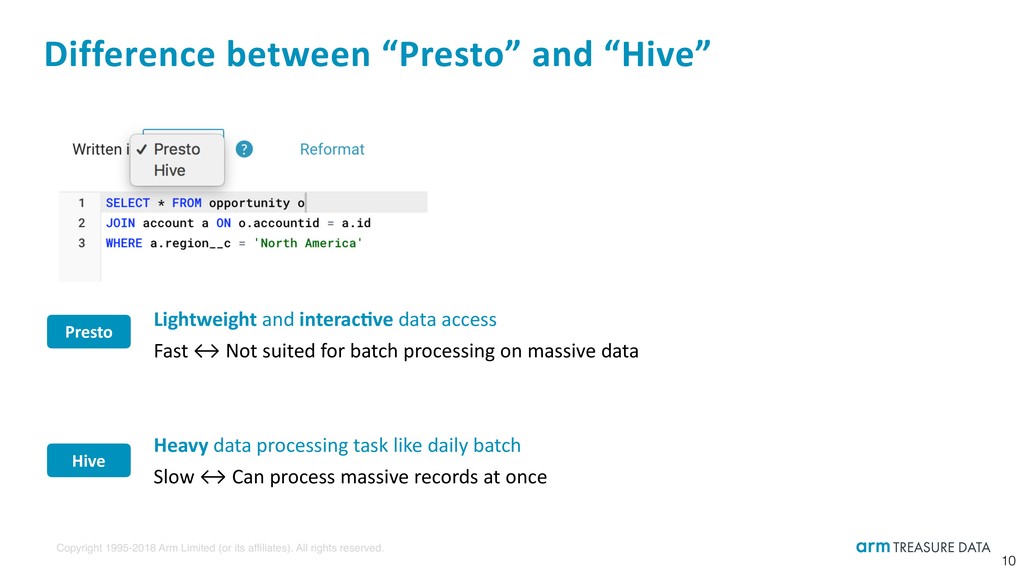
Difference between “Presto” and “Hive” Hive Presto Lightweight and interac:ve data access Fast ↔ Not suited for batch processing on massive data Heavy data processing task like daily batch Slow ↔ Can process massive records at once 10
Data 3rd-party tools (e.g., visualiza6on) SQL + heavy lightweight ML with Apache Hivemall SELECT * FROM data … How to analyze your data on Treasure Data at scale 11 Schedule Treasure Workflow (a.k.a. Digdag)
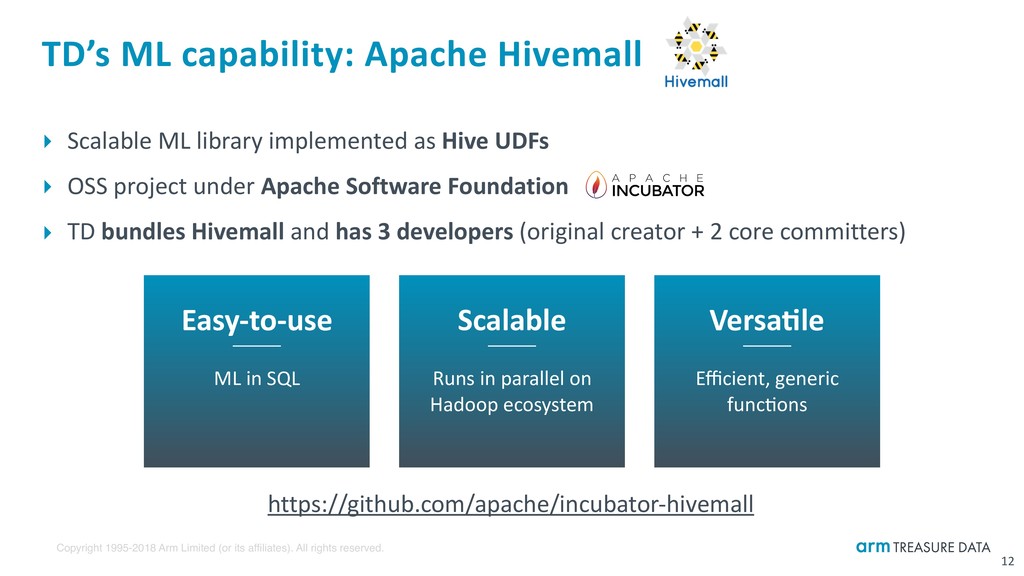
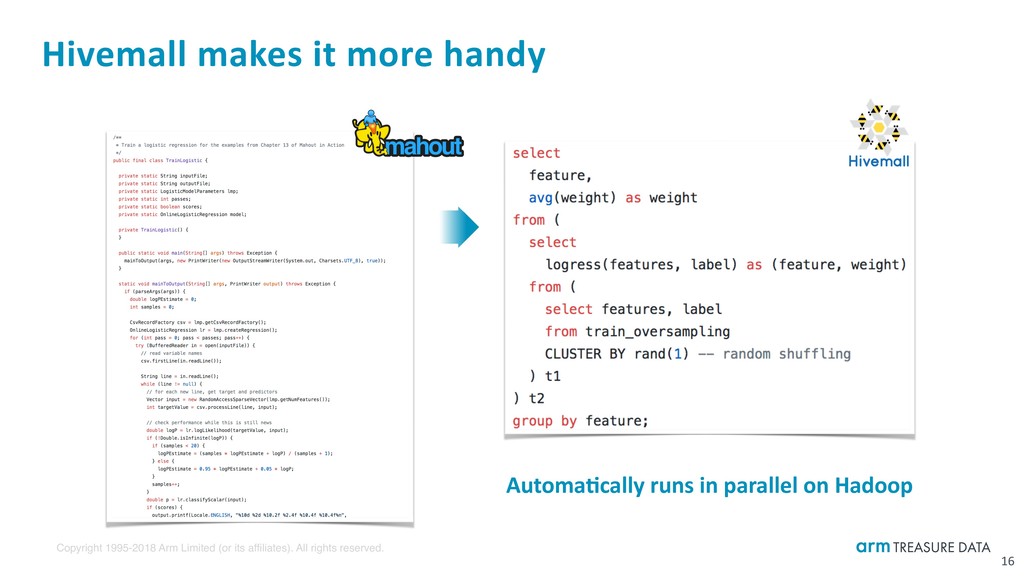
12 ‣ Scalable ML library implemented as Hive UDFs ‣ OSS project under Apache Software Foundation ‣ TD bundles Hivemall and has 3 developers (original creator + 2 core committers) https://github.com/apache/incubator-hivemall TD’s ML capability: Apache Hivemall Easy-to-use ML in SQL Scalable Runs in parallel on Hadoop ecosystem Versa:le Efficient, generic funcbons
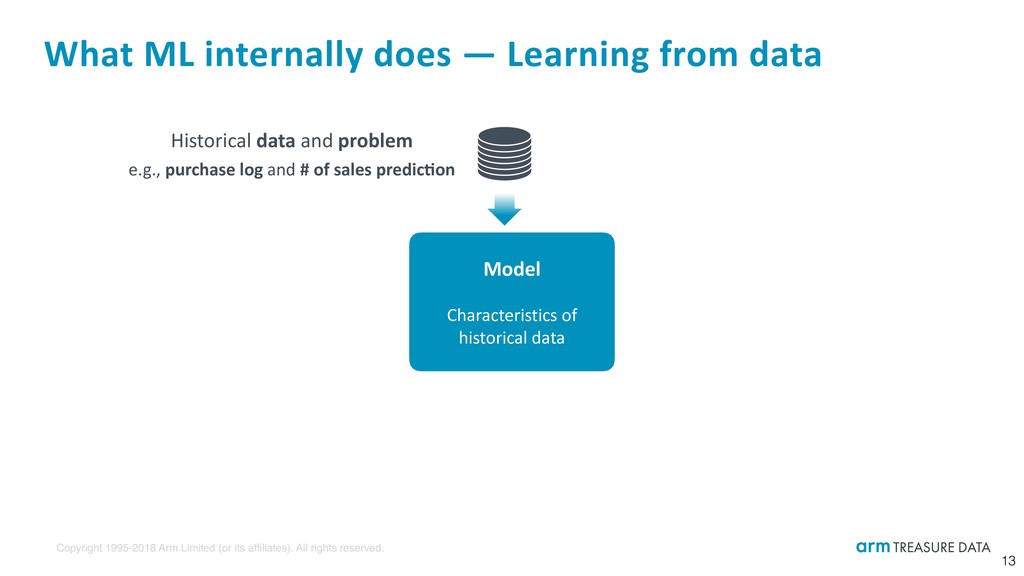
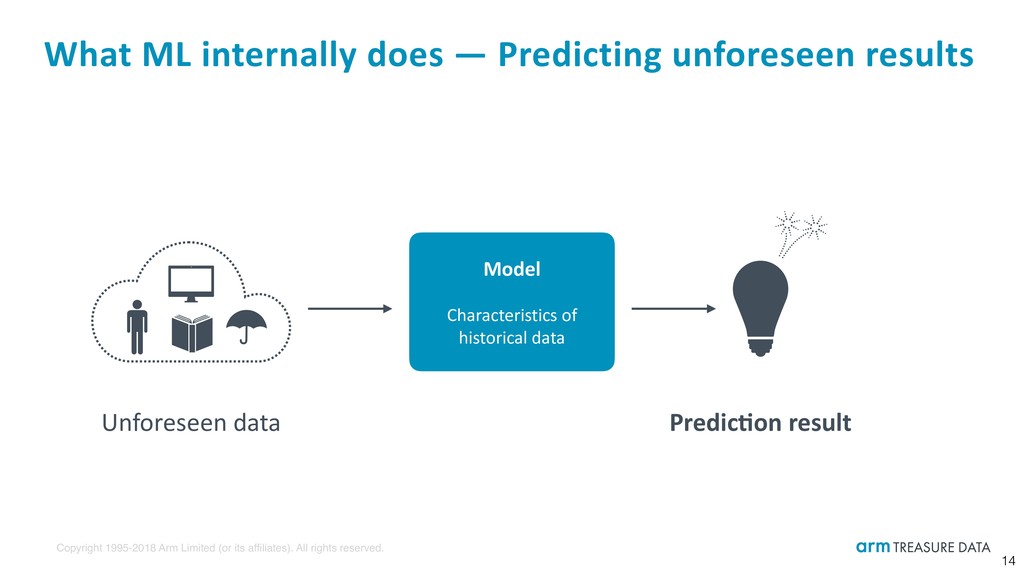
What ML internally does — Learning from data 13 Historical data and problem e.g., purchase log and # of sales predic:on Model Characteristics of historical data
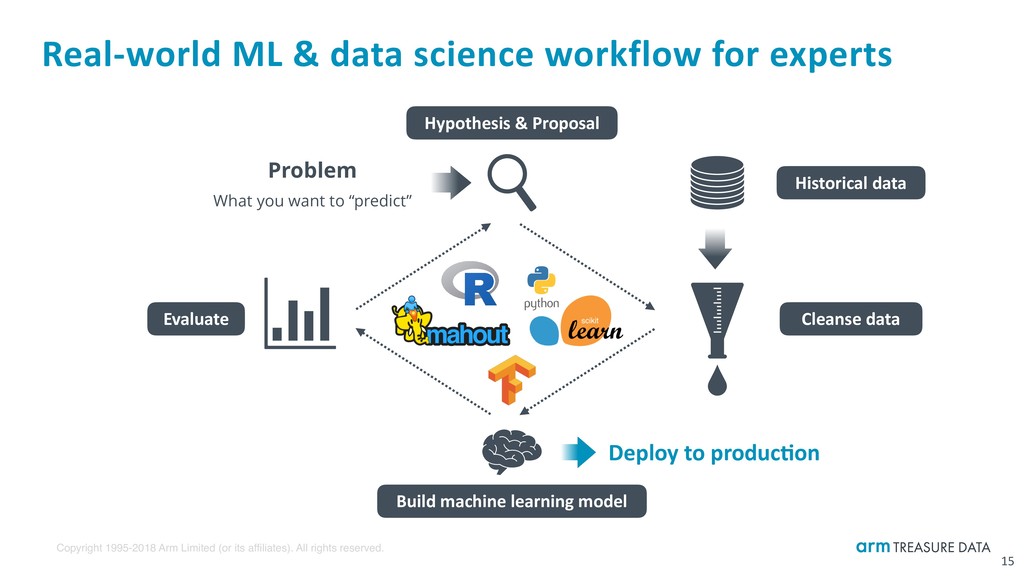
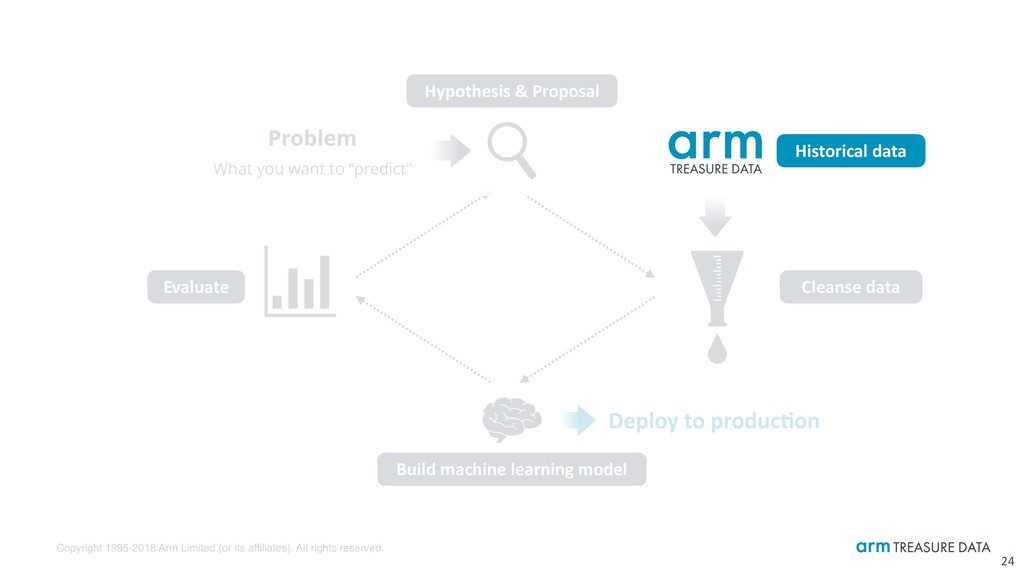
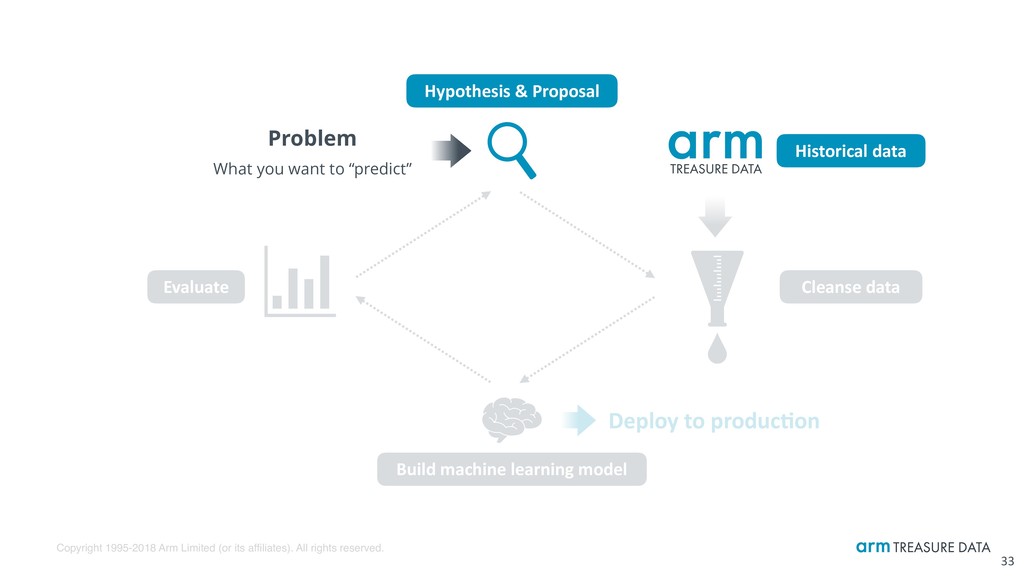
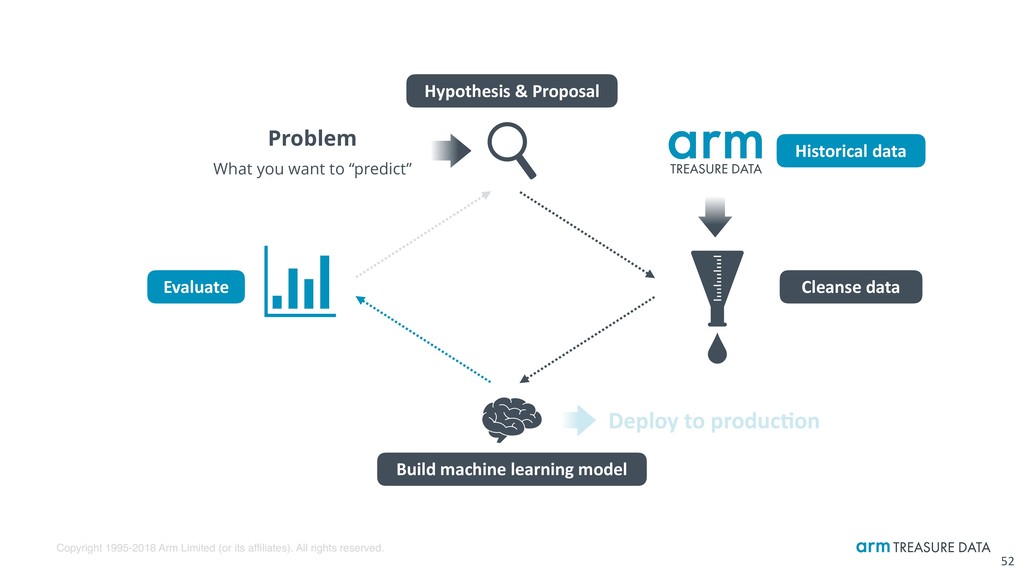
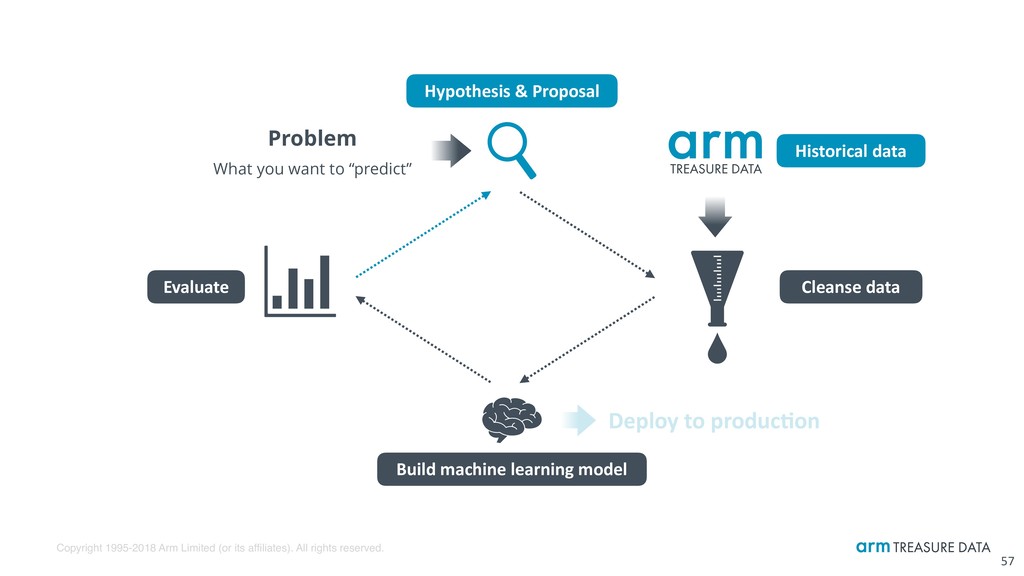
Real-world ML & data science workflow for experts 15 Problem What you want to “predict” Hypothesis & Proposal Build machine learning model Historical data Cleanse data Evaluate Deploy to produc:on
Query-based simple, scalable data science workflow on TD 17 Problem What you want to “predict” Hypothesis & Proposal Build machine learning model Historical data Cleanse data Evaluate Deploy to produc:on Easily try, save, share, schedule via simple I/F in scalable manner
Hivemall documentation http://hivemall.incubator.apache.org/userguide/ Step-by-step ML on Hivemall tutorial http://hivemall.incubator.apache.org/userguide/supervised_learning/tutorial.html Treasure Data ML workflow examples https://github.com/treasure-data/workflow-examples/tree/master/machine-learning 21
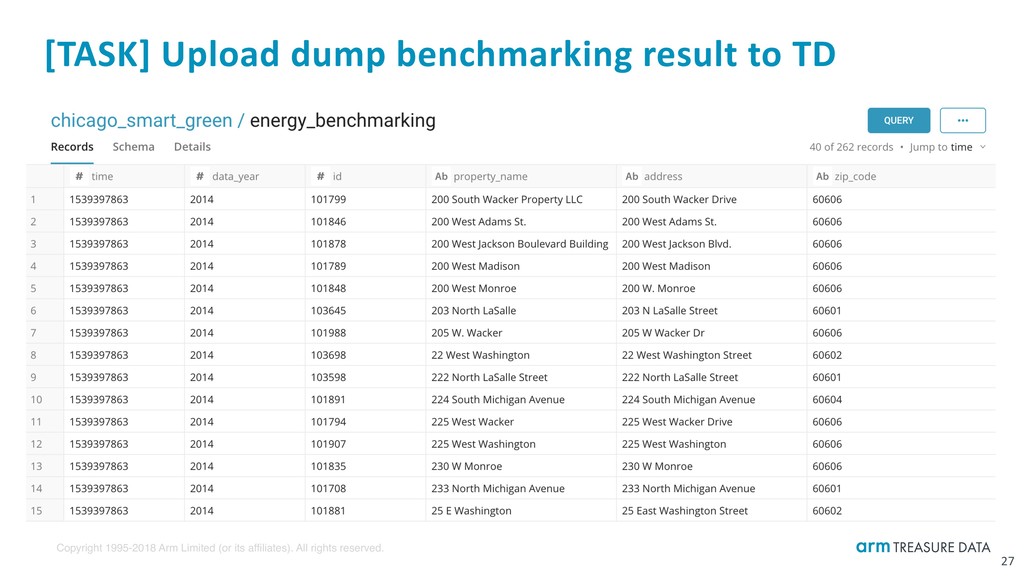
Sample scenario: City has historical energy benchmarking data 25 https://data.cityofchicago.org/Environment-Sustainable-Development/Chicago-Energy-Benchmarking/xq83-jr8c https://www.cityofchicago.org/city/en/progs/env/building-energy-benchmarking---transparency.html
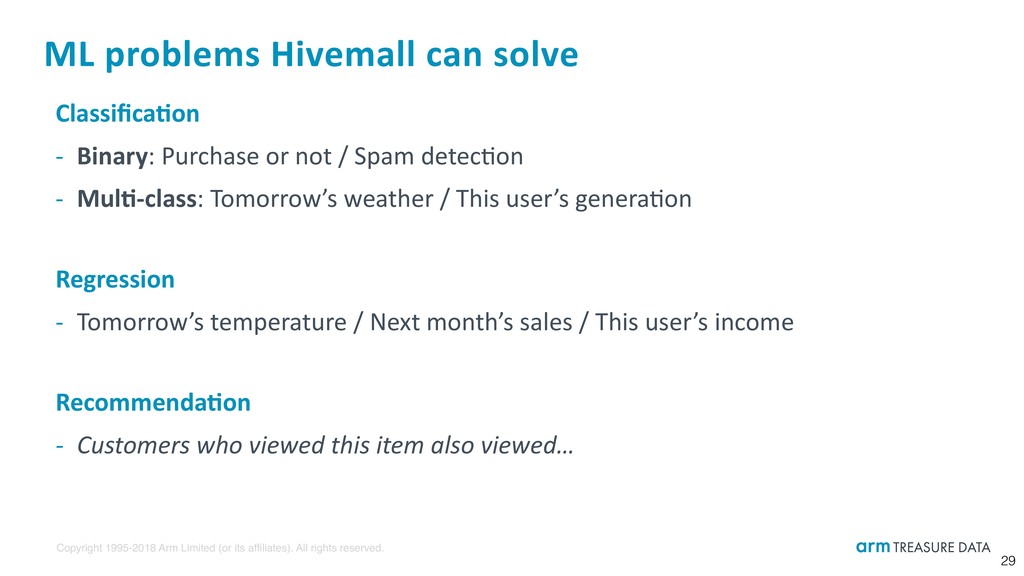
ML problems Hivemall can solve Classifica:on - Binary: Purchase or not / Spam detecbon - Mul:-class: Tomorrow’s weather / This user’s generabon Regression - Tomorrow’s temperature / Next month’s sales / This user’s income Recommenda:on - Customers who viewed this item also viewed… 29
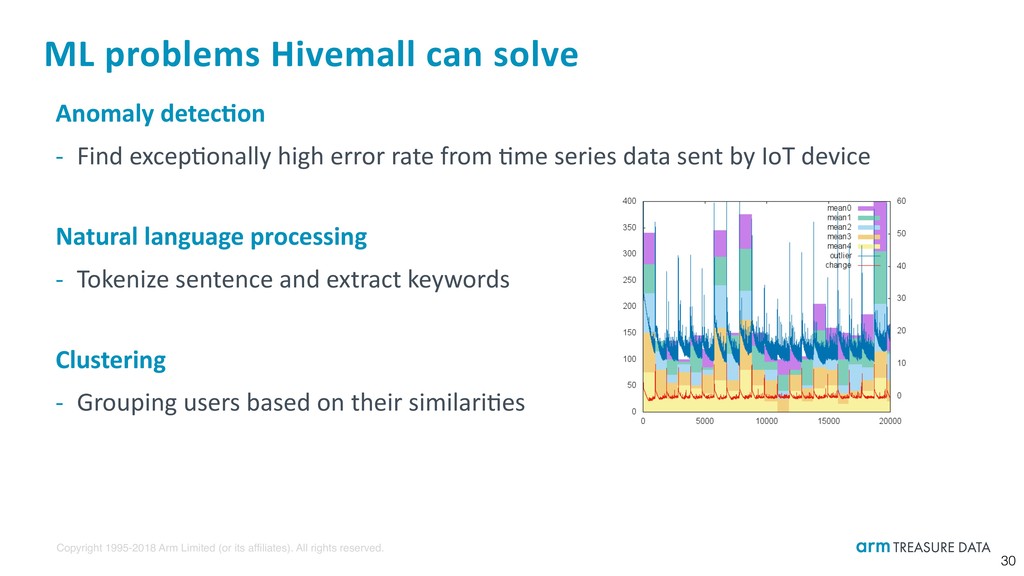
ML problems Hivemall can solve Anomaly detec:on - Find excepbonally high error rate from bme series data sent by IoT device Natural language processing - Tokenize sentence and extract keywords Clustering - Grouping users based on their similaribes 30
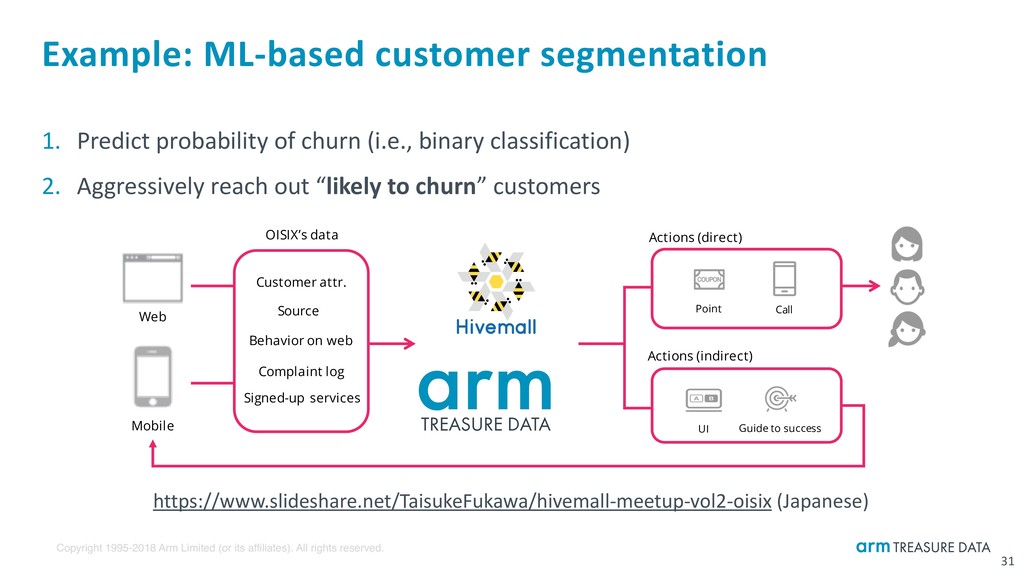
31 1. Predict probability of churn (i.e., binary classification) 2. Aggressively reach out “likely to churn” customers https://www.slideshare.net/TaisukeFukawa/hivemall-meetup-vol2-oisix (Japanese) Web Mobile Customer attr. Behavior on web Complaint log Source Signed-up services Actions (direct) Actions (indirect) Point Call Guide to success UI OISIX’s data Example: ML-based customer segmentation
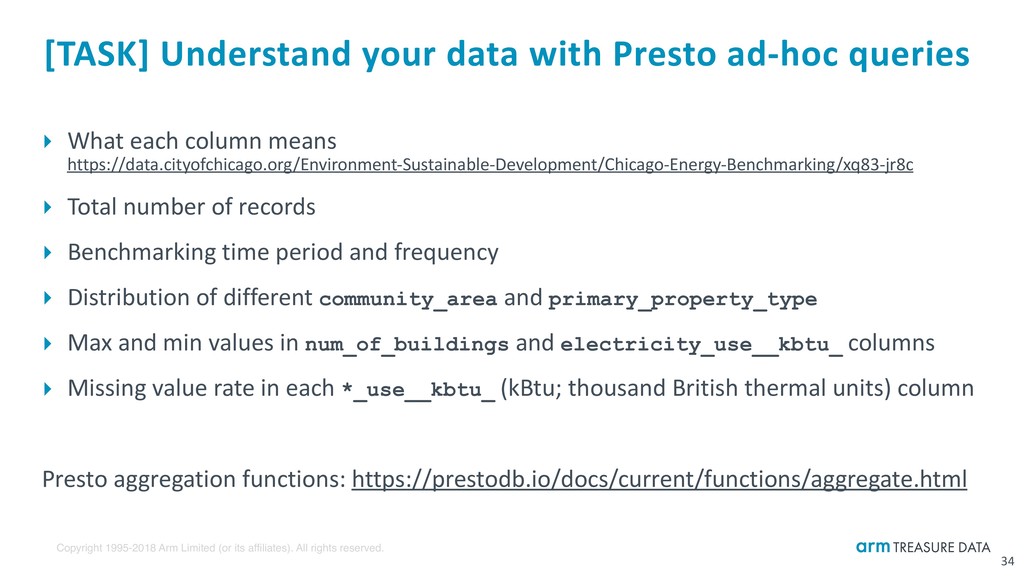
[TASK] Understand your data with Presto ad-hoc queries ‣ What each column means https://data.cityofchicago.org/Environment-Sustainable-Development/Chicago-Energy-Benchmarking/xq83-jr8c ‣ Total number of records ‣ Benchmarking time period and frequency ‣ Distribution of different community_area and primary_property_type ‣ Max and min values in num_of_buildings and electricity_use__kbtu_ columns ‣ Missing value rate in each *_use__kbtu_ (kBtu; thousand British thermal units) column Presto aggregation functions: https://prestodb.io/docs/current/functions/aggregate.html 34
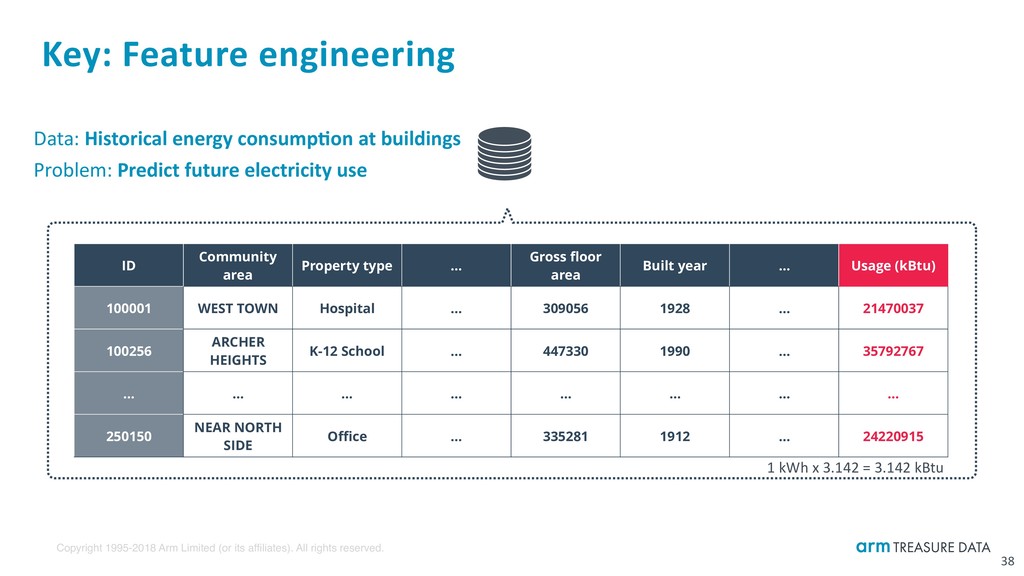
Key: Feature engineering 38 ID Community area Property type … Gross floor area Built year … Usage (kBtu) 100001 WEST TOWN Hospital … 309056 1928 … 21470037 100256 ARCHER HEIGHTS K-12 School … 447330 1990 … 35792767 … … … … … … … … 250150 NEAR NORTH SIDE Office … 335281 1912 … 24220915 Data: Historical energy consump:on at buildings Problem: Predict future electricity use 1 kWh x 3.142 = 3.142 kBtu
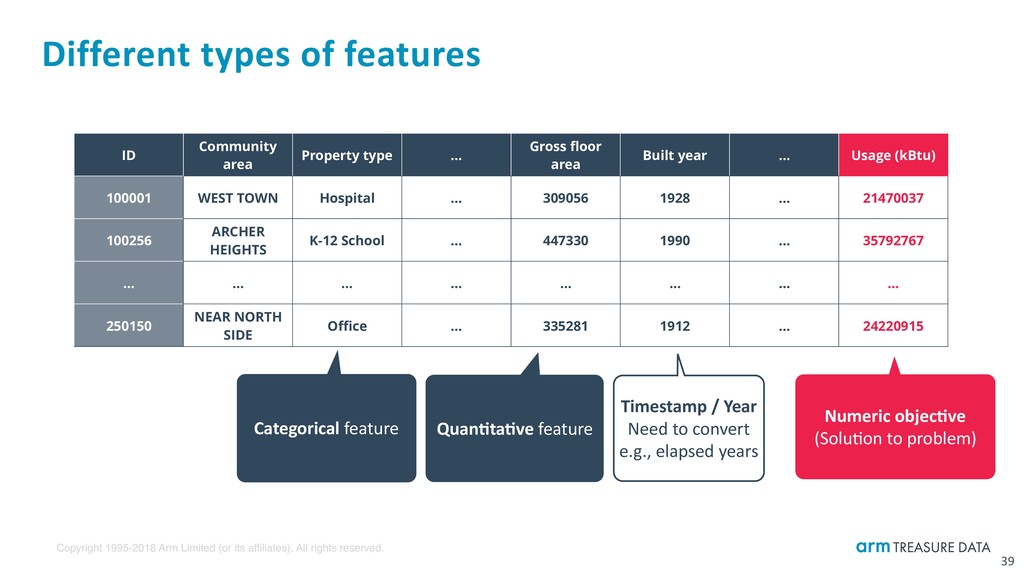
Different types of features 39 Numeric objec:ve (Solubon to problem) Categorical feature Quan:ta:ve feature Timestamp / Year Need to convert e.g., elapsed years ID Community area Property type … Gross floor area Built year … Usage (kBtu) 100001 WEST TOWN Hospital … 309056 1928 … 21470037 100256 ARCHER HEIGHTS K-12 School … 447330 1990 … 35792767 … … … … … … … … 250150 NEAR NORTH SIDE Office … 335281 1912 … 24220915
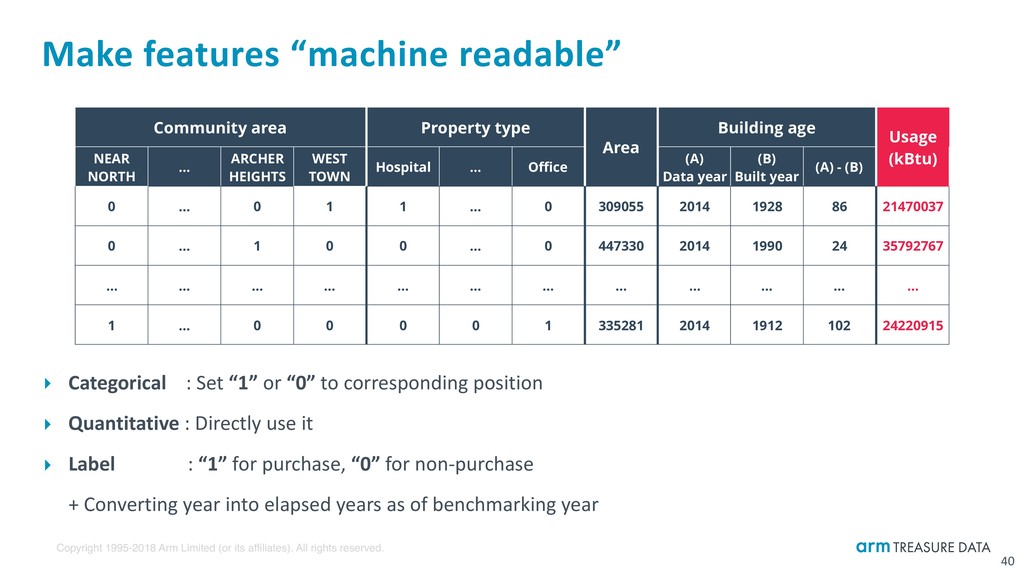
Make features “machine readable” ‣ Categorical : Set “1” or “0” to corresponding position ‣ Quantitative : Directly use it ‣ Label : “1” for purchase, “0” for non-purchase ‣ + Converting year into elapsed years as of benchmarking year 40 Community area Property type Area Building age Usage (kBtu) NEAR NORTH SIDE … ARCHER HEIGHTS WEST TOWN Hospital … Office (A) Data year (B) Built year (A) - (B) 0 … 0 1 1 … 0 309055 2014 1928 86 21470037 0 … 1 0 0 … 0 447330 2014 1990 24 35792767 … … … … … … … … … … … … 1 … 0 0 0 0 1 335281 2014 1912 102 24220915
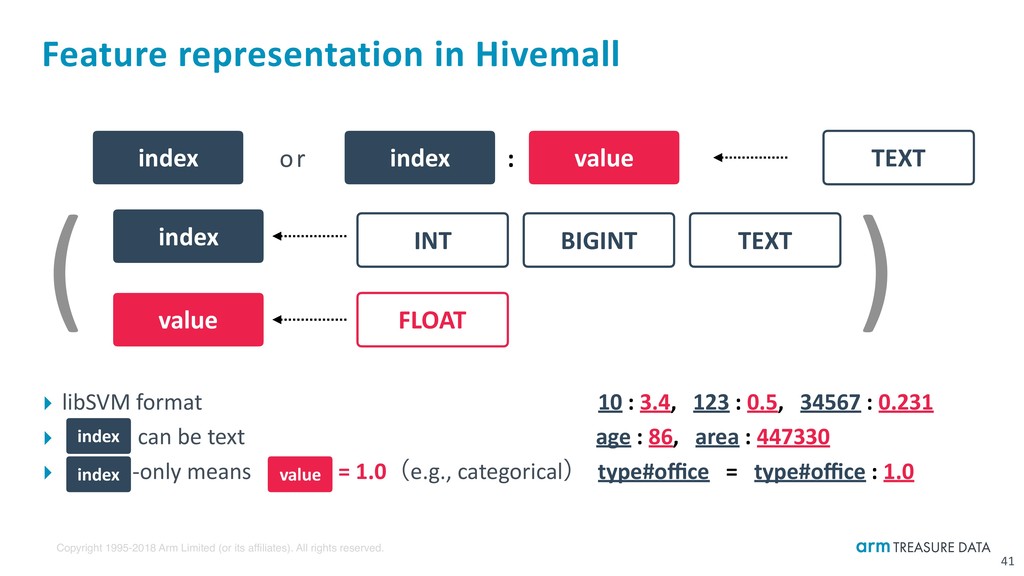
Feature representation in Hivemall ‣ libSVM formatɹɹɹɹɹɹɹɹɹɹɹɹɹɹ 10 : 3.4, 123 : 0.5, 34567 : 0.231 ‣ can be text ɹ ɹɹɹɹɹɹɹɹɹɹ age : 86, area : 447330 ‣ -only means = 1.0ʢe.g., categoricalʣ type#office = type#office : 1.0 41 index : value or index INT BIGINT TEXT FLOAT index value ( ) index value index TEXT
Array of quanbtabve features : select quantitative_features(array("age", "area"), 86, 447330) ["age:86.0", “area:447330"] Array of categorical features # select categorical_features(array(“commun", "type"), "NEAR NORTH", "office") [“commun#NEAR NORTH", “type#office”] * NULL is automabcally omired Hivemall internally does one-hot encoding (e.g., office → 1, 0, 0, …) Create feature vector in SQL 42 value index value index
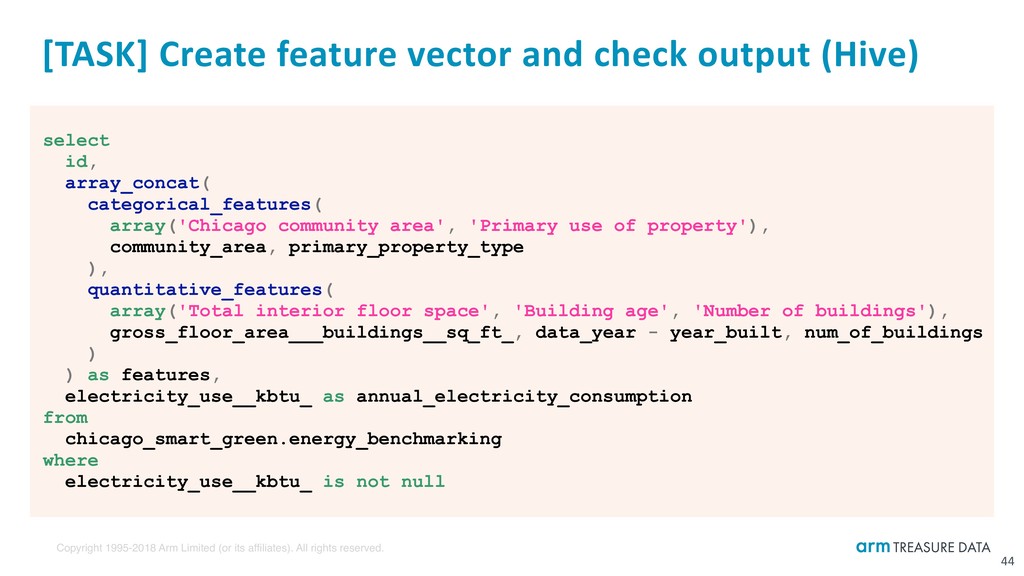
select id, array_concat( categorical_features( array('Chicago community area', 'Primary use of property'), community_area, primary_property_type ), quantitative_features( array('Total interior floor space', 'Building age', 'Number of buildings'), gross_floor_area___buildings__sq_ft_, data_year - year_built, num_of_buildings ) ) as features, electricity_use__kbtu_ as annual_electricity_consumption from chicago_smart_green.energy_benchmarking where electricity_use__kbtu_ is not null [TASK] Create feature vector and check output (Hive) 44
select id, feature_hashing( add_bias( array_concat( categorical_features( array('Chicago community area', 'Primary use of property'), community_area, primary_property_type ), quantitative_features( array('Total interior floor space', 'Building age', 'Number of buildings'), gross_floor_area___buildings__sq_ft_, data_year - year_built, num_of_buildings ) ) ) ) as features, electricity_use__kbtu_ as annual_electricity_consumption from chicago_smart_green.energy_benchmarking where electricity_use__kbtu_ is not null [TASK] Advanced technique: add_bias() and feature_hashing() 45
Training and prediction over features-label pairs 47 Model Table Train SQL Predict SQL Usage 21M 35M … 24M How about hospital in West Town built 10 years ago? Unforeseen 0 … 0 1 1 0 0 500k 10 West Town Hospital Age ? Historically, this building consumed… features 0 … 0 1 1 … 0 309k 86 0 … 1 0 0 … 0 447k 24 … … … … … … … … … 1 … 0 0 0 … 1 335k 102
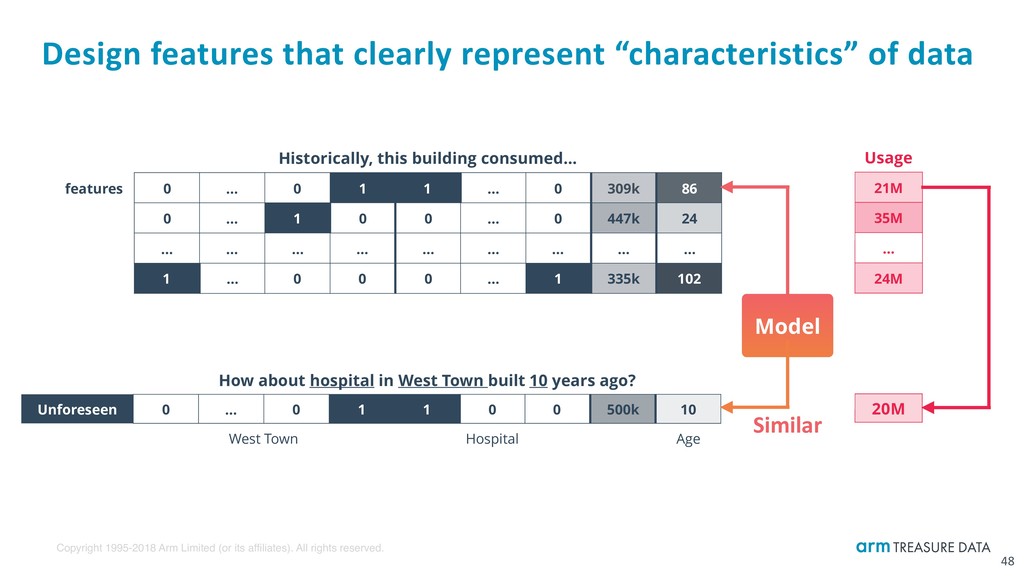
Design features that clearly represent “characteristics” of data 48 Model Usage 21M 35M … 24M How about hospital in West Town built 10 years ago? Unforeseen 0 … 0 1 1 0 0 500k 10 West Town Hospital Age 20M Historically, this building consumed… features 0 … 0 1 1 … 0 309k 86 0 … 1 0 0 … 0 447k 24 … … … … … … … … … 1 … 0 0 0 … 1 335k 102 Similar
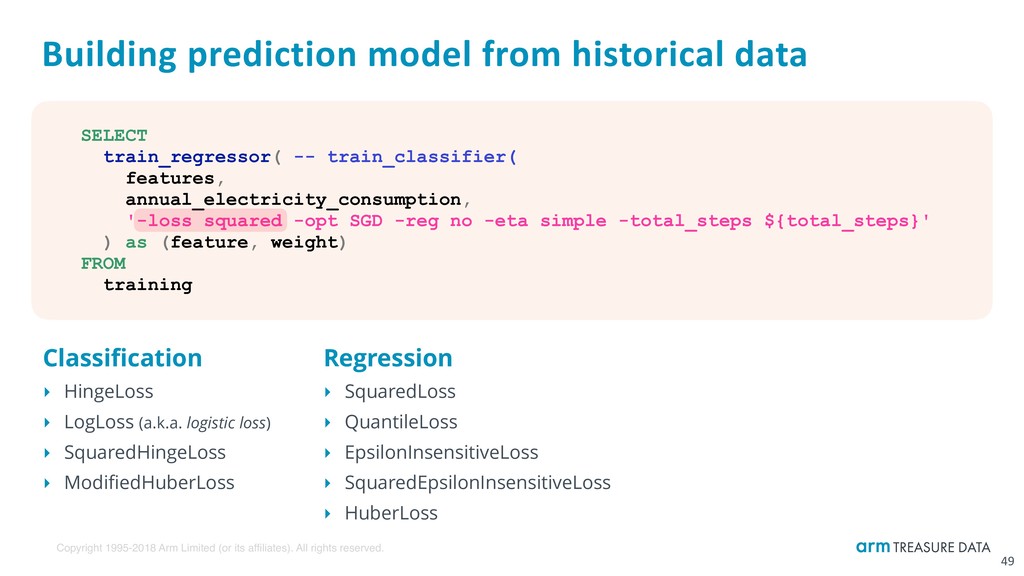
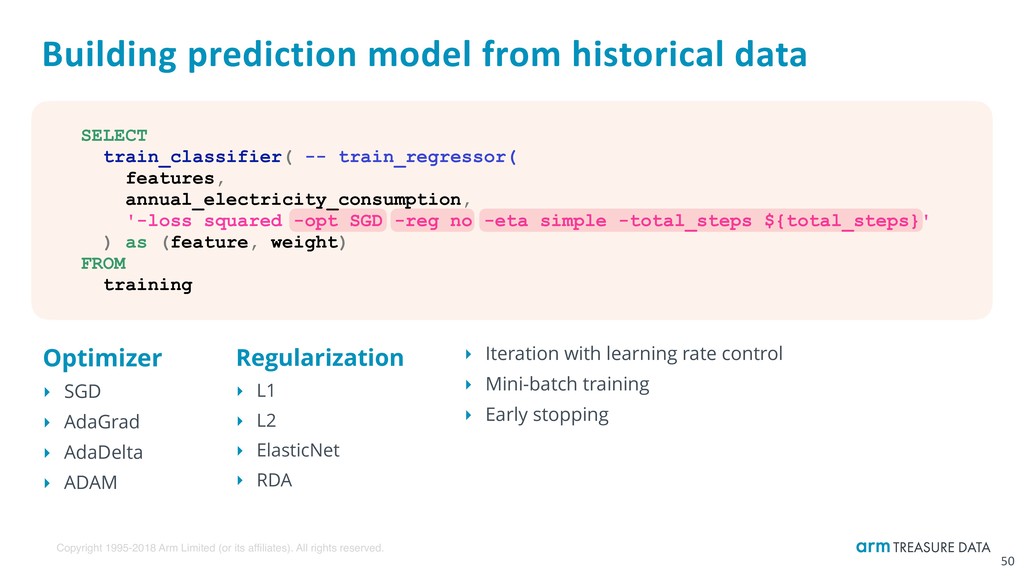
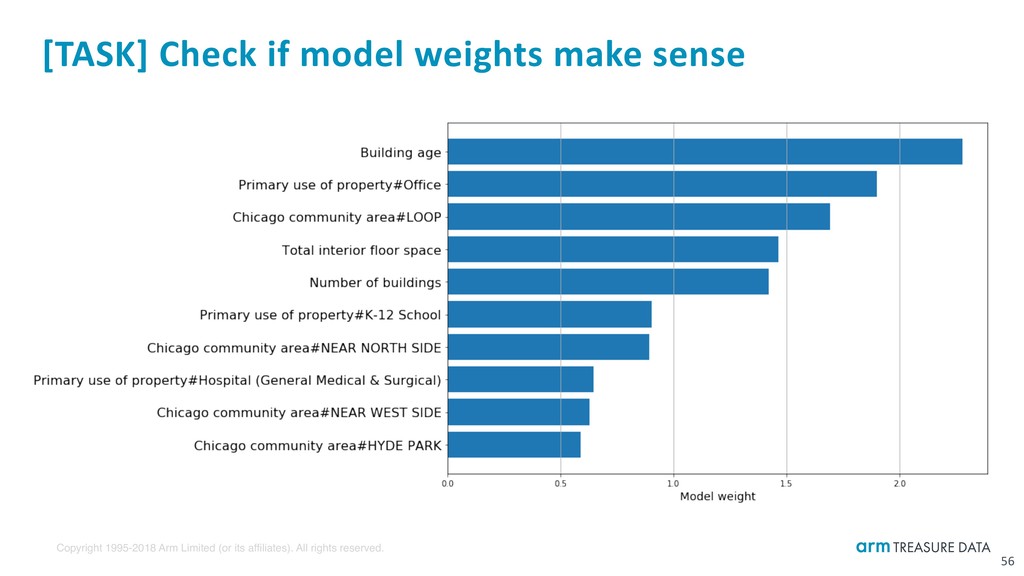
Building prediction model from historical data Optimizer ‣ SGD ‣ AdaGrad ‣ AdaDelta ‣ ADAM 50 SELECT train_classifier( -- train_regressor( features, annual_electricity_consumption, '-loss squared -opt SGD -reg no -eta simple -total_steps ${total_steps}' ) as (feature, weight) FROM training Regularization ‣ L1 ‣ L2 ‣ ElasticNet ‣ RDA ‣ Iteration with learning rate control ‣ Mini-batch training ‣ Early stopping
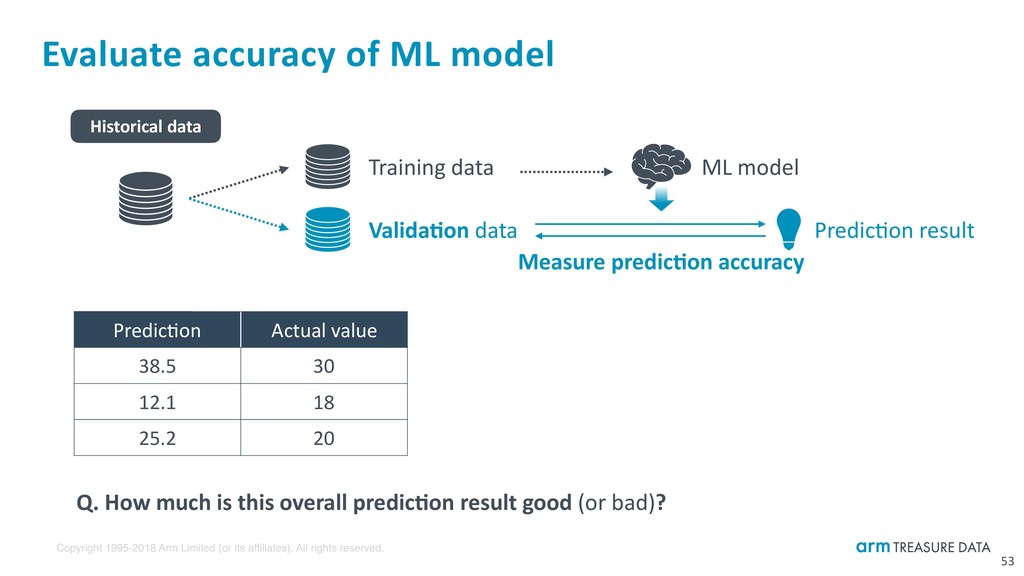
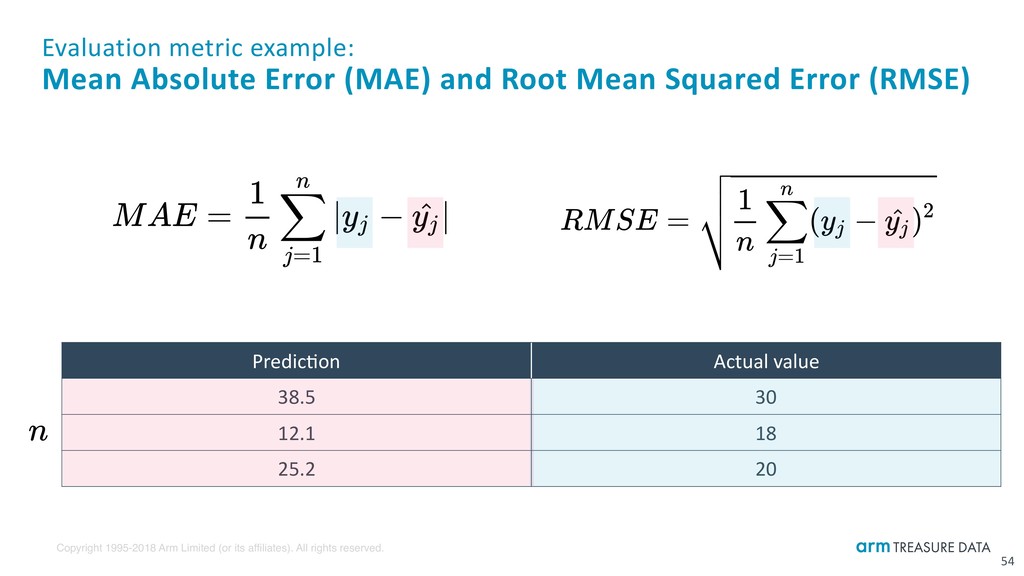
Evaluate accuracy of ML model 53 Historical data Training data Valida:on data ML model Predicbon result Measure predic:on accuracy Predicbon Actual value 38.5 30 12.1 18 25.2 20 Q. How much is this overall predic:on result good (or bad)?
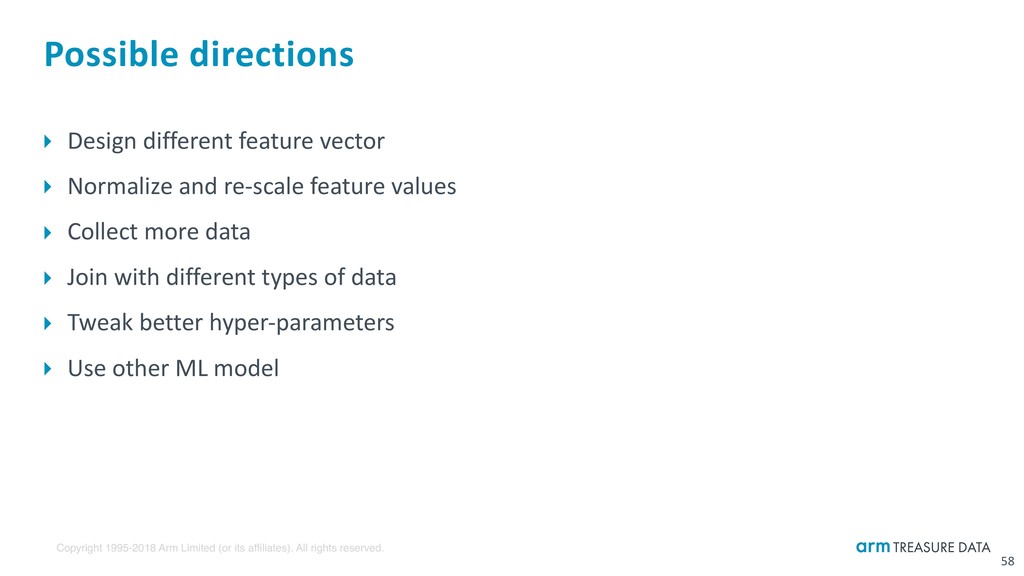
Possible directions ‣ Design different feature vector ‣ Normalize and re-scale feature values ‣ Collect more data ‣ Join with different types of data ‣ Tweak better hyper-parameters ‣ Use other ML model 58
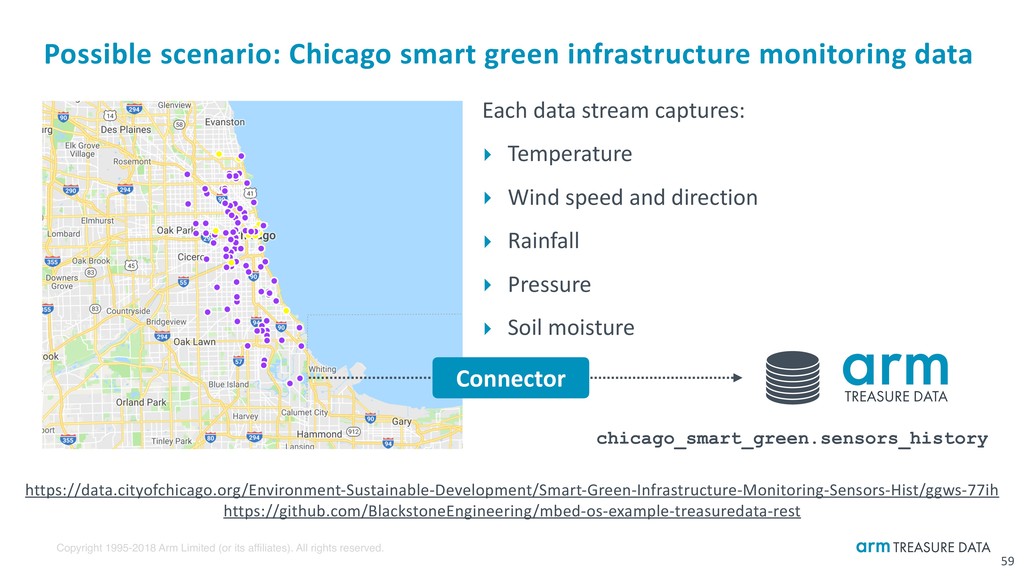
Possible scenario: Chicago smart green infrastructure monitoring data https://data.cityofchicago.org/Environment-Sustainable-Development/Smart-Green-Infrastructure-Monitoring-Sensors-Hist/ggws-77ih https://github.com/BlackstoneEngineering/mbed-os-example-treasuredata-rest Each data stream captures: ‣ Temperature ‣ Wind speed and direction ‣ Rainfall ‣ Pressure ‣ Soil moisture 59 Connector chicago_smart_green.sensors_history
60 sensors_history Environmental monitoring results from many sensors deployed in city community_areas (auxiliary data from CSV import) Definition of community area boundaries energy_benchmarking Result of annual energy benchmarking for large buildings in city Database — chicago_smart_green Latitude, Longitude Area
Joining different datasets on geospatial information 61 ST_Contains( ST_GeometryFromText(community_areas.the_geom), ST_Point(sensors_historical.longitude, sensors_historical.latitude) ) https://prestodb.io/docs/current/functions/geospatial.html
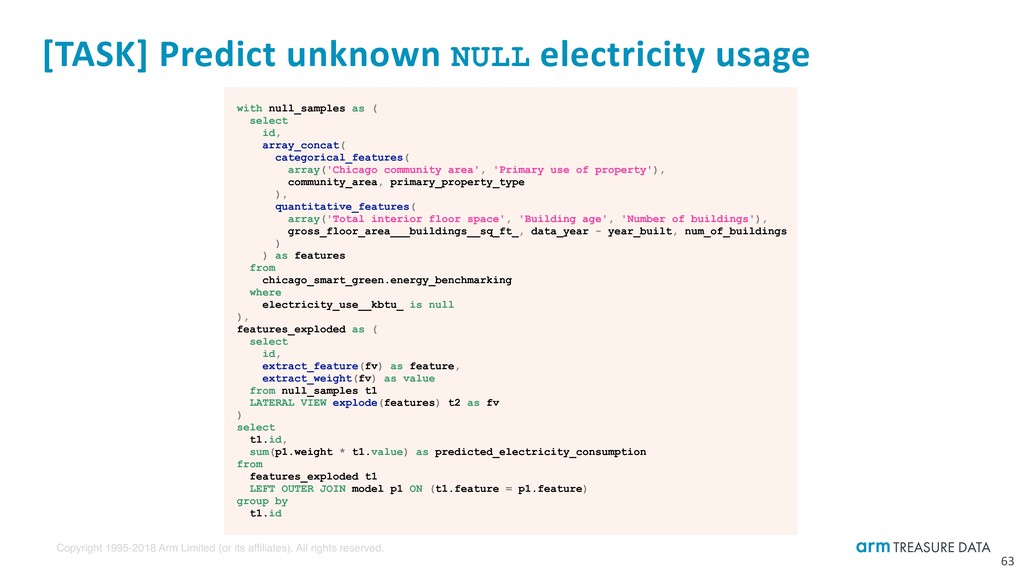
[TASK] Predict unknown NULL electricity usage 63 with null_samples as ( select id, array_concat( categorical_features( array('Chicago community area', 'Primary use of property'), community_area, primary_property_type ), quantitative_features( array('Total interior floor space', 'Building age', 'Number of buildings'), gross_floor_area___buildings__sq_ft_, data_year - year_built, num_of_buildings ) ) as features from chicago_smart_green.energy_benchmarking where electricity_use__kbtu_ is null ), features_exploded as ( select id, extract_feature(fv) as feature, extract_weight(fv) as value from null_samples t1 LATERAL VIEW explode(features) t2 as fv ) select t1.id, sum(p1.weight * t1.value) as predicted_electricity_consumption from features_exploded t1 LEFT OUTER JOIN model p1 ON (t1.feature = p1.feature) group by t1.id
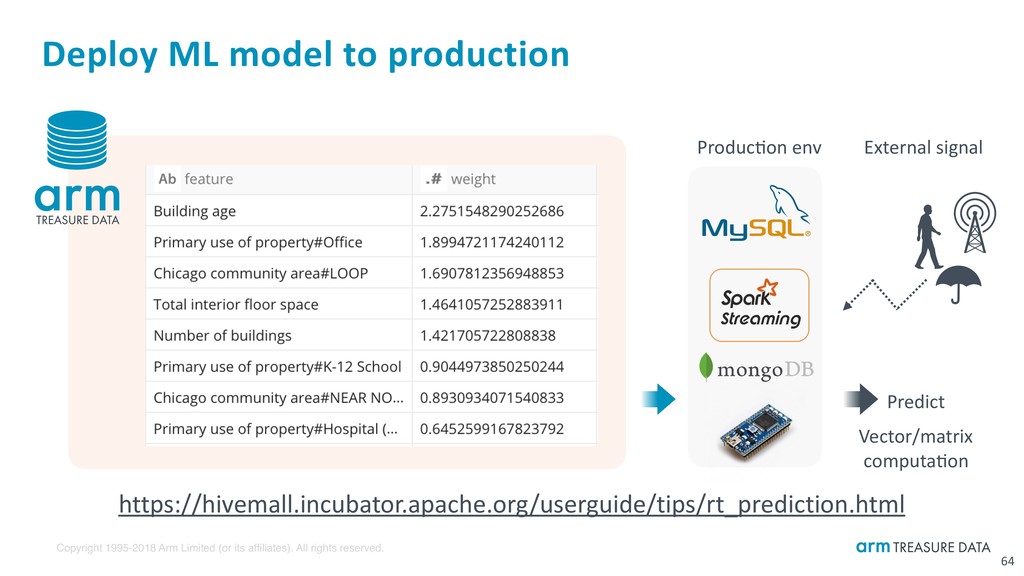
Deploy ML model to production 64 https://hivemall.incubator.apache.org/userguide/tips/rt_prediction.html Producbon env External signal Predict Vector/matrix computabon
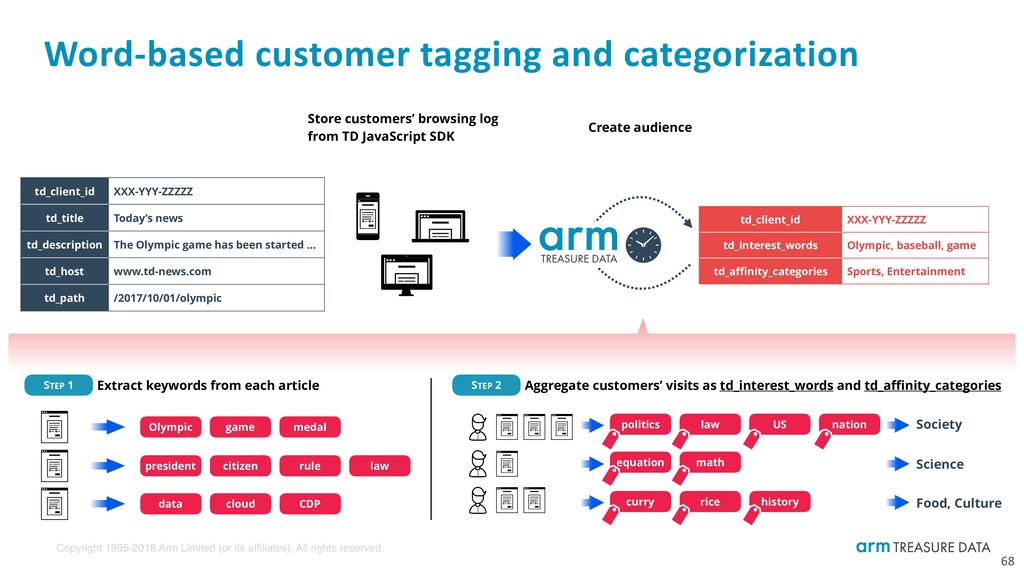
Word-based customer tagging and categorization 68 Store customers’ browsing log from TD JavaScript SDK STEP 1 Extract keywords from each article STEP 2 Aggregate customers’ visits as td_interest_words and td_affinity_categories Society Olympic game medal president citizen rule law data cloud CDP Create audience politics law US nation equation math curry rice history Science Food, Culture td_client_id XXX-YYY-ZZZZZ td_title Today’s news td_description The Olympic game has been started … td_host www.td-news.com td_path /2017/10/01/olympic td_client_id XXX-YYY-ZZZZZ td_interest_words Olympic, baseball, game td_affinity_categories Sports, Entertainment
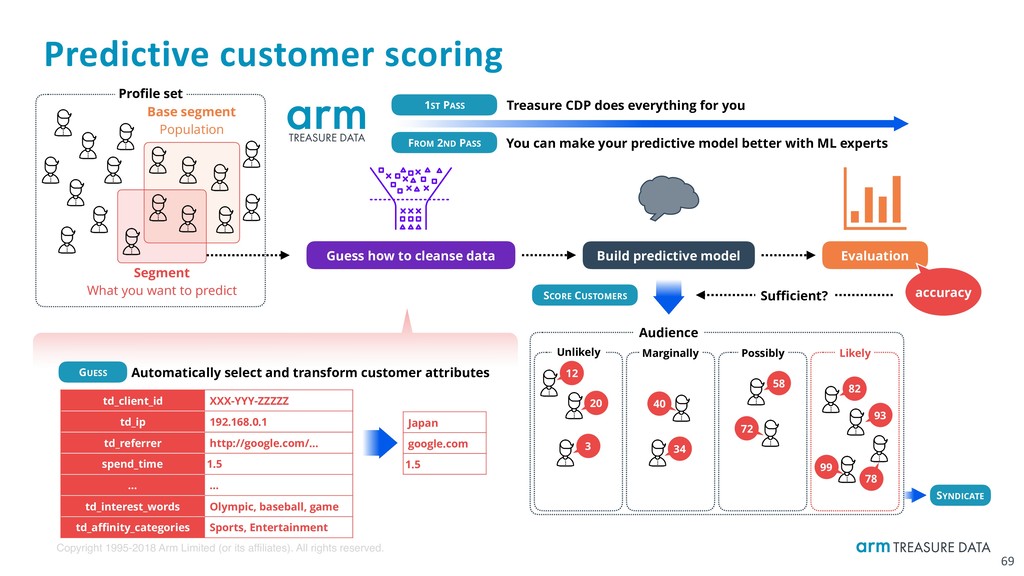
td_client_id XXX-YYY-ZZZZZ td_ip 192.168.0.1 td_referrer http://google.com/… spend_time 1.5 … … td_interest_words Olympic, baseball, game td_affinity_categories Sports, Entertainment Profile set Segment What you want to predict Build predictive model Guess how to cleanse data Evaluation Japan google.com 1.5 accuracy Sufficient? Audience Unlikely Marginally Possibly Likely 12 20 3 34 40 72 58 82 93 99 78 GUESS Automatically select and transform customer attributes 1ST PASS Treasure CDP does everything for you FROM 2ND PASS You can make your predictive model better with ML experts SCORE CUSTOMERS SYNDICATE Base segment Population Predictive customer scoring 69