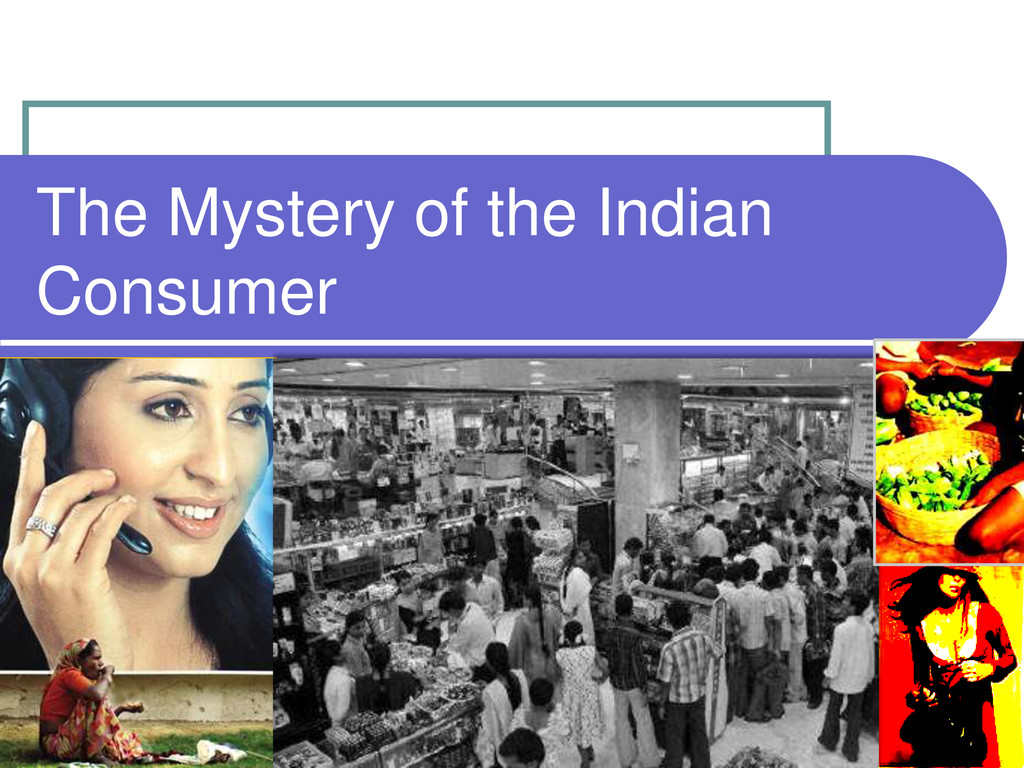
The Indian Consumer is a mass of dichotomoy and virtually an impenetrable for the marketer unless they understand the psyche. The Mystery of the Indian Consumer is a presentation on what is it that makes the Indian consumer tick.
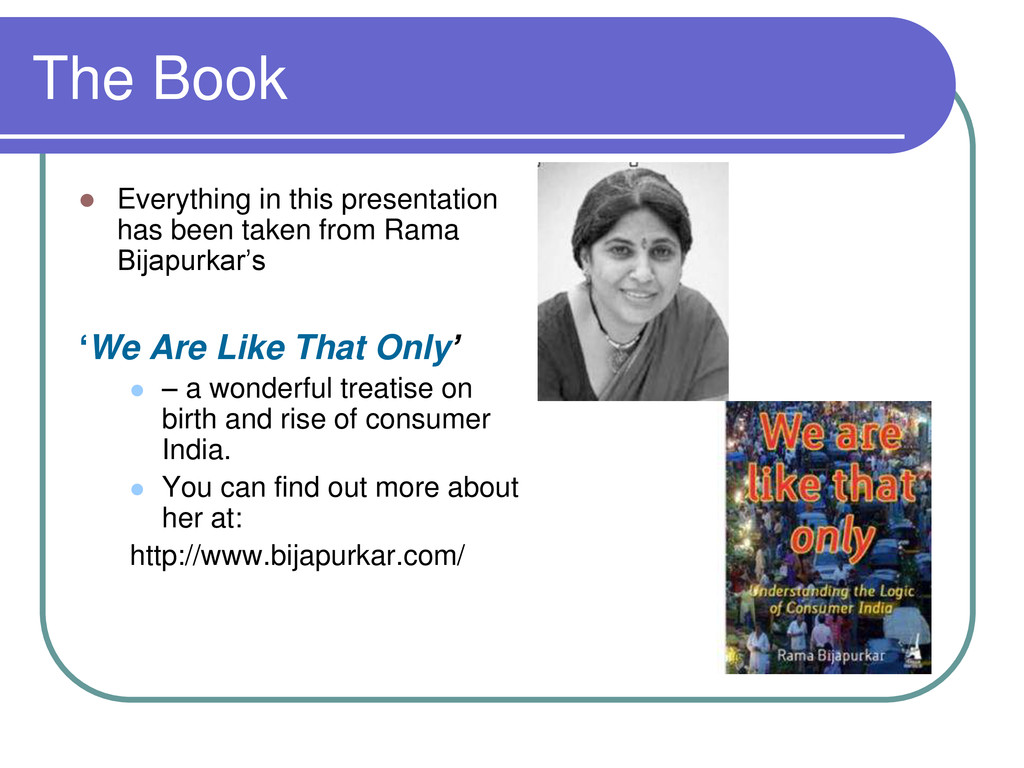
from Rama Bijapurkar’s ‘We Are Like That Only’ – a wonderful treatise on birth and rise of consumer India. You can find out more about her at: http://www.bijapurkar.com/
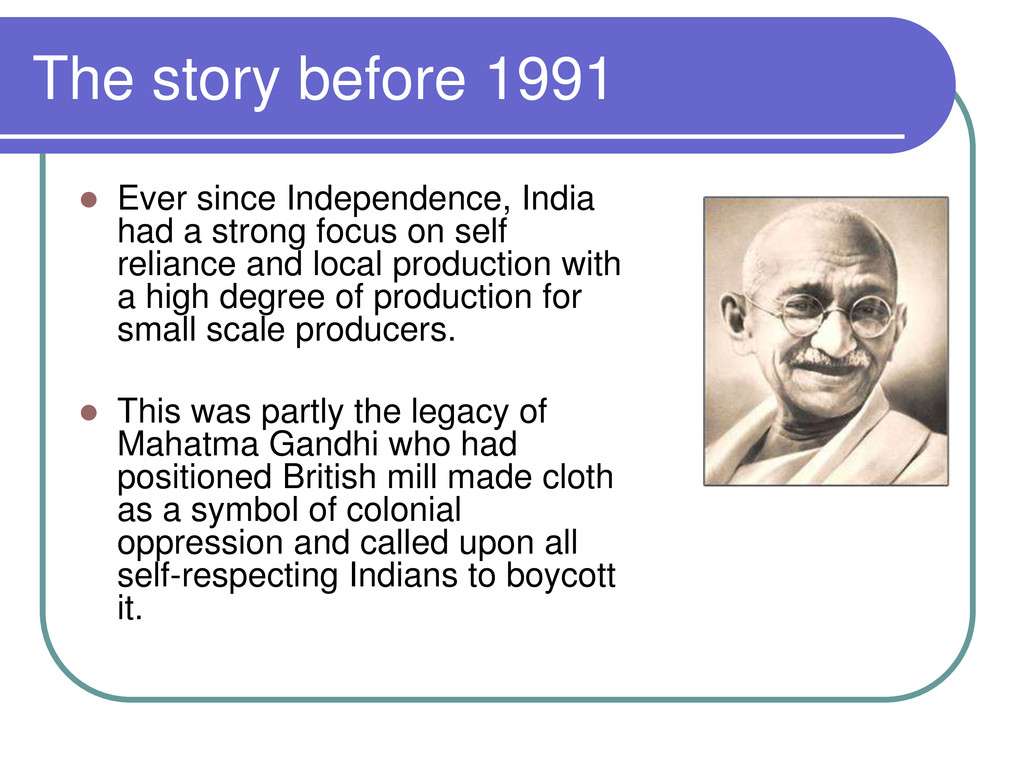
a strong focus on self reliance and local production with a high degree of production for small scale producers. This was partly the legacy of Mahatma Gandhi who had positioned British mill made cloth as a symbol of colonial oppression and called upon all self-respecting Indians to boycott it.
government that was in charge of business. It was the government that largely determined who produced how much of what. Prices were unreasonably high, and taxes, the largest component of prices, were particularly high especially on whatever the government decided were luxury items – be it shoes, shampoos, light bulbs, lipsticks, air conditioners or even branded apparel.
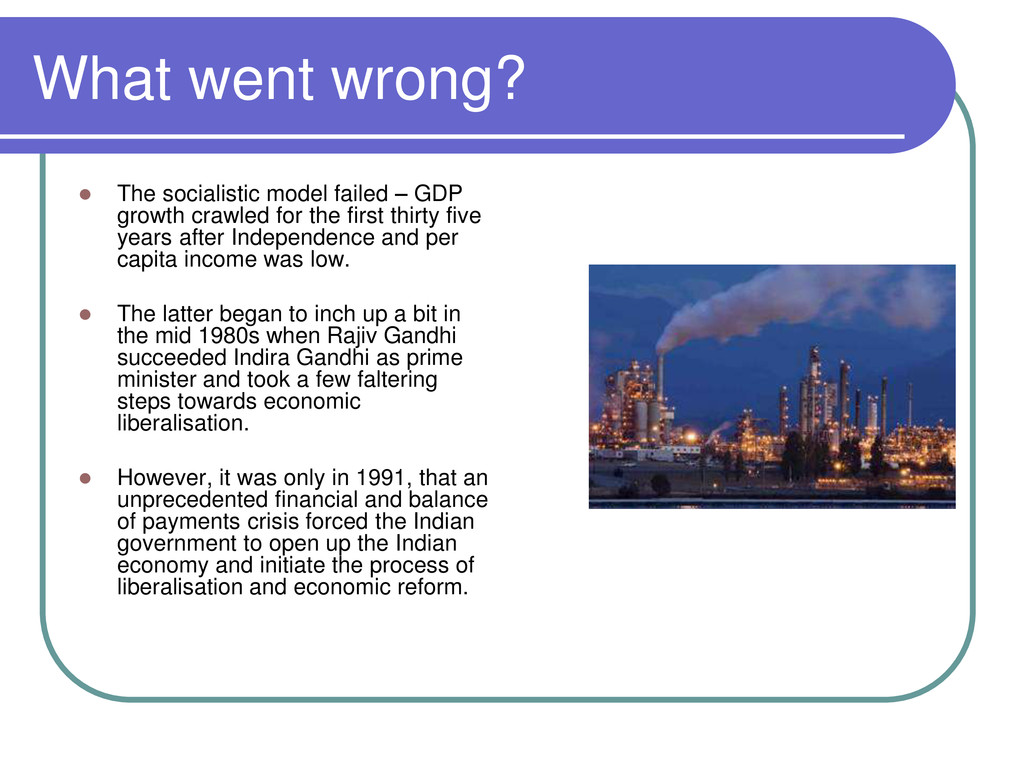
growth crawled for the first thirty five years after Independence and per capita income was low. The latter began to inch up a bit in the mid 1980s when Rajiv Gandhi succeeded Indira Gandhi as prime minister and took a few faltering steps towards economic liberalisation. However, it was only in 1991, that an unprecedented financial and balance of payments crisis forced the Indian government to open up the Indian economy and initiate the process of liberalisation and economic reform.
jumped up National income increased Consumers started to see tangible improvements in their lives with each passing year. Instead of two government run channels – 100s of TV channels flooded the consumer’s TV sets.
taxes and import duties. Delicensing led to competition and a supply side renaissance in category after category There was a lot more to buy, available at a cheaper rate and better than before.
over a billion people, residing in the world’s fourth largest economy in PPP terms, and consistently growing – should have been the end of this story. The ideal ending line should have read - ‘ Consumer India integrates with the global consumer market scene and is enthusiastically welcomed as a new source of growth by global corporations, smoothly rolling out their global strategies, duly adjusted for cultural sensitivity’.
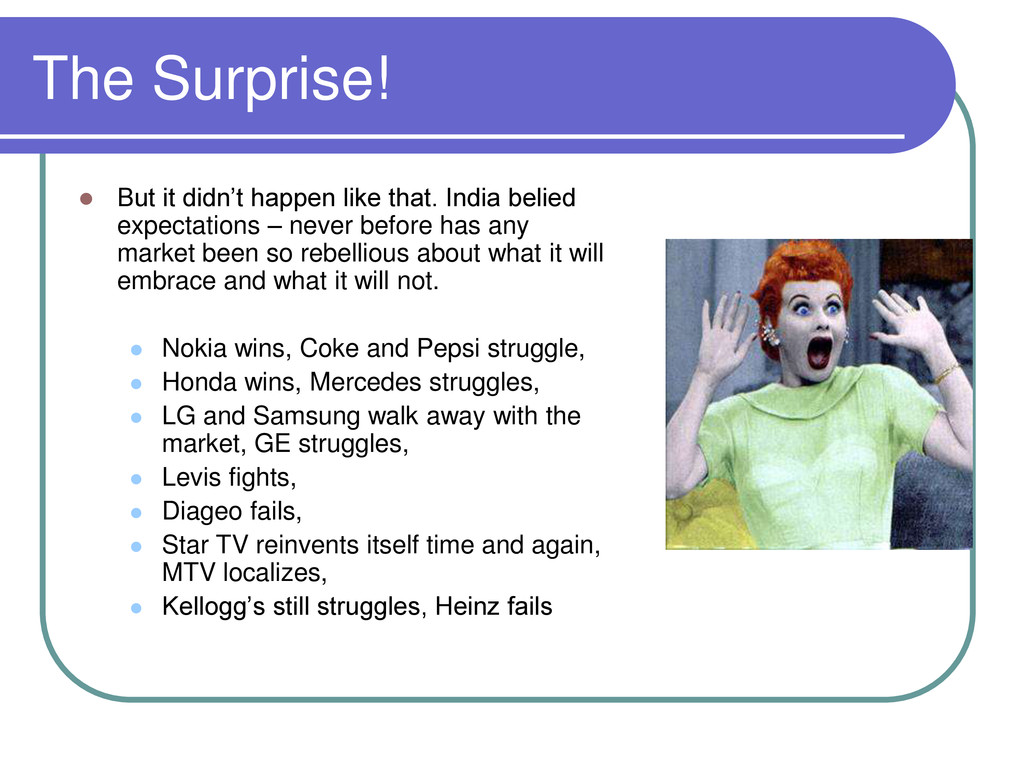
belied expectations – never before has any market been so rebellious about what it will embrace and what it will not. Nokia wins, Coke and Pepsi struggle, Honda wins, Mercedes struggles, LG and Samsung walk away with the market, GE struggles, Levis fights, Diageo fails, Star TV reinvents itself time and again, MTV localizes, Kellogg’s still struggles, Heinz fails
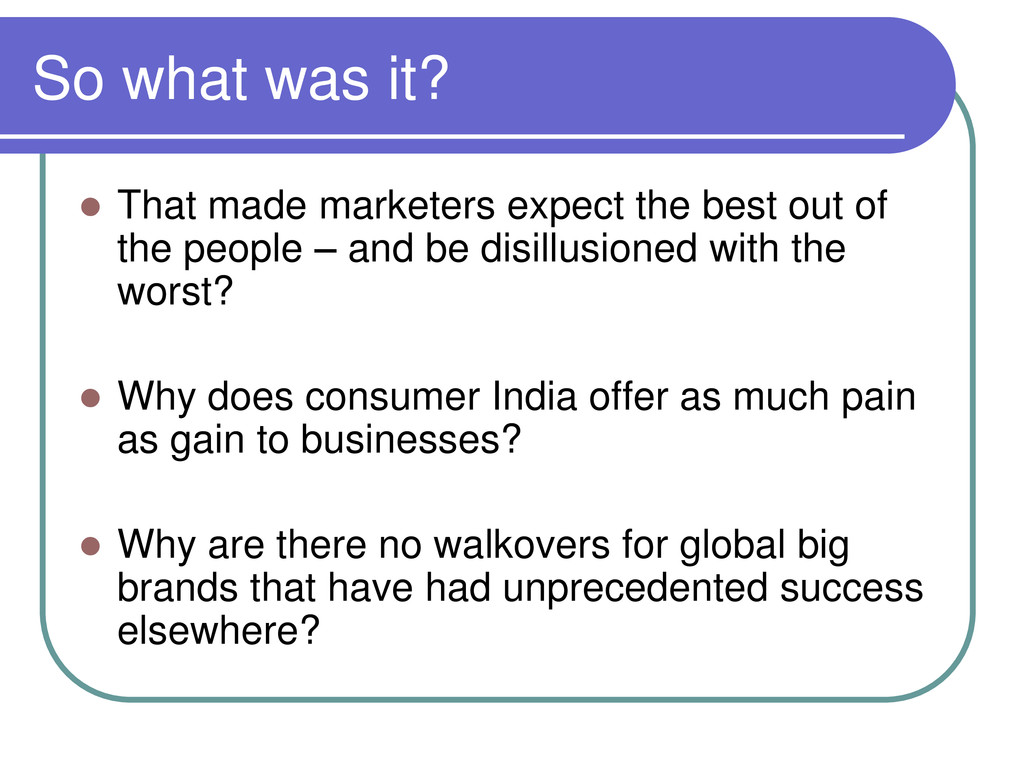
best out of the people – and be disillusioned with the worst? Why does consumer India offer as much pain as gain to businesses? Why are there no walkovers for global big brands that have had unprecedented success elsewhere?
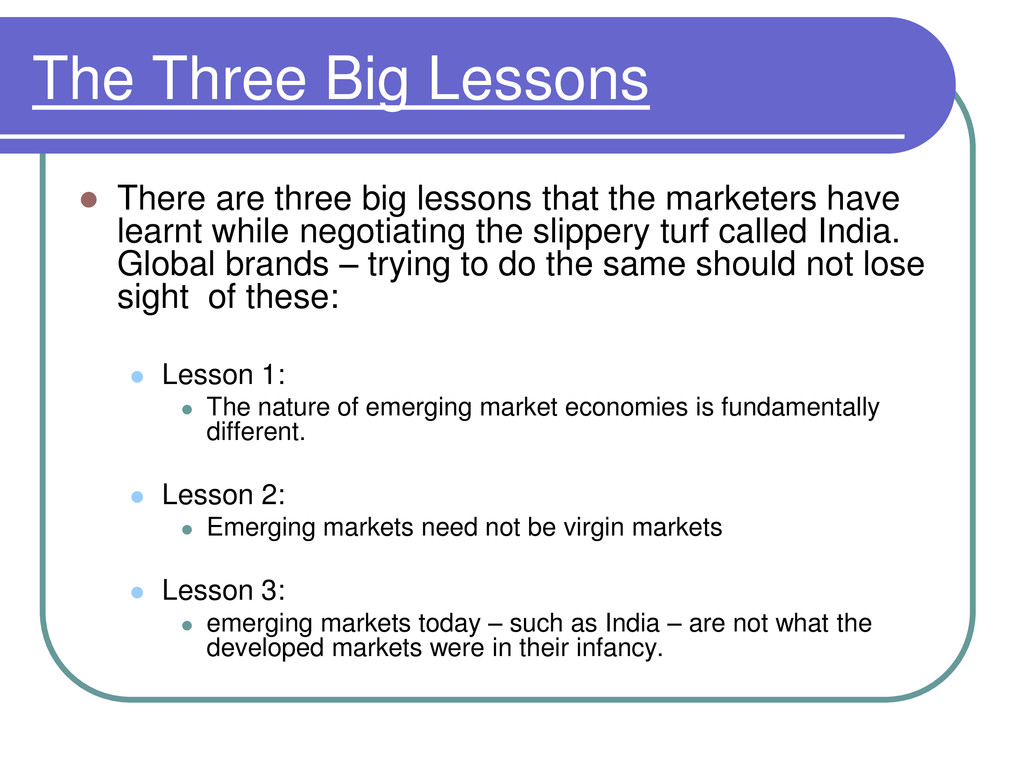
that the marketers have learnt while negotiating the slippery turf called India. Global brands – trying to do the same should not lose sight of these: Lesson 1: The nature of emerging market economies is fundamentally different. Lesson 2: Emerging markets need not be virgin markets Lesson 3: emerging markets today – such as India – are not what the developed markets were in their infancy.
their total size but small in terms of per capita income – India being a prime example. As far as India is concerned – a fundamental rethink around appropriate ‘made for India’ proposition is needed which replaces the conventional wisdom of ‘global standard’ benefits ‘global equivalent prices’ .
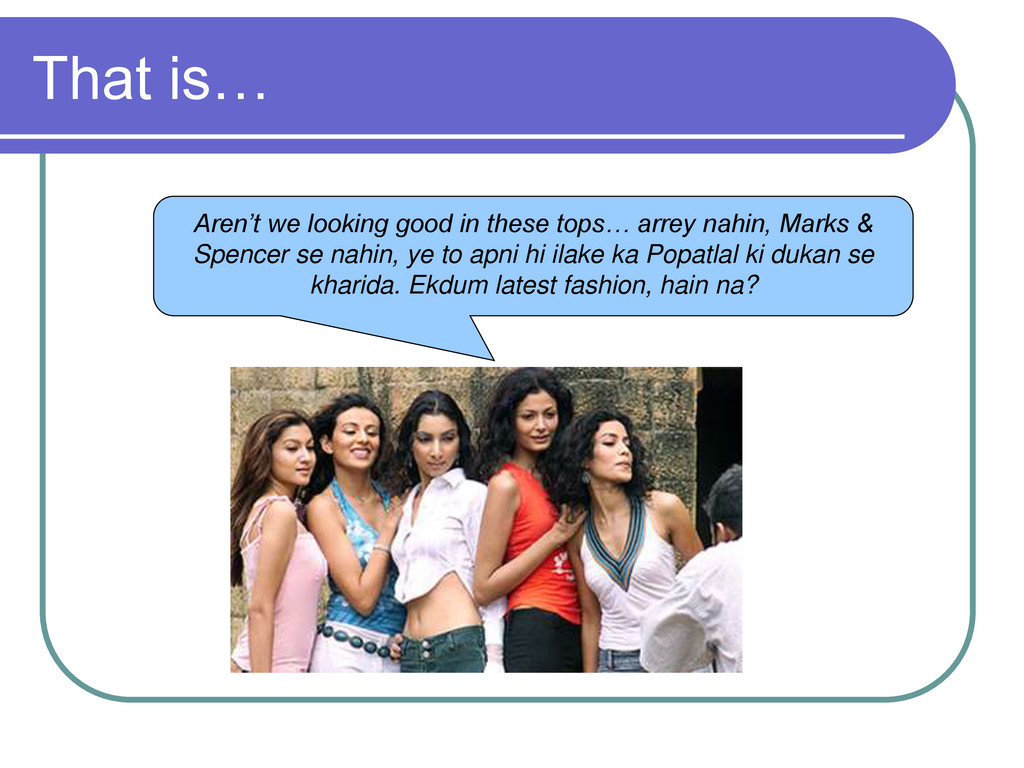
there can already exist an array of home grown options in many categories, which can offer tough competition to new entrants. They can be several and diverse, traditional and modern, indianized and international… all available at several price performance points.
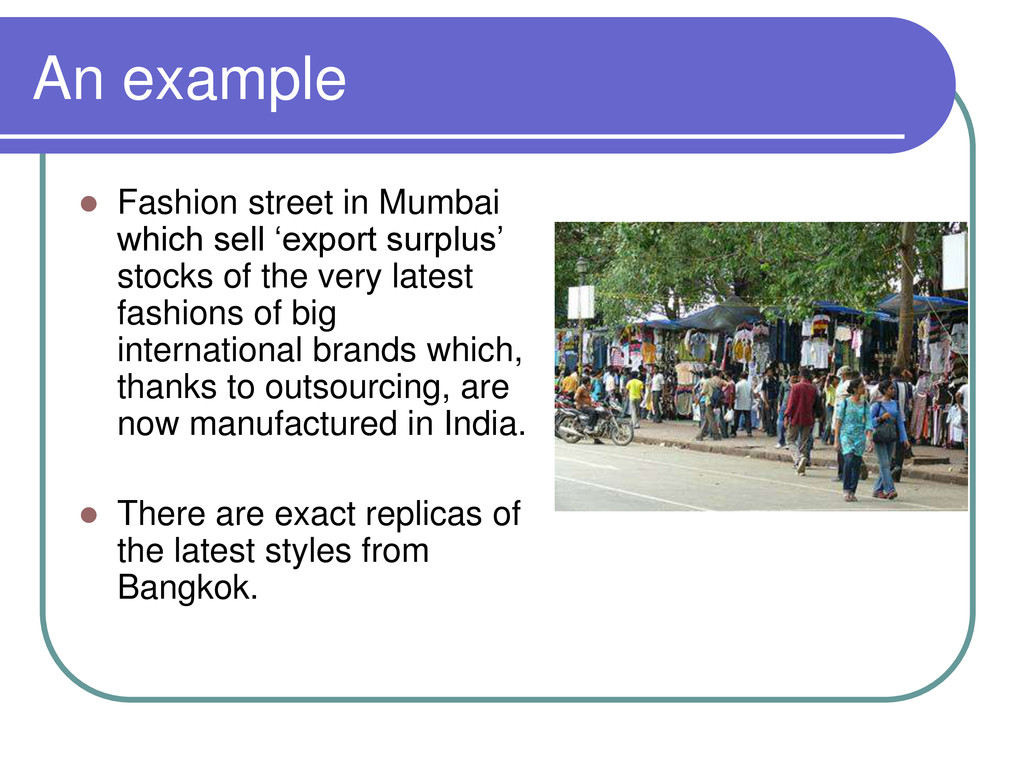
surplus’ stocks of the very latest fashions of big international brands which, thanks to outsourcing, are now manufactured in India. There are exact replicas of the latest styles from Bangkok.
new entity is to answer the ‘why buy me’ question with the right instigation. This is easy and difficult at the same time – Even though not a market with the ethos of modern consumerism – India has still been exposed to good business practices, effective distribution and well developed research and advertising practicess. While this means – that the audience had an experience of global benchmarks and makes it easy for you to raise the bar, they are also used to innovations which worked in the pre- 1991 repressed market economy and are therefore difficult to please.
The picture at the time of liberalization was of a deeply inhibitive regulatory framework that suppressed all forms of consumption and product innovation, but within which, paradoxically, a sophisticated sales and marketing system existed and operated, doing its best to innovate, develop and tease out whatever consumption it could from the market. The same market dilemma still exists.
Consumer India is like an experienced hire in an organization. An experienced hire is more difficult to manage and mould, because he already has a set way of doing things that work pretty well and therefore needs a lot of convincing to adopt to a new way of doing things.
like what American consumers were twenty years ago – is deeply flawed. Consumers exist in real time and are confronted by all the forces of today, and not yesterday.
of cola drinking as many other emerging markets have. To begin with Water holds a pre-eminent place in Indian food and drink. Water is loaded with cultural meanings and is considered the elixir of life. Offering water to a stranger in the middle of summer is the epitome of hospitality and kindness Further There is already a well developed ‘in-home’ beverage market for tea and coffee. Added to this is the fact that American culture, of which cola is a prominent symbol, has not had the same influence in this region, unlike let’s say a Philippines.
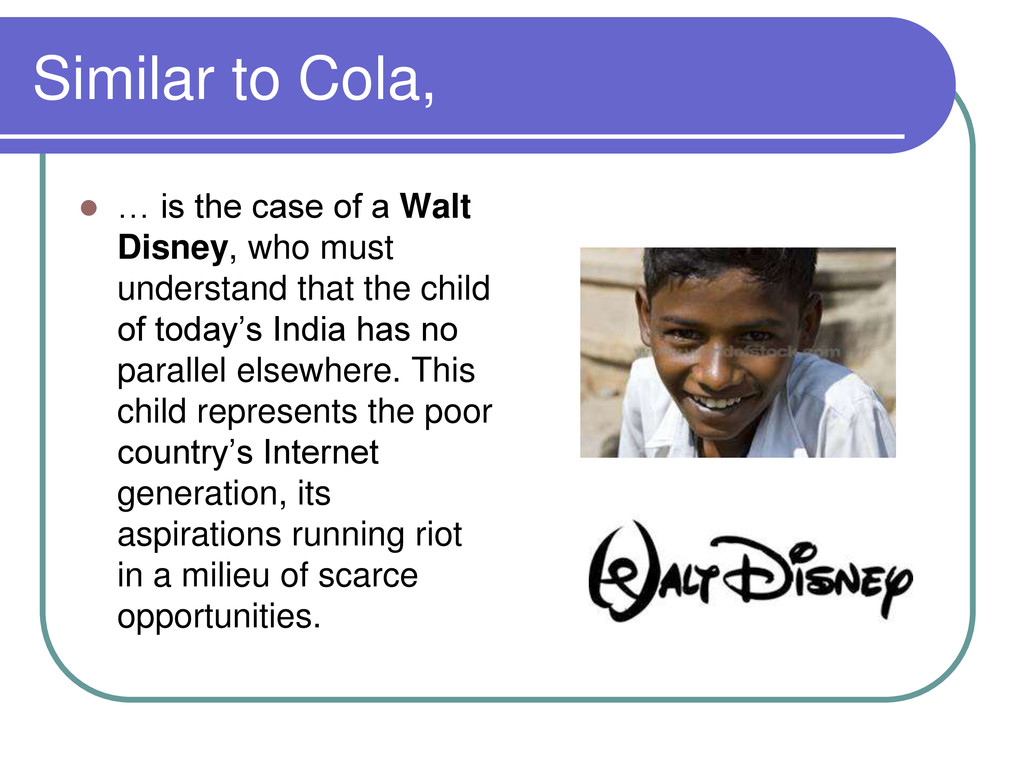
Walt Disney, who must understand that the child of today’s India has no parallel elsewhere. This child represents the poor country’s Internet generation, its aspirations running riot in a milieu of scarce opportunities.
– who will have to stop worrying about when PC penetration in India will hit the same levels as it did in developed markets – it will need to fight in an India revolutionized by feature rich cell phones, which are getting far more deeply entrenched than PCs in a much shorter span of time.
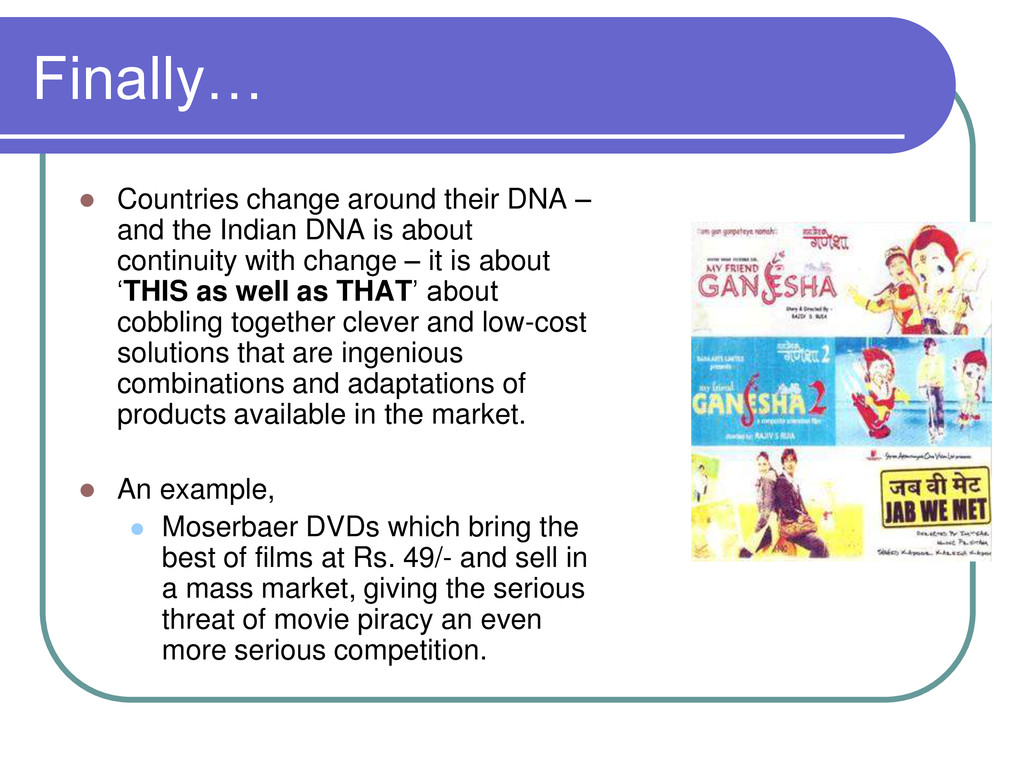
Indian DNA is about continuity with change – it is about ‘THIS as well as THAT’ about cobbling together clever and low-cost solutions that are ingenious combinations and adaptations of products available in the market. An example, Moserbaer DVDs which bring the best of films at Rs. 49/- and sell in a mass market, giving the serious threat of movie piracy an even more serious competition.
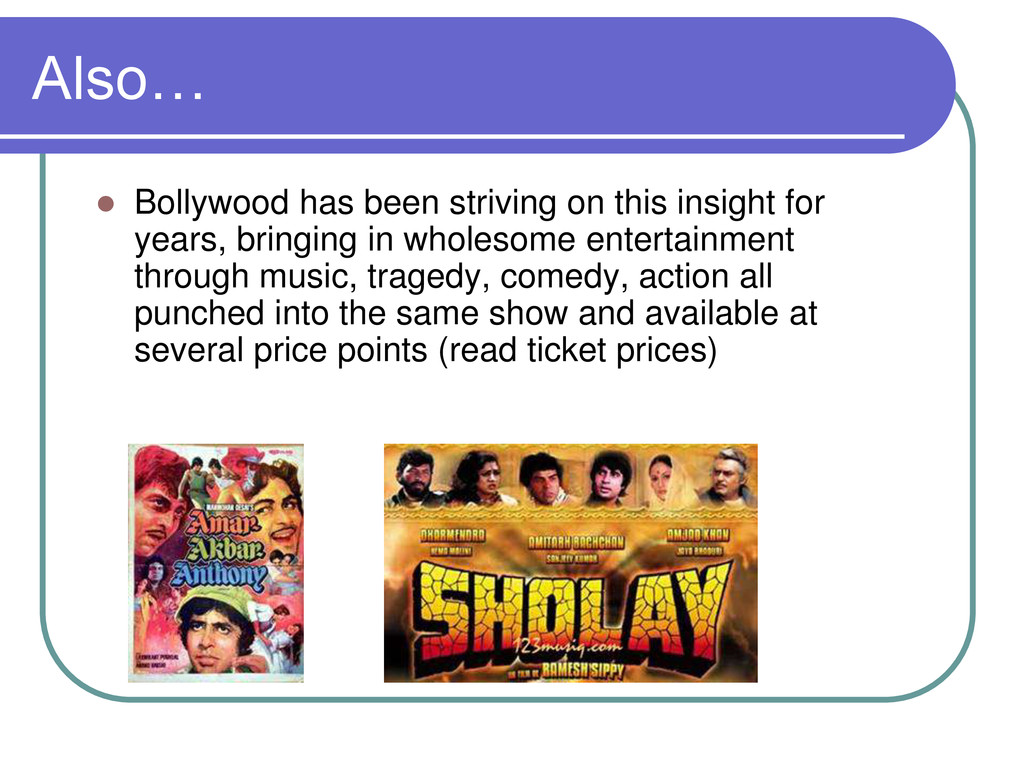
years, bringing in wholesome entertainment through music, tragedy, comedy, action all punched into the same show and available at several price points (read ticket prices)
need to rethink price-performance equations, the cost of market building and even business definition and business models. The Indian experience so far makes it obvious that only those companies that leverage their competencies to create tailor made businesses for India are likely to win in India.
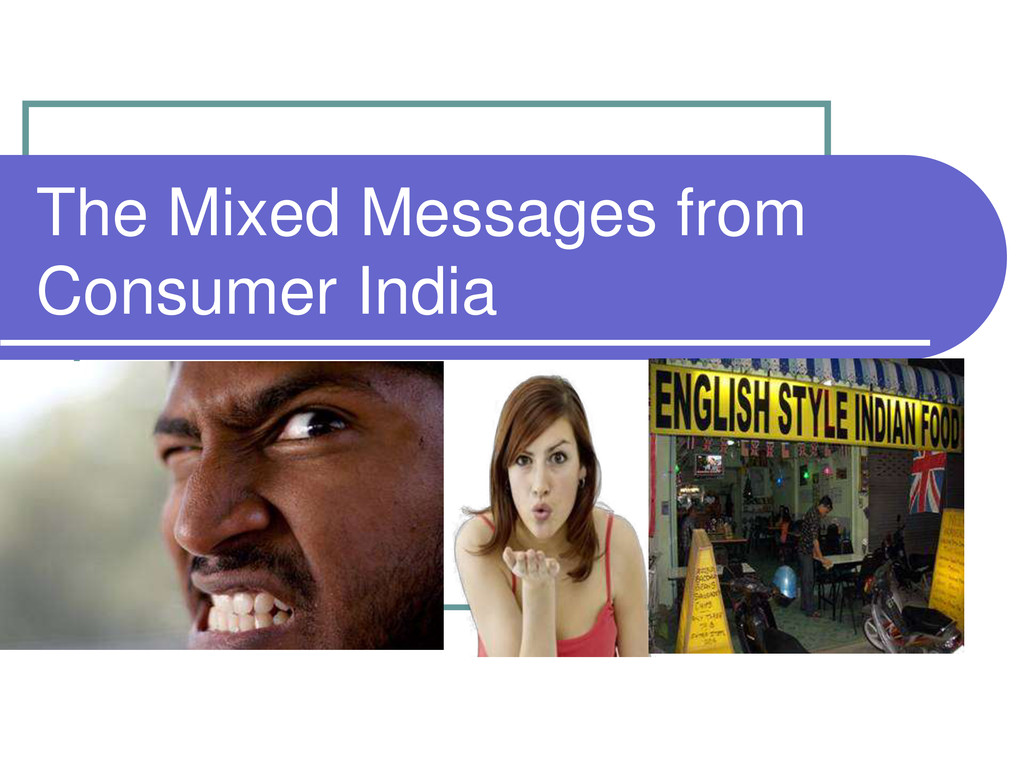
it is against this backdrop that businesses need to answer two critical questions Just how much of business interest does this market hold? Is India a ‘nice to have’ in the portfolio, or a ‘must have’ What kind of strategy does it really deserve?
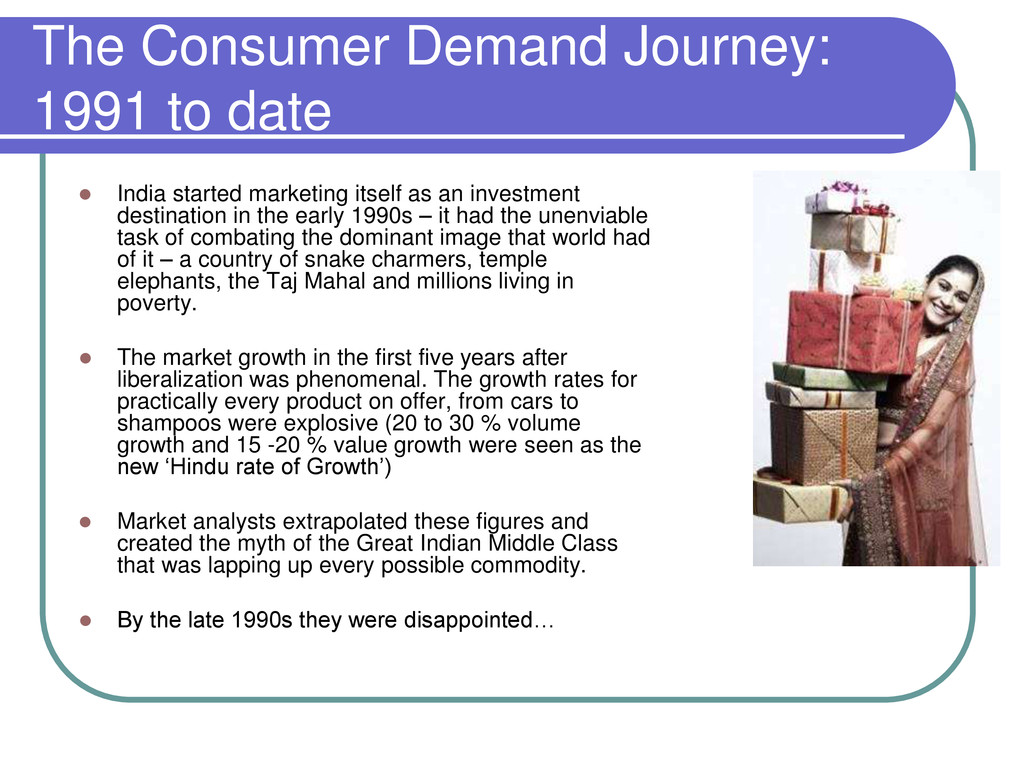
marketing itself as an investment destination in the early 1990s – it had the unenviable task of combating the dominant image that world had of it – a country of snake charmers, temple elephants, the Taj Mahal and millions living in poverty. The market growth in the first five years after liberalization was phenomenal. The growth rates for practically every product on offer, from cars to shampoos were explosive (20 to 30 % volume growth and 15 -20 % value growth were seen as the new ‘Hindu rate of Growth’) Market analysts extrapolated these figures and created the myth of the Great Indian Middle Class that was lapping up every possible commodity. By the late 1990s they were disappointed…
large capacity investments and grand business plans – the only problem was that this large consumption machine failed to materialize. the first among the new entrants who had set up shop went through a lot of turmoil On the first decade, Coca Cola ran up losses far exceeding its equity investment of USD 268 million, P&G reduced the number of stock keeping units, consulting firms like Booze Allen closed shop.
evolved in an economy where average per capita incomes have increased more than 5 times since 1991 and more than doubled in the eight years from 1997 to 2005. It therefore is a market that is very high on consumer aspiration and confidence which is about believing that its all right to spend and make merry today because tomorrow will definitely be even better.
is often said that Indian cricket team is an expert at snatching defeat from the jaws of victory. The same is true for the Indian market – it is a win-some, lose-some story. i.e if you survive the first short run, you will flourish in the long run. There is no easy way out – it’s zigzag street all along.
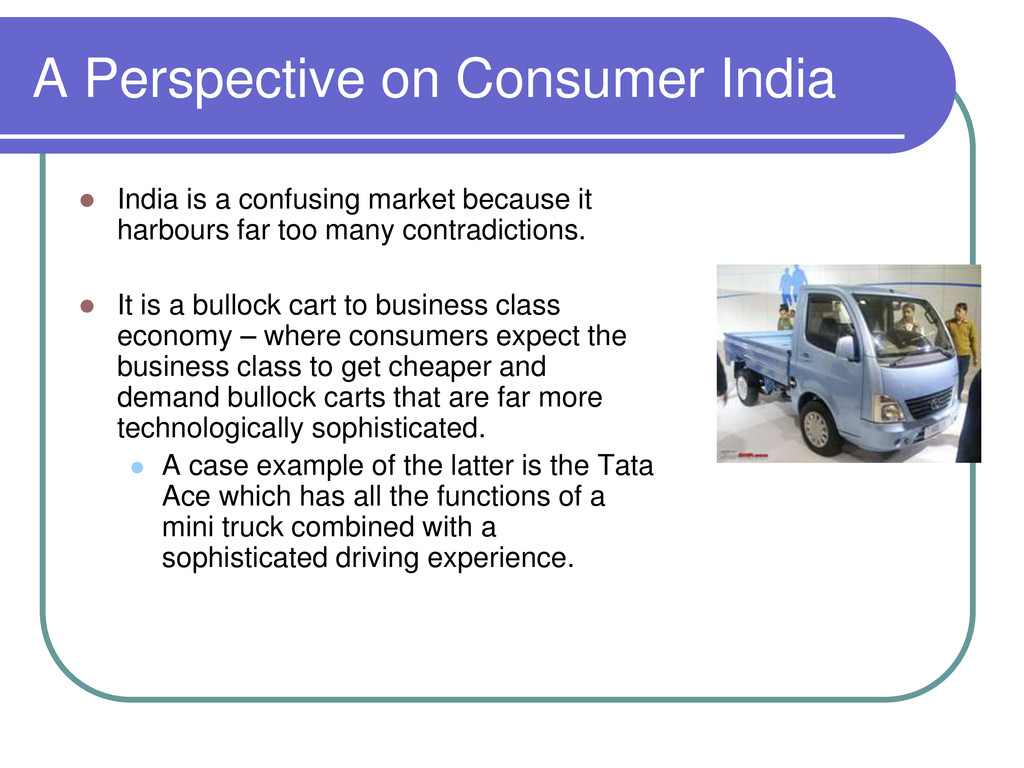
market because it harbours far too many contradictions. It is a bullock cart to business class economy – where consumers expect the business class to get cheaper and demand bullock carts that are far more technologically sophisticated. A case example of the latter is the Tata Ace which has all the functions of a mini truck combined with a sophisticated driving experience.
cannot build roads that will survive the first monsoon. It has eradicated smallpox but cannot stop female foeticide and infanticide. It is the IT powerhouse of the world and has changed business paradigms of the developed world, but regrettably is also a place of a yawning digital divide.
providers excel in designing their offers for this strange amalgam. An example: The institution of arranged marriage starts with a ‘girl viewing’ ceremony – where the boy’s family judges the girl on several parameters to close the marriage. A marriage broker decided that the cost and the embarrassment of doing all this was too much – especially for the middle class. So he created a business where he would videotape a mock ‘viewing ceremony’ and show it to all prospective ‘groom families’ – thereby tapping more customers and ensuring that he could close the deal in a very short time. Consumer India is in need of such interesting solutions – where you define your own India and create your plan accordingly in tapping it.
strategists bark up the wrong tree while setting out to evaluate the India opportunity by asking – ‘when will India have the per capita income and infrastructure of China, the westernization and per capita consumption of Brazil, the education levels of Russia and the maturity of US?’ The answer is not in the near future. But, it will still have a lot to offer with each passing year.
Over one billion people and still growing at 1.6 percent annually. India adds to itself a population equivalent to that of Australia each year. It will comprise 18% of the world’s population by the year 2030. In terms of sheer numbers, the center of gravity is towards where the consumers are. It is mostly poor but is getting less poor A marked increase in per capita income from a USD 120 in 1991 to USD 700 today. Between 1993 -4 to 2004-05, according to NSS, the % of people below the poverty line has dropped from 36% to 22%
getting richer Since 2001, the the average annual growth rate of high income households has been double that of any other income group. The top 10 percent of the India’s population has per capita income levels that are the same as 60% of those in Malayasia and 80% of those in Brazil. A clear number trick, where even a small percentage of a very large population is a large number of people. And these 100 million people are, by themselves, equivalent to the total population of Canada, 5 times that of Australia and a little less than double that of France. This is where the large chunk of the marketer’s fish are.
two totally distinct age groups that coexist in sizeable numbers but whose consumption ideologies are totally different. One is the isolated, post independence generation brought up in and conditioned by the Nehruvian socialistic milieu. The other is the free market, globally integrated post –liberalization generation. And as different parts of India get exposed to different economic, social, political and global forces to different degree the schizophrenia is getting worse, not better.
It is a large economy and has a large consumer base growing steadily at a modest and sustainable pace. It has the proven environment for guaranteed to happen growth A sustained GDP growth rate of 6 to 6.2 percent per annum. Young people, virgin market Consumer India offers a guaranteed growth source of 400 million people below the age of 21 and over 20 million new babies each year. Also, as income increases steadily, each year there are more and more new consumers just entering consumption, resulting in significant market expansion.
addition to interesting demographics, India is a story of inclusive growth that is stable both politically and socially. Strong institutions Another key aspect that makes a country an attractive investment destination is the presence of strong institutions. India’s separation between the legislation and judiciary, tough election commission and the glare of an independent free press enable a variety of voices of viewpoints to be widely heard. It is a country, where the person living below the poverty line can make or break a government at will.
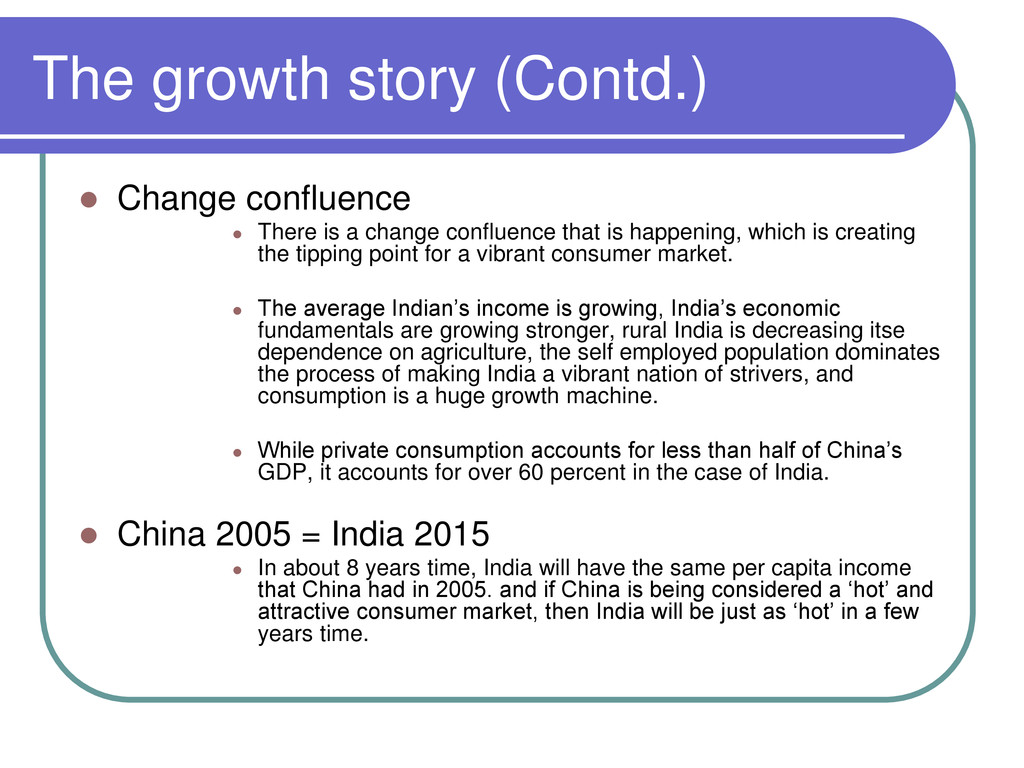
a change confluence that is happening, which is creating the tipping point for a vibrant consumer market. The average Indian’s income is growing, India’s economic fundamentals are growing stronger, rural India is decreasing itse dependence on agriculture, the self employed population dominates the process of making India a vibrant nation of strivers, and consumption is a huge growth machine. While private consumption accounts for less than half of China’s GDP, it accounts for over 60 percent in the case of India. China 2005 = India 2015 In about 8 years time, India will have the same per capita income that China had in 2005. and if China is being considered a ‘hot’ and attractive consumer market, then India will be just as ‘hot’ in a few years time.
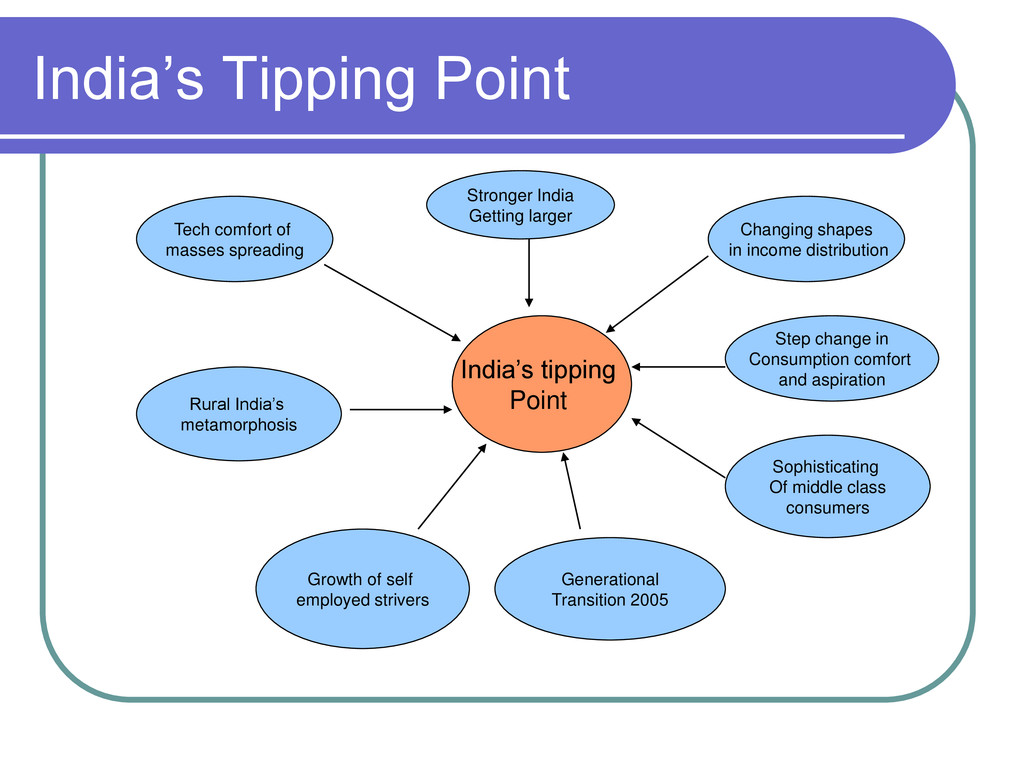
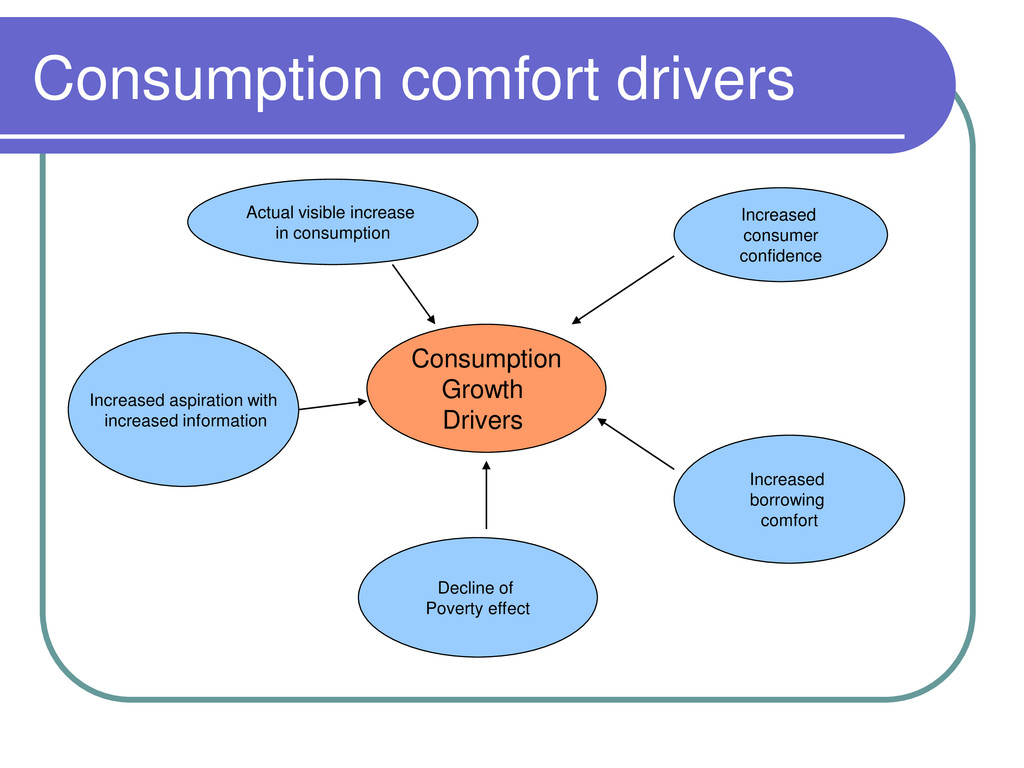
distribution Growth of self employed strivers Generational Transition 2005 Sophisticating Of middle class consumers Step change in Consumption comfort and aspiration Tech comfort of masses spreading Stronger India Getting larger Rural India’s metamorphosis
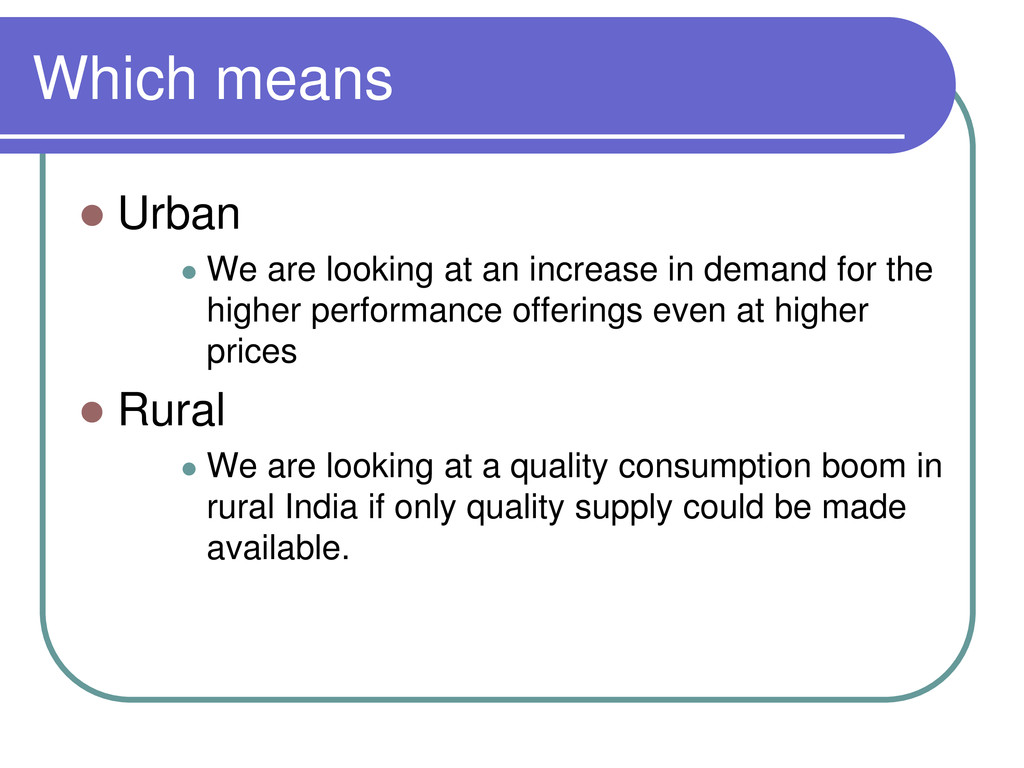
increase in demand for the higher performance offerings even at higher prices Rural We are looking at a quality consumption boom in rural India if only quality supply could be made available.
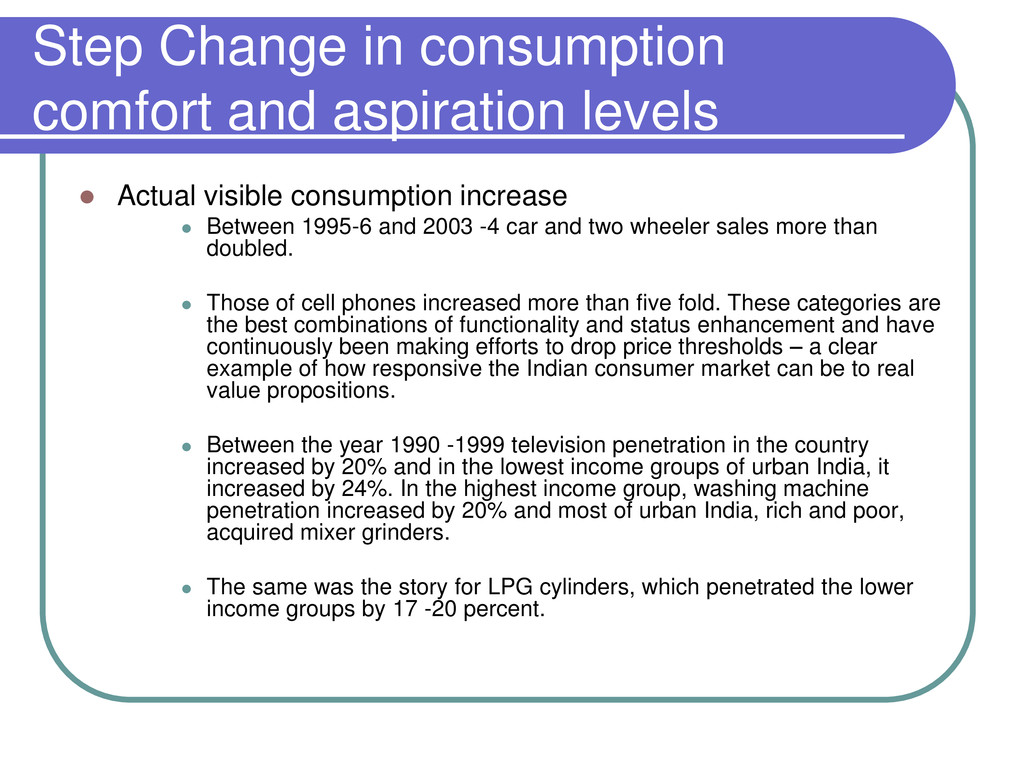
visible consumption increase Between 1995-6 and 2003 -4 car and two wheeler sales more than doubled. Those of cell phones increased more than five fold. These categories are the best combinations of functionality and status enhancement and have continuously been making efforts to drop price thresholds – a clear example of how responsive the Indian consumer market can be to real value propositions. Between the year 1990 -1999 television penetration in the country increased by 20% and in the lowest income groups of urban India, it increased by 24%. In the highest income group, washing machine penetration increased by 20% and most of urban India, rich and poor, acquired mixer grinders. The same was the story for LPG cylinders, which penetrated the lower income groups by 17 -20 percent.
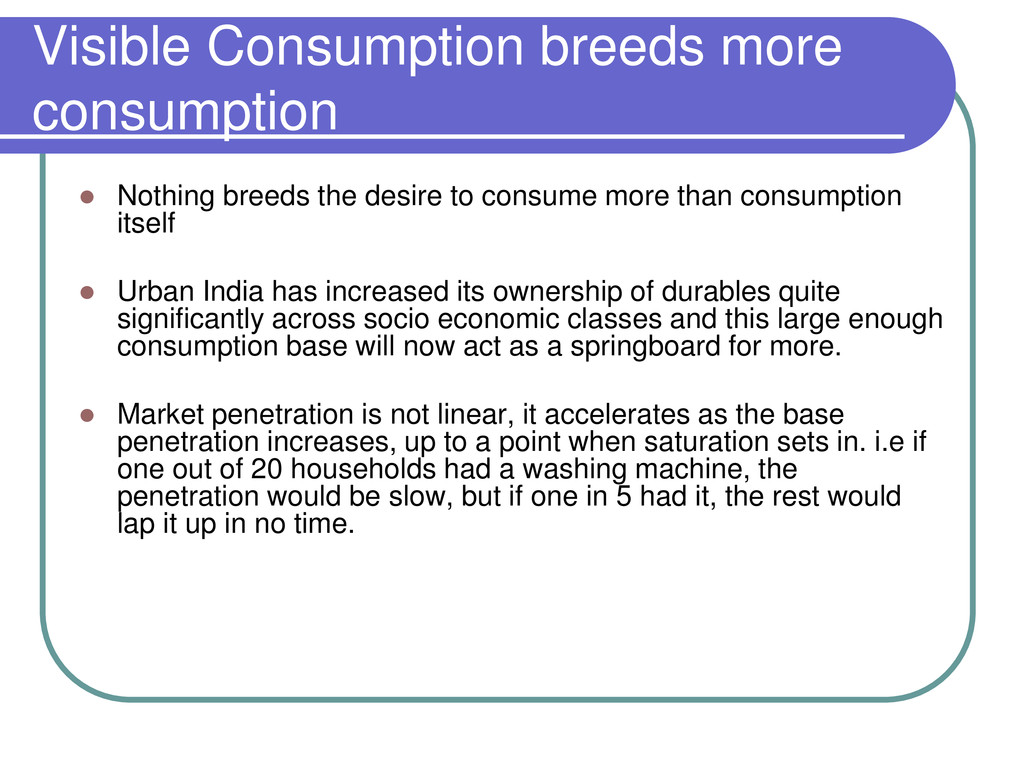
to consume more than consumption itself Urban India has increased its ownership of durables quite significantly across socio economic classes and this large enough consumption base will now act as a springboard for more. Market penetration is not linear, it accelerates as the base penetration increases, up to a point when saturation sets in. i.e if one out of 20 households had a washing machine, the penetration would be slow, but if one in 5 had it, the rest would lap it up in no time.
about the belief a person has that tomorrow will be better than today. The biggest social implication of income growth has been the rapid change in the standard of living in just under one generation. Typically, as people will tell you, ‘in the old days, I could only hope to start my life at half the lifestyle that my father enjoyed when he retired, Now I start my life at a point above where he ended’.
fuelled because affordability growth has been greater than income growth in the past decade. The prices of many consumer goods have fallen both in real terms and in nominal terms, and the average price performance points are unlikely to rise disproportionately beyond the income growth.
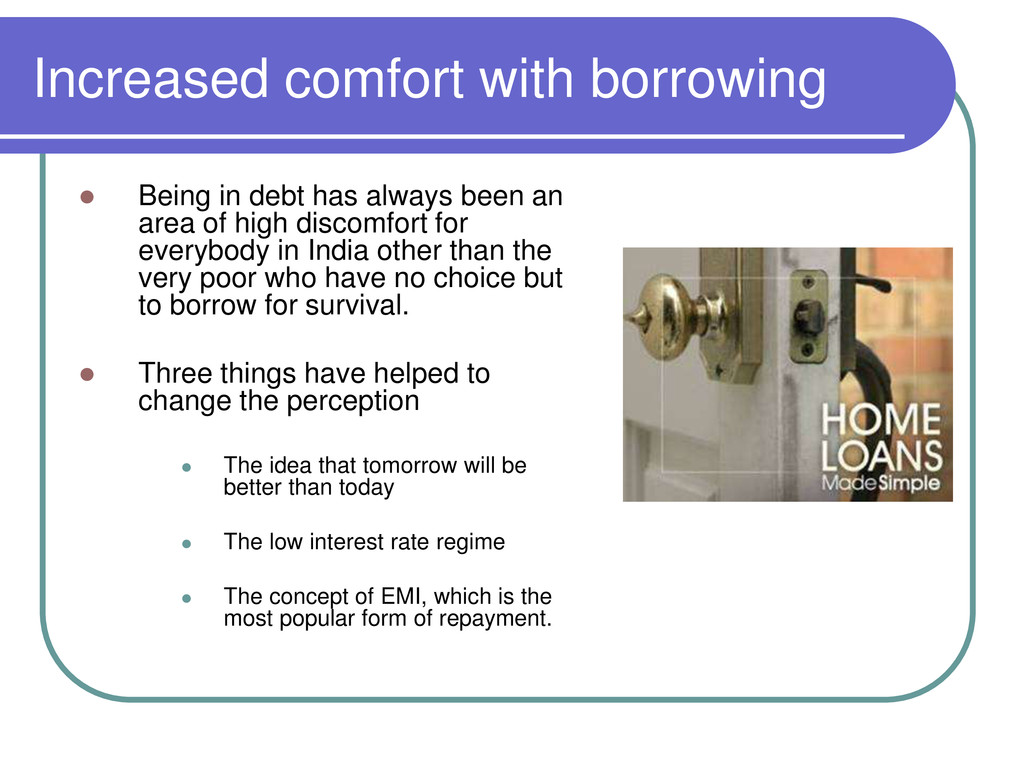
been an area of high discomfort for everybody in India other than the very poor who have no choice but to borrow for survival. Three things have helped to change the perception The idea that tomorrow will be better than today The low interest rate regime The concept of EMI, which is the most popular form of repayment.
leap that Indian has gone through in the last decade has been a major driver of aspiration. Consumer India now has enough access and exposure to informal resources and media to concretely imagine or visualize a better life.
‘rubbish at low prices’ has changed – as the middle class consumer has become more sophisticated and discerning and have selected peak performance at popular price points. The increase of budget hotels, budget airlines, budget apparel brands, prepaid cards for budget cell phones, low price basic handsets, budget retail formats that are hybrid superstores, and high end banking facilities for mid level customers have taken up by storm.
the ushering in of the non- socialistic consumption friendly ideology. Children born around 1990 will be entering the workforce shortly – indeed six out of ten households have a liberalisation child. There are 100 million seventeen to twenty one year olds who are ready to start their consumption journey. Most importantly, these youngsters are now reasonably confident about their future.
for less than 10 percent of the jobs in the country, while the informal sector actually drives employment. Since most of consumer India wants to get ahead in a hurry, being self employed is the means by which they can earn and construct a better life for themselves. It is the attitude of ‘I can and I will’ that reigns supreme. What’s more, today 90% of rural households and 60% of urban households are headed by a self employed person. In the highest income group of urban India, the proportion of self employed is the lowest at about 45%, while in the lowest income group it rises to almost 80%.
years, has been dependent on agriculture. Further, in economic terms, agriculture has not been a great proposition for a variety of reasons and has grown at just 1.9% over the last decade. However, rural India has now gone beyond its dependence on agriculture in order to augment incomes from non-agricultural activities. Now-days, non-agricultural activity in the rural areas is almost equal to the agricultural activity and accounts for a little less than half of the rural GDP. NCAER occupation data shows a decline in cultivators, and there is enough evidence of dual sector households.
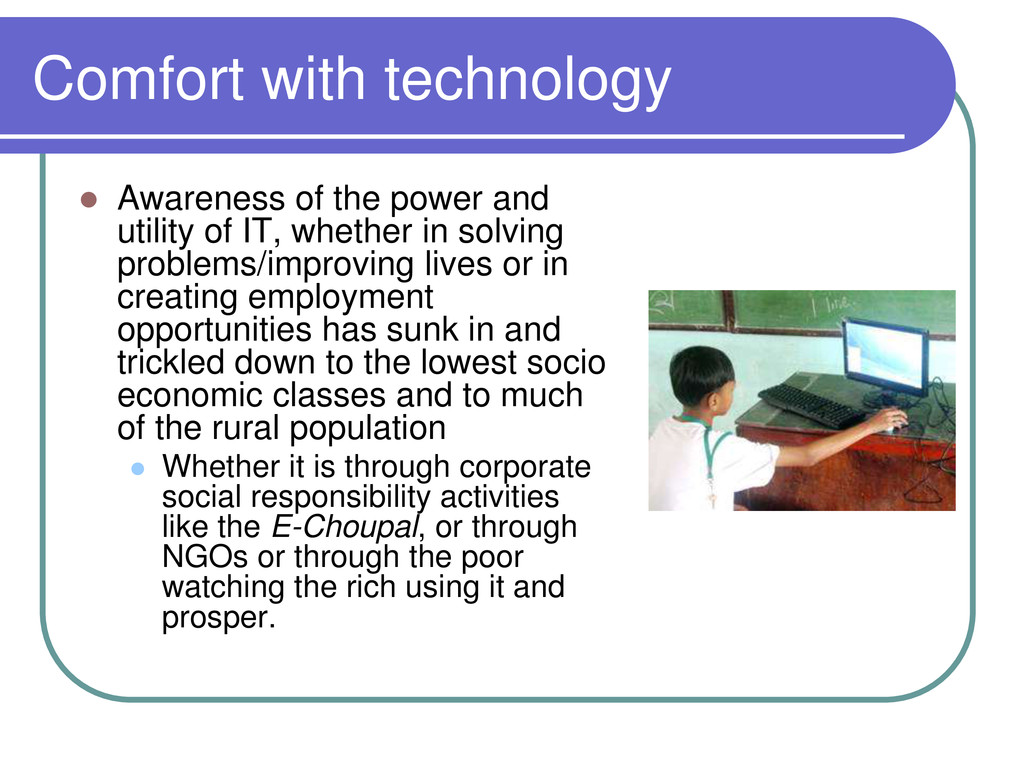
of IT, whether in solving problems/improving lives or in creating employment opportunities has sunk in and trickled down to the lowest socio economic classes and to much of the rural population Whether it is through corporate social responsibility activities like the E-Choupal, or through NGOs or through the poor watching the rich using it and prosper.
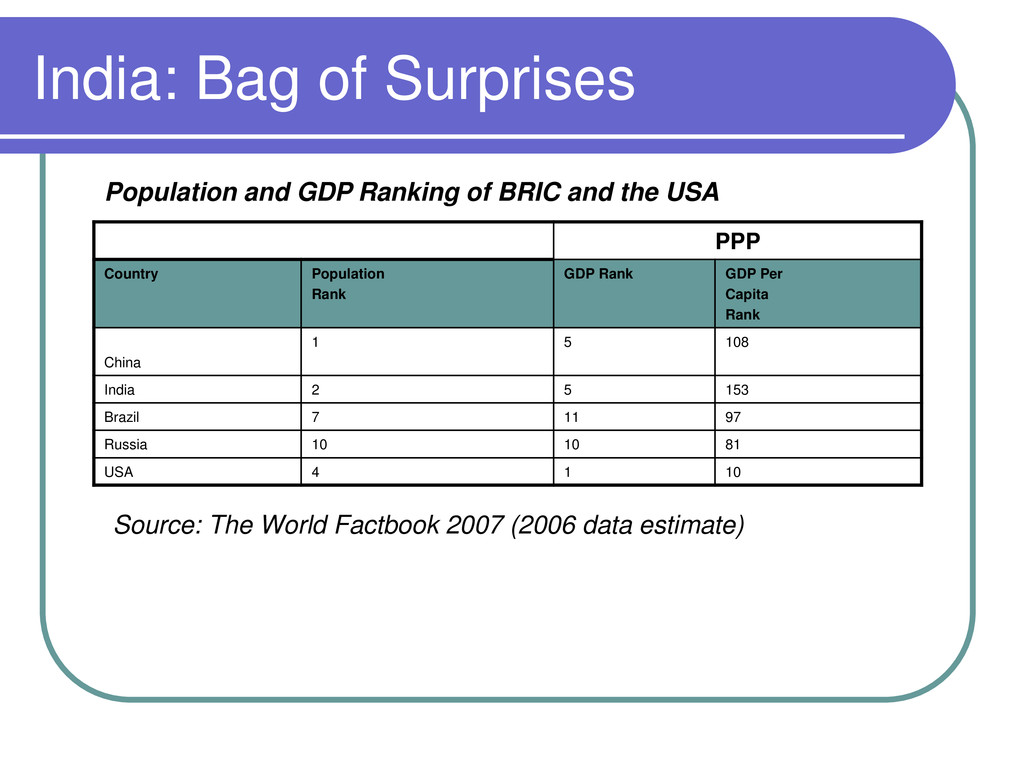
GDP Per Capita Rank China 1 5 108 India 2 5 153 Brazil 7 11 97 Russia 10 10 81 USA 4 1 10 Population and GDP Ranking of BRIC and the USA Source: The World Factbook 2007 (2006 data estimate)
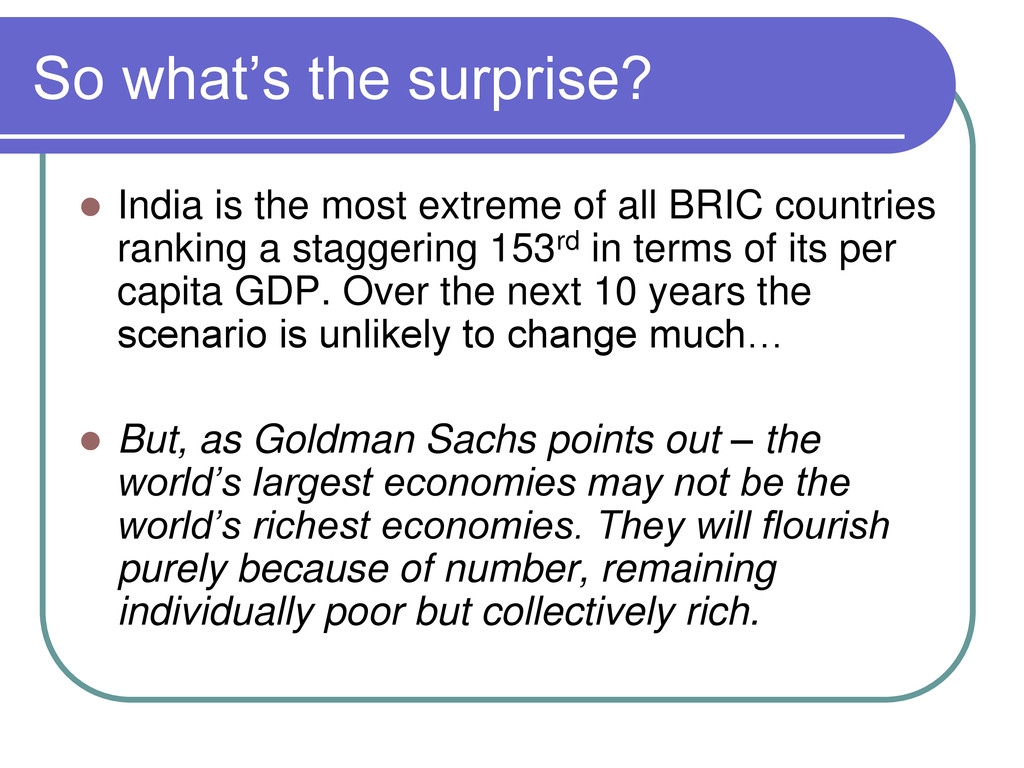
of all BRIC countries ranking a staggering 153rd in terms of its per capita GDP. Over the next 10 years the scenario is unlikely to change much… But, as Goldman Sachs points out – the world’s largest economies may not be the world’s richest economies. They will flourish purely because of number, remaining individually poor but collectively rich.
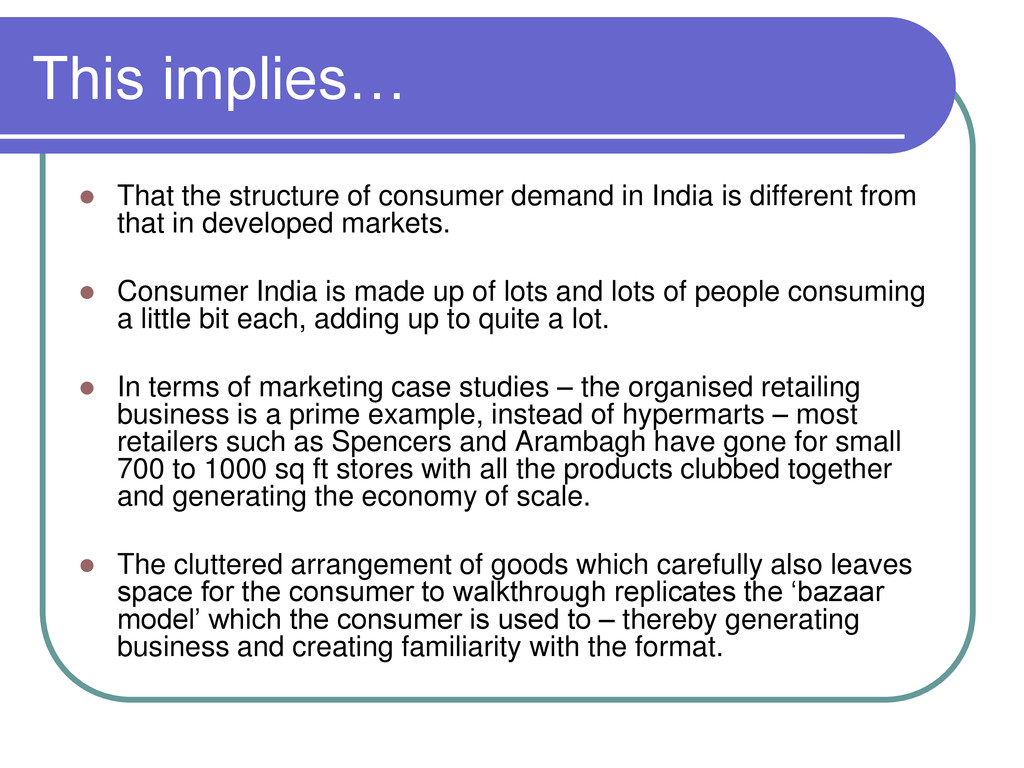
India is different from that in developed markets. Consumer India is made up of lots and lots of people consuming a little bit each, adding up to quite a lot. In terms of marketing case studies – the organised retailing business is a prime example, instead of hypermarts – most retailers such as Spencers and Arambagh have gone for small 700 to 1000 sq ft stores with all the products clubbed together and generating the economy of scale. The cluttered arrangement of goods which carefully also leaves space for the consumer to walkthrough replicates the ‘bazaar model’ which the consumer is used to – thereby generating business and creating familiarity with the format.
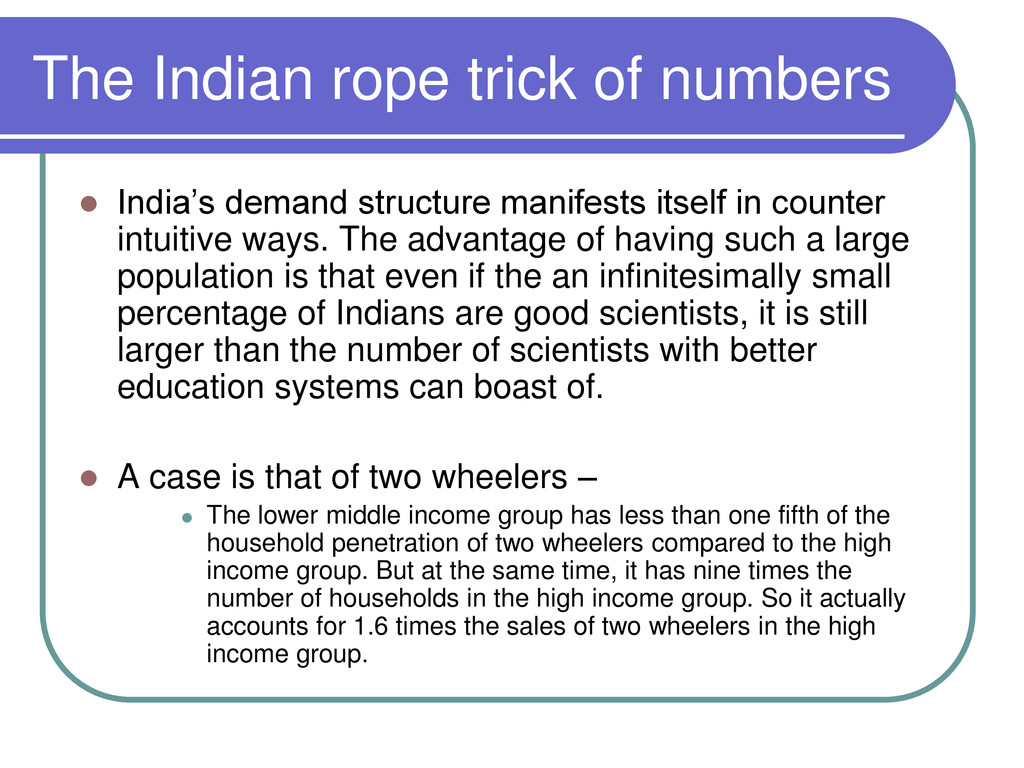
manifests itself in counter intuitive ways. The advantage of having such a large population is that even if the an infinitesimally small percentage of Indians are good scientists, it is still larger than the number of scientists with better education systems can boast of. A case is that of two wheelers – The lower middle income group has less than one fifth of the household penetration of two wheelers compared to the high income group. But at the same time, it has nine times the number of households in the high income group. So it actually accounts for 1.6 times the sales of two wheelers in the high income group.
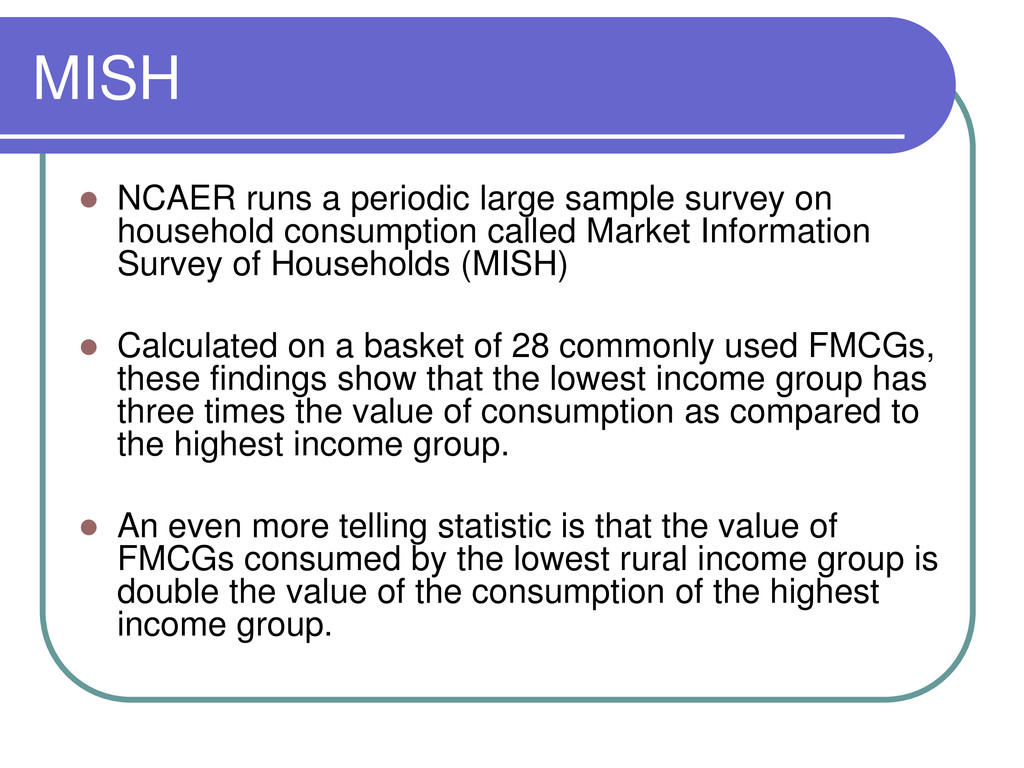
household consumption called Market Information Survey of Households (MISH) Calculated on a basket of 28 commonly used FMCGs, these findings show that the lowest income group has three times the value of consumption as compared to the highest income group. An even more telling statistic is that the value of FMCGs consumed by the lowest rural income group is double the value of the consumption of the highest income group.
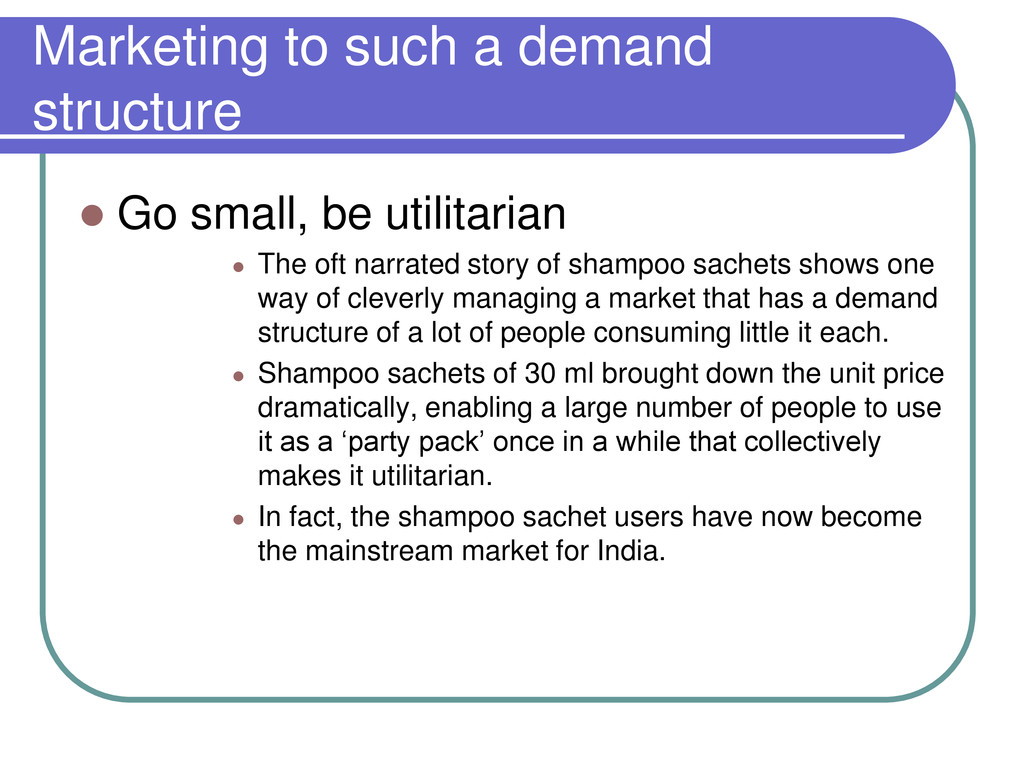
utilitarian The oft narrated story of shampoo sachets shows one way of cleverly managing a market that has a demand structure of a lot of people consuming little it each. Shampoo sachets of 30 ml brought down the unit price dramatically, enabling a large number of people to use it as a ‘party pack’ once in a while that collectively makes it utilitarian. In fact, the shampoo sachet users have now become the mainstream market for India.
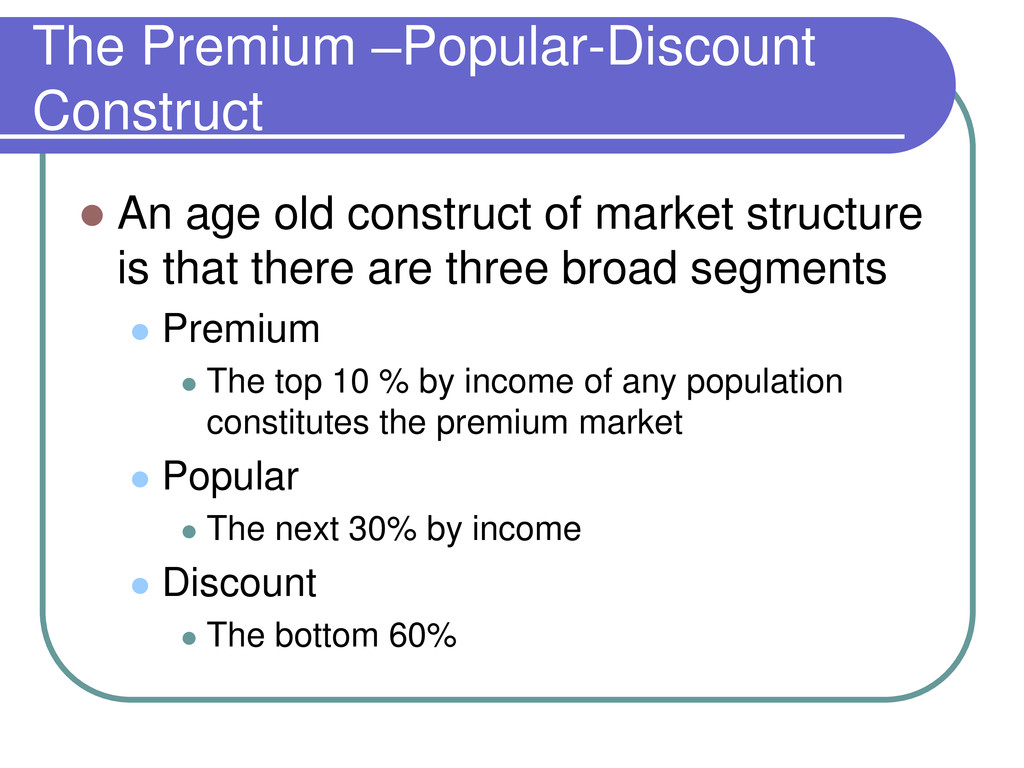
market structure is that there are three broad segments Premium The top 10 % by income of any population constitutes the premium market Popular The next 30% by income Discount The bottom 60%
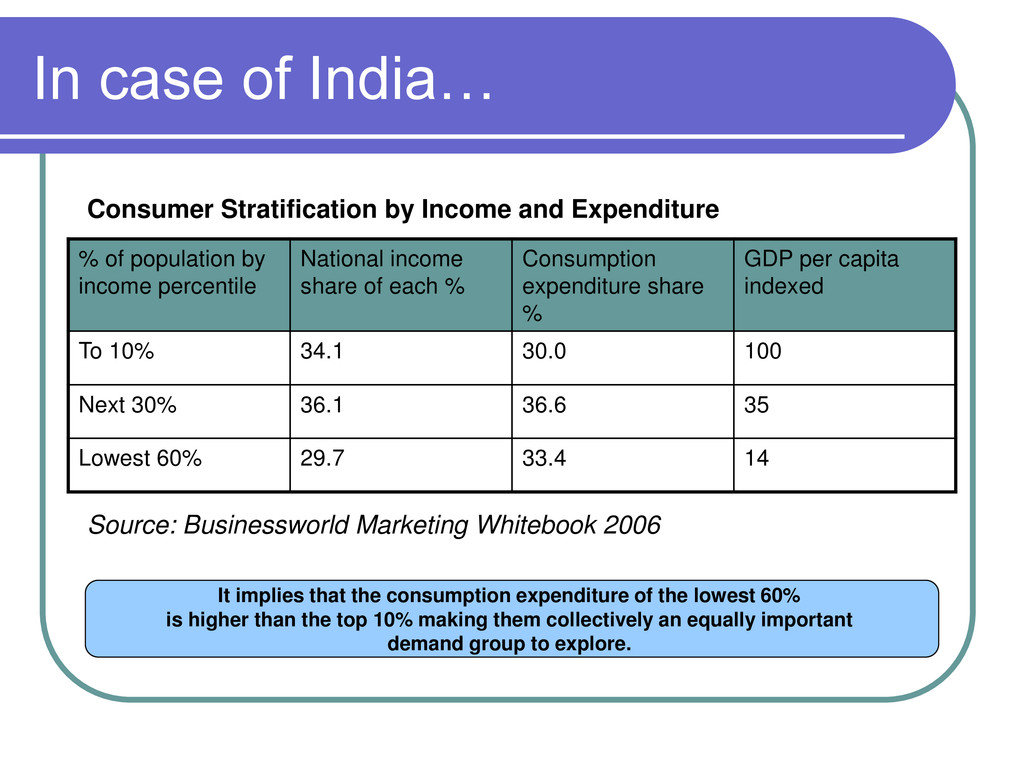
National income share of each % Consumption expenditure share % GDP per capita indexed To 10% 34.1 30.0 100 Next 30% 36.1 36.6 35 Lowest 60% 29.7 33.4 14 Consumer Stratification by Income and Expenditure Source: Businessworld Marketing Whitebook 2006 It implies that the consumption expenditure of the lowest 60% is higher than the top 10% making them collectively an equally important demand group to explore.
stretched to no end With the emergence of rogue marketers who offer high performance at budget prices, the market is in for a never before turmoil. The consumer is becoming more and more difficult to define – because the same consumer who goes for a high end shampoo may settle for a popular category soap which is high on lather, perfume and fat content. The consumers are now defining their own product constellations – which makes the journey for marketers a tricky one.
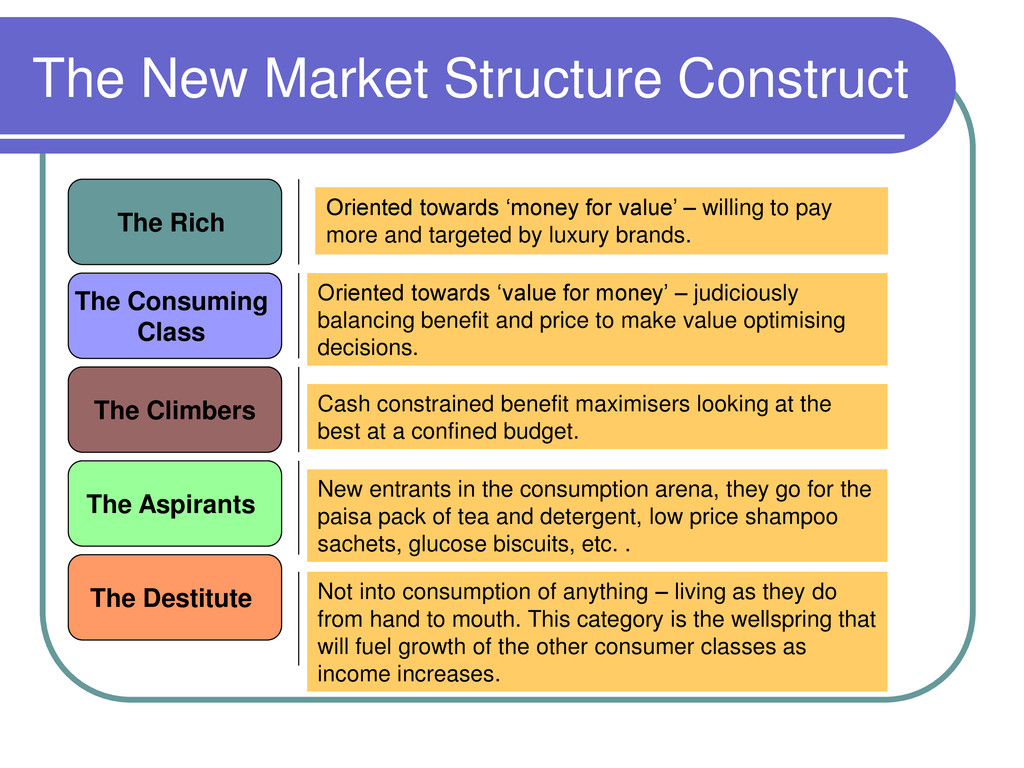
The Climbers The Aspirants The Destitute Oriented towards ‘money for value’ – willing to pay more and targeted by luxury brands. Oriented towards ‘value for money’ – judiciously balancing benefit and price to make value optimising decisions. Cash constrained benefit maximisers looking at the best at a confined budget. New entrants in the consumption arena, they go for the paisa pack of tea and detergent, low price shampoo sachets, glucose biscuits, etc. . Not into consumption of anything – living as they do from hand to mouth. This category is the wellspring that will fuel growth of the other consumer classes as income increases.
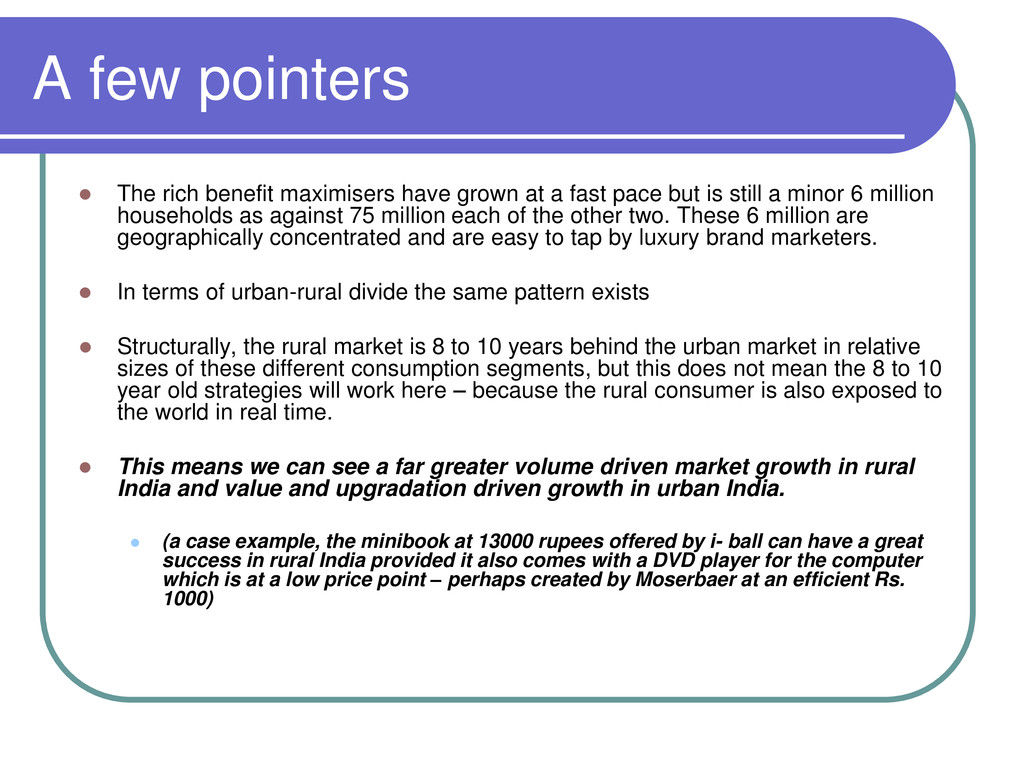
at a fast pace but is still a minor 6 million households as against 75 million each of the other two. These 6 million are geographically concentrated and are easy to tap by luxury brand marketers. In terms of urban-rural divide the same pattern exists Structurally, the rural market is 8 to 10 years behind the urban market in relative sizes of these different consumption segments, but this does not mean the 8 to 10 year old strategies will work here – because the rural consumer is also exposed to the world in real time. This means we can see a far greater volume driven market growth in rural India and value and upgradation driven growth in urban India. (a case example, the minibook at 13000 rupees offered by i- ball can have a great success in rural India provided it also comes with a DVD player for the computer which is at a low price point – perhaps created by Moserbaer at an efficient Rs. 1000)
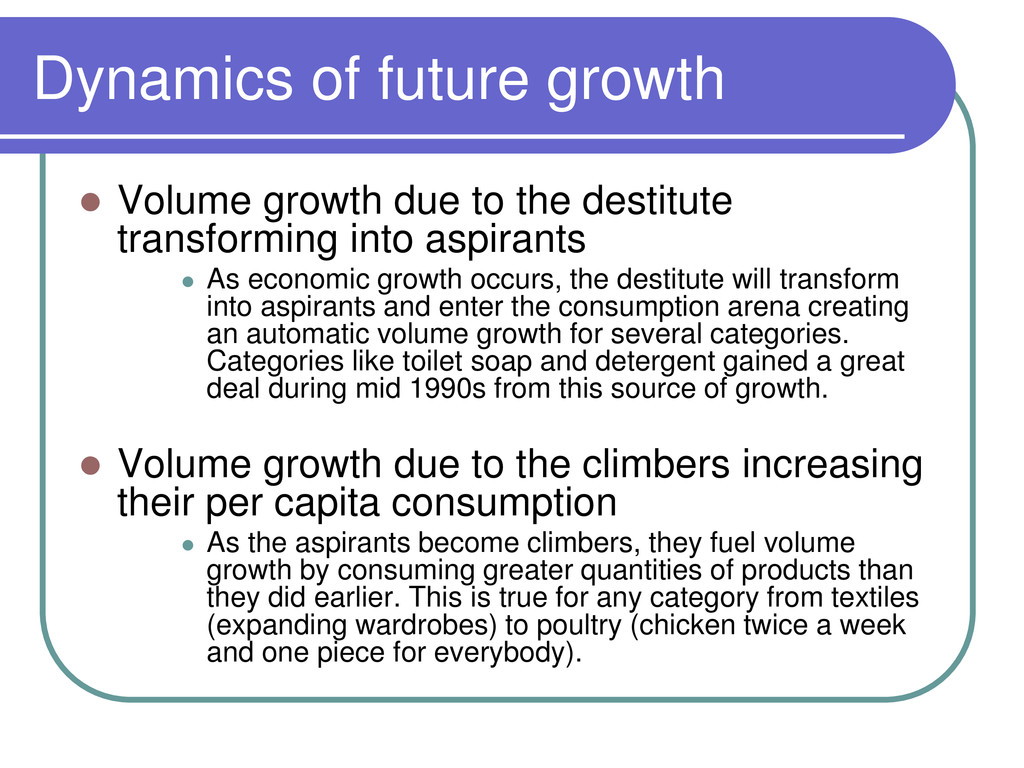
destitute transforming into aspirants As economic growth occurs, the destitute will transform into aspirants and enter the consumption arena creating an automatic volume growth for several categories. Categories like toilet soap and detergent gained a great deal during mid 1990s from this source of growth. Volume growth due to the climbers increasing their per capita consumption As the aspirants become climbers, they fuel volume growth by consuming greater quantities of products than they did earlier. This is true for any category from textiles (expanding wardrobes) to poultry (chicken twice a week and one piece for everybody).
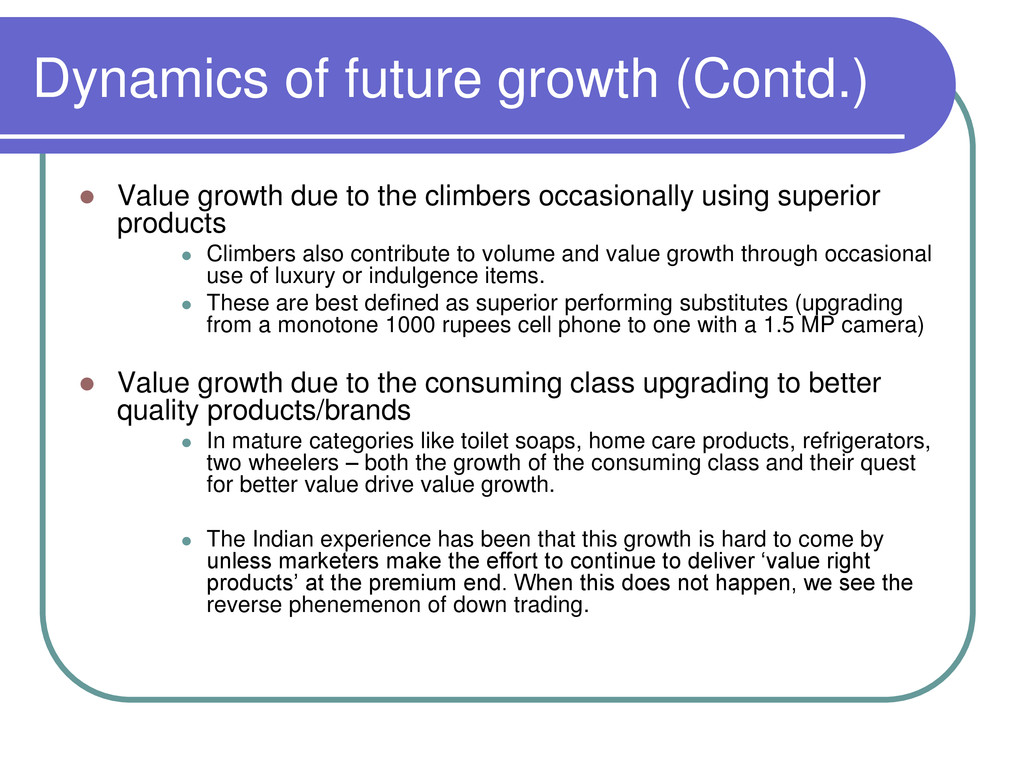
the climbers occasionally using superior products Climbers also contribute to volume and value growth through occasional use of luxury or indulgence items. These are best defined as superior performing substitutes (upgrading from a monotone 1000 rupees cell phone to one with a 1.5 MP camera) Value growth due to the consuming class upgrading to better quality products/brands In mature categories like toilet soaps, home care products, refrigerators, two wheelers – both the growth of the consuming class and their quest for better value drive value growth. The Indian experience has been that this growth is hard to come by unless marketers make the effort to continue to deliver ‘value right products’ at the premium end. When this does not happen, we see the reverse phenemenon of down trading.
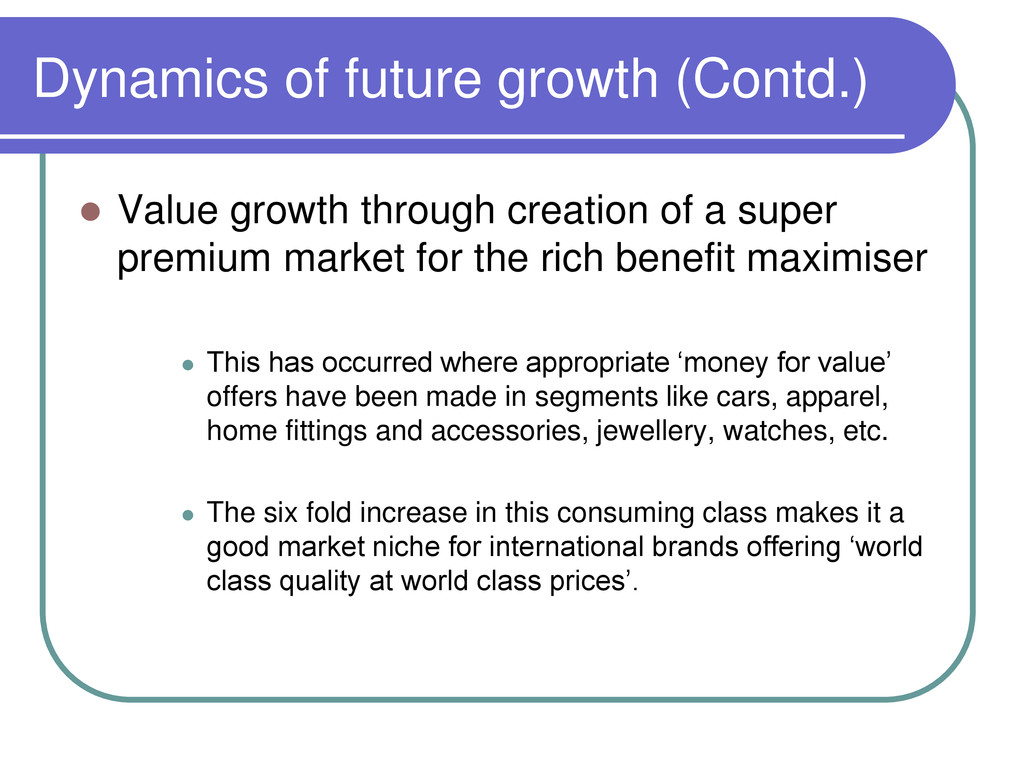
of a super premium market for the rich benefit maximiser This has occurred where appropriate ‘money for value’ offers have been made in segments like cars, apparel, home fittings and accessories, jewellery, watches, etc. The six fold increase in this consuming class makes it a good market niche for international brands offering ‘world class quality at world class prices’.
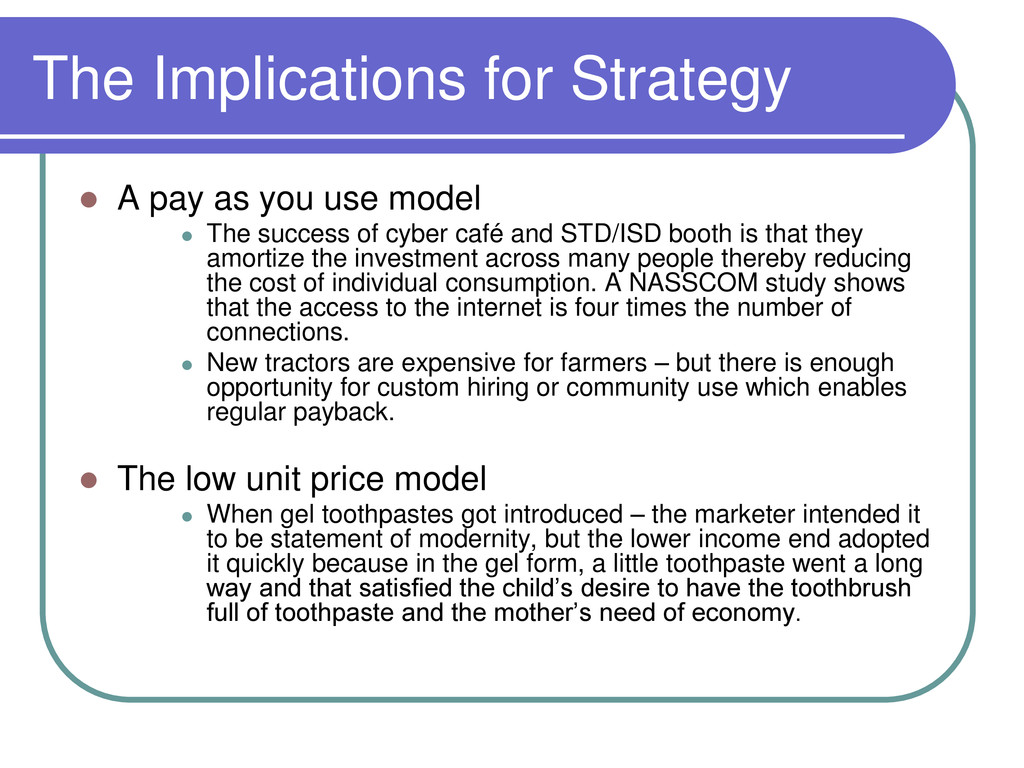
model The success of cyber café and STD/ISD booth is that they amortize the investment across many people thereby reducing the cost of individual consumption. A NASSCOM study shows that the access to the internet is four times the number of connections. New tractors are expensive for farmers – but there is enough opportunity for custom hiring or community use which enables regular payback. The low unit price model When gel toothpastes got introduced – the marketer intended it to be statement of modernity, but the lower income end adopted it quickly because in the gel form, a little toothpaste went a long way and that satisfied the child’s desire to have the toothbrush full of toothpaste and the mother’s need of economy.
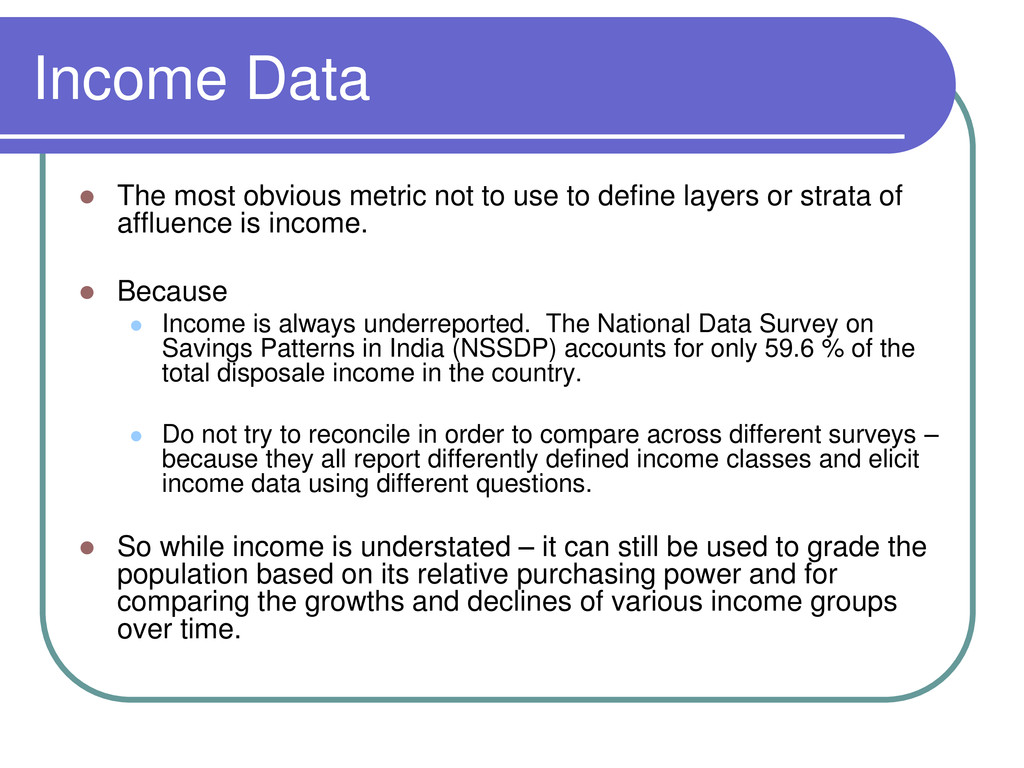
to define layers or strata of affluence is income. Because Income is always underreported. The National Data Survey on Savings Patterns in India (NSSDP) accounts for only 59.6 % of the total disposale income in the country. Do not try to reconcile in order to compare across different surveys – because they all report differently defined income classes and elicit income data using different questions. So while income is understated – it can still be used to grade the population based on its relative purchasing power and for comparing the growths and declines of various income groups over time.
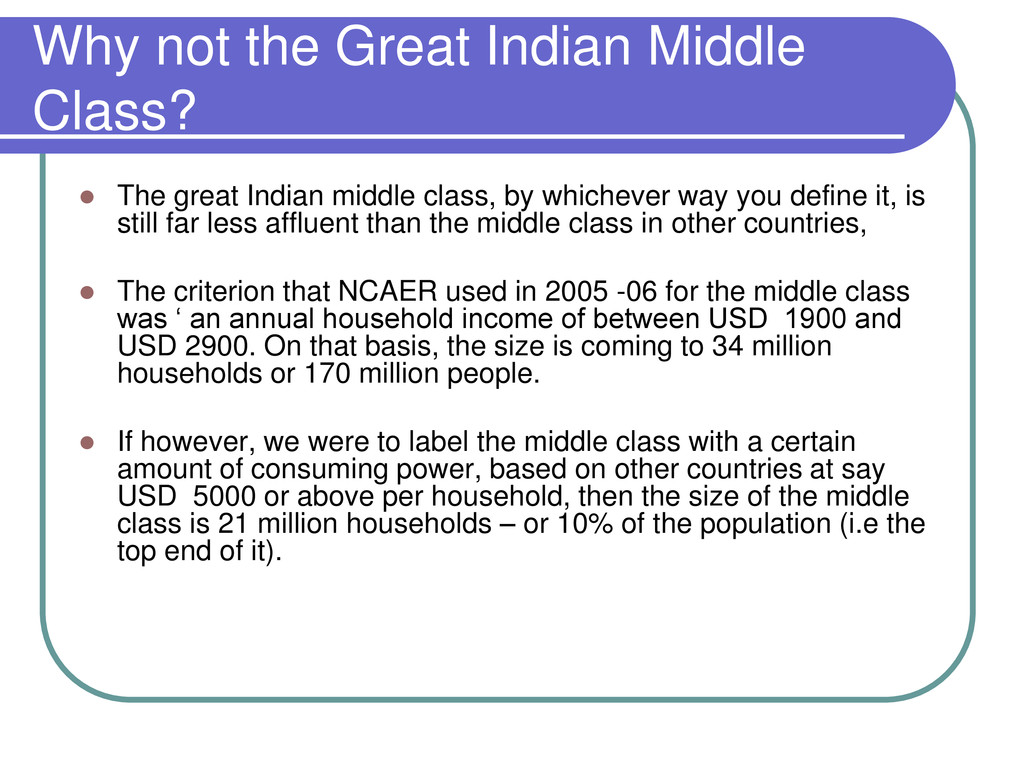
Indian middle class, by whichever way you define it, is still far less affluent than the middle class in other countries, The criterion that NCAER used in 2005 -06 for the middle class was ‘ an annual household income of between USD 1900 and USD 2900. On that basis, the size is coming to 34 million households or 170 million people. If however, we were to label the middle class with a certain amount of consuming power, based on other countries at say USD 5000 or above per household, then the size of the middle class is 21 million households – or 10% of the population (i.e the top end of it).
study of purchasing power of consumer India should replace the monolithic model of the middle class and instead concentrate on it as a multi layered cake with different levels of affluence in each layer.
and what affluence they actually harbour is to work with income percentiles. Further to get a concrete fix on the purchasing power that goes with stated income labels you need to study what people in each income label bracket actually consume.
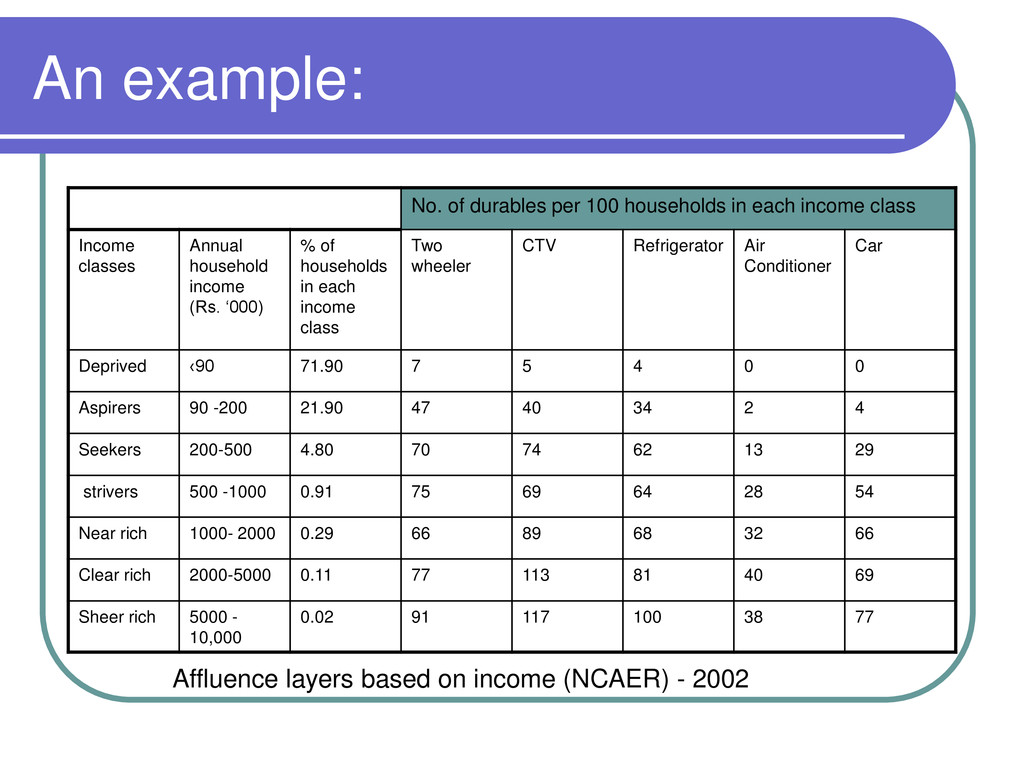
in number, have a stated income between Rs. 200000 to 500,000 per year. On this income 70% of them have basic durables like television and refrigerators and a little less than 1/3rd have entry level cars. On the other hand, the deprived which comprise 70% of the population, owns virtually none of these items that are considered basic necessities for consumers around the world. Let’s now look at a stratification scheme where affluence tiers are constructed based on income percentiles. Also, it needs to be seen in terms of rural urban divide.
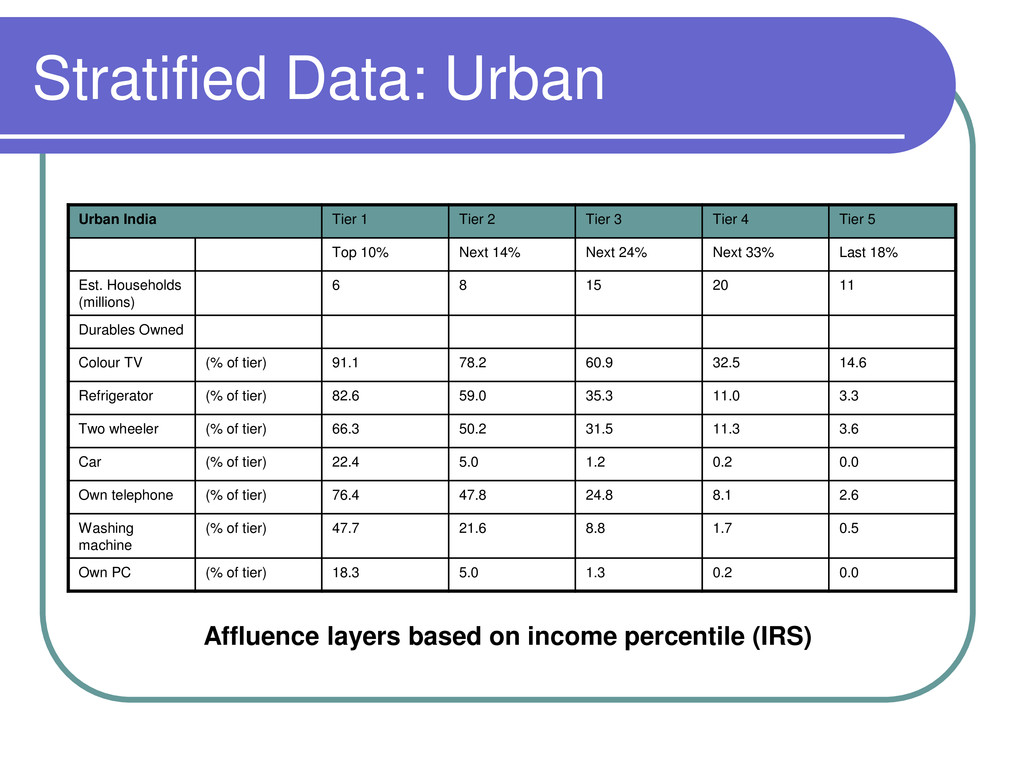
3 Tier 4 Tier 5 Top 10% Next 14% Next 24% Next 33% Last 18% Est. Households (millions) 6 8 15 20 11 Durables Owned Colour TV (% of tier) 91.1 78.2 60.9 32.5 14.6 Refrigerator (% of tier) 82.6 59.0 35.3 11.0 3.3 Two wheeler (% of tier) 66.3 50.2 31.5 11.3 3.6 Car (% of tier) 22.4 5.0 1.2 0.2 0.0 Own telephone (% of tier) 76.4 47.8 24.8 8.1 2.6 Washing machine (% of tier) 47.7 21.6 8.8 1.7 0.5 Own PC (% of tier) 18.3 5.0 1.3 0.2 0.0 Affluence layers based on income percentile (IRS)
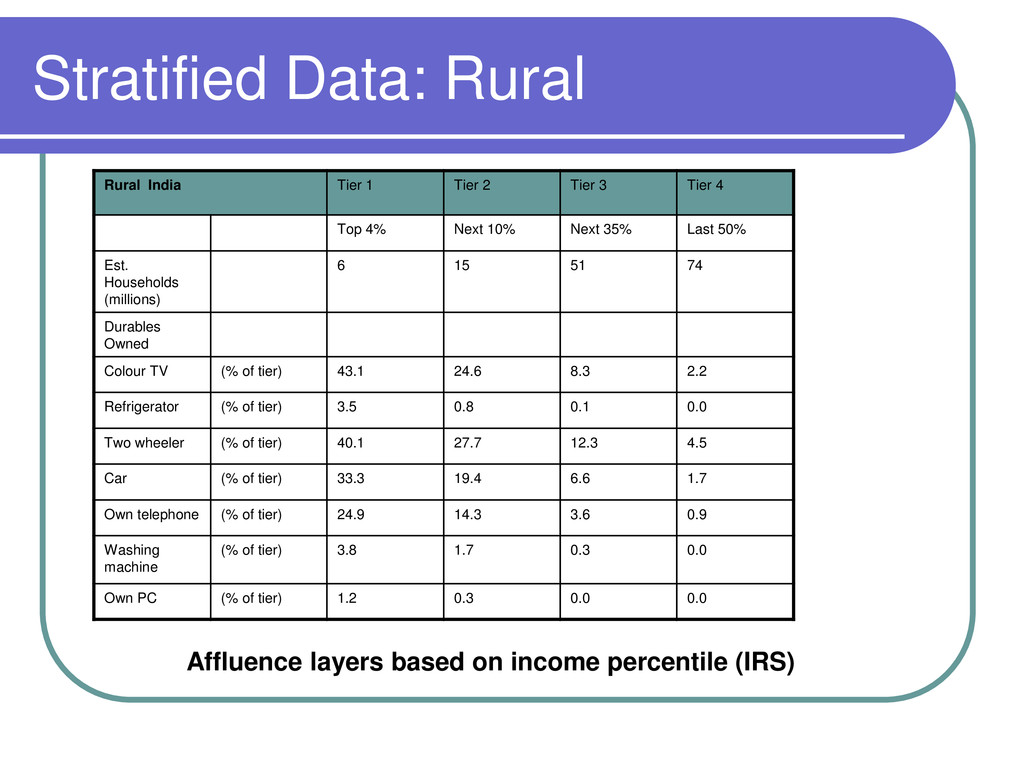
3 Tier 4 Top 4% Next 10% Next 35% Last 50% Est. Households (millions) 6 15 51 74 Durables Owned Colour TV (% of tier) 43.1 24.6 8.3 2.2 Refrigerator (% of tier) 3.5 0.8 0.1 0.0 Two wheeler (% of tier) 40.1 27.7 12.3 4.5 Car (% of tier) 33.3 19.4 6.6 1.7 Own telephone (% of tier) 24.9 14.3 3.6 0.9 Washing machine (% of tier) 3.8 1.7 0.3 0.0 Own PC (% of tier) 1.2 0.3 0.0 0.0 Affluence layers based on income percentile (IRS)
have the power to consume very much at the prices that currently prevail in the market. However, it does not mean they have no desire to consume. It just means that no one has managed to innovate a value right set of products for them.
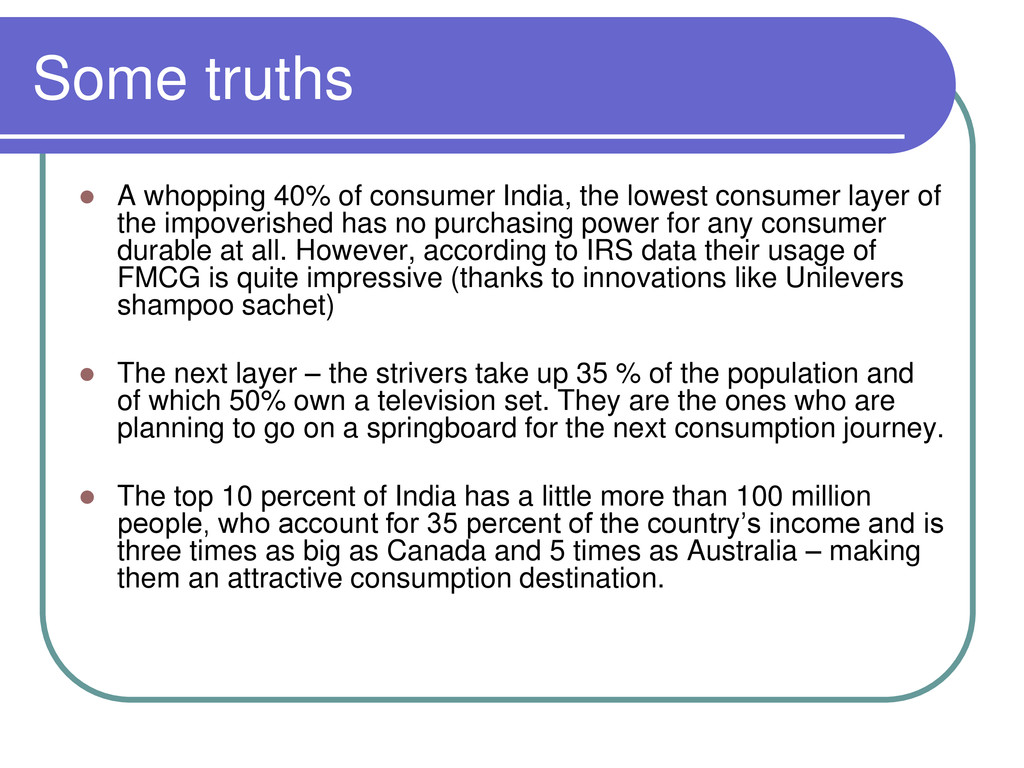
lowest consumer layer of the impoverished has no purchasing power for any consumer durable at all. However, according to IRS data their usage of FMCG is quite impressive (thanks to innovations like Unilevers shampoo sachet) The next layer – the strivers take up 35 % of the population and of which 50% own a television set. They are the ones who are planning to go on a springboard for the next consumption journey. The top 10 percent of India has a little more than 100 million people, who account for 35 percent of the country’s income and is three times as big as Canada and 5 times as Australia – making them an attractive consumption destination.
lives simultaneously across 400 years’. There are several mini Indias in the country and the paradox is that inside each of the mini Indias are several different segments of Indians – who differ in terms of socio, cultural, ethnic and life mindsets.
in 1980s by the Market Research Society of India is by far the most effective way of segmenting the consumer according to his/her consumption patterns. Driven by the idea that in India, occupation and education shape not just an individual’s earning capacity but also family self image and social status and set the tone and tenor of how they live. The ‘people like us – people not like us’ differentiation is very strong in everybody’s mind and governs behaviour. For example, a junior executive with a professional qualification working in a firm may earn the same as a shopkeeper but they live differently. The SEC system also takes into account the rural/urban divide.
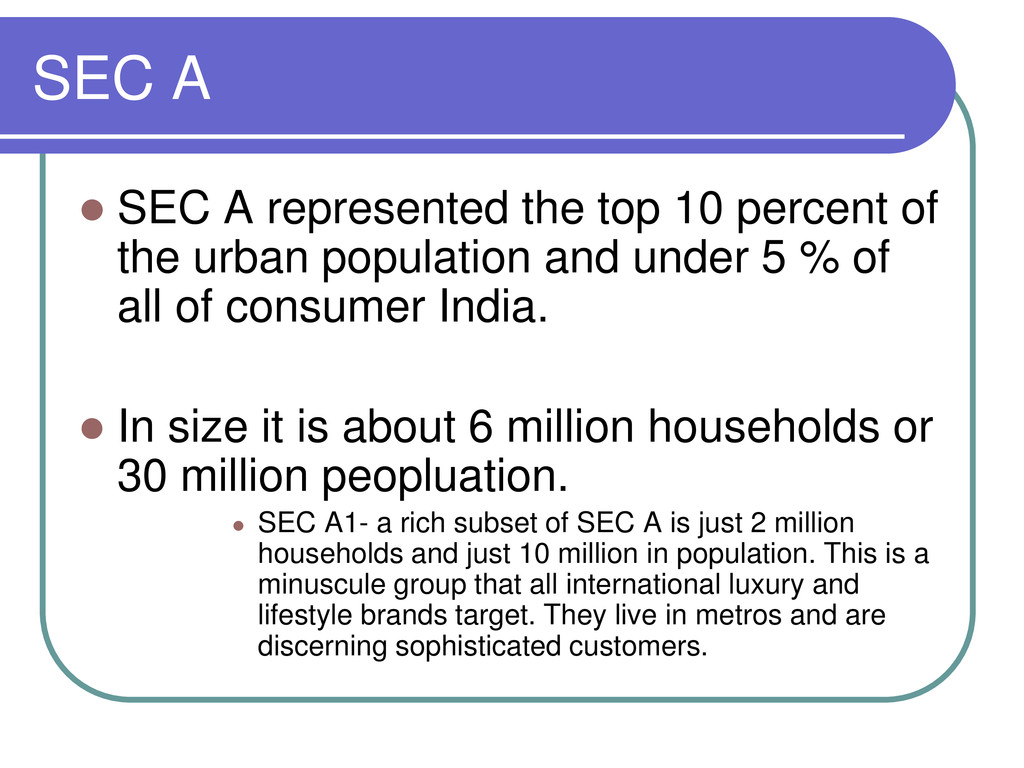
of the urban population and under 5 % of all of consumer India. In size it is about 6 million households or 30 million peopluation. SEC A1- a rich subset of SEC A is just 2 million households and just 10 million in population. This is a minuscule group that all international luxury and lifestyle brands target. They live in metros and are discerning sophisticated customers.
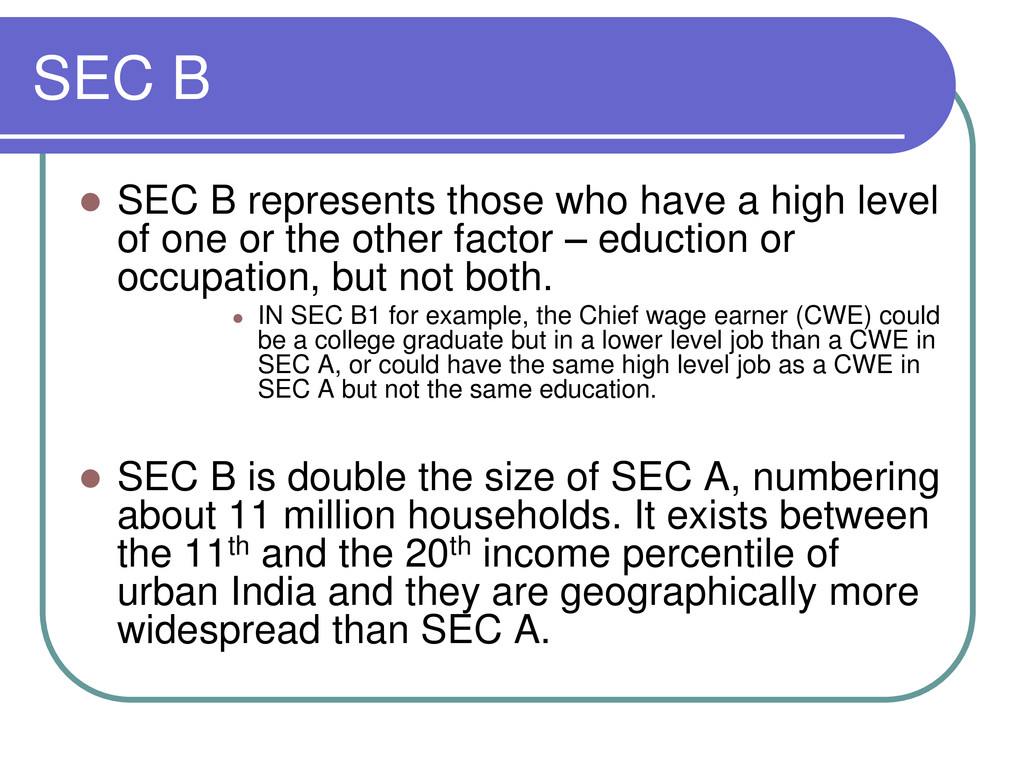
high level of one or the other factor – eduction or occupation, but not both. IN SEC B1 for example, the Chief wage earner (CWE) could be a college graduate but in a lower level job than a CWE in SEC A, or could have the same high level job as a CWE in SEC A but not the same education. SEC B is double the size of SEC A, numbering about 11 million households. It exists between the 11th and the 20th income percentile of urban India and they are geographically more widespread than SEC A.
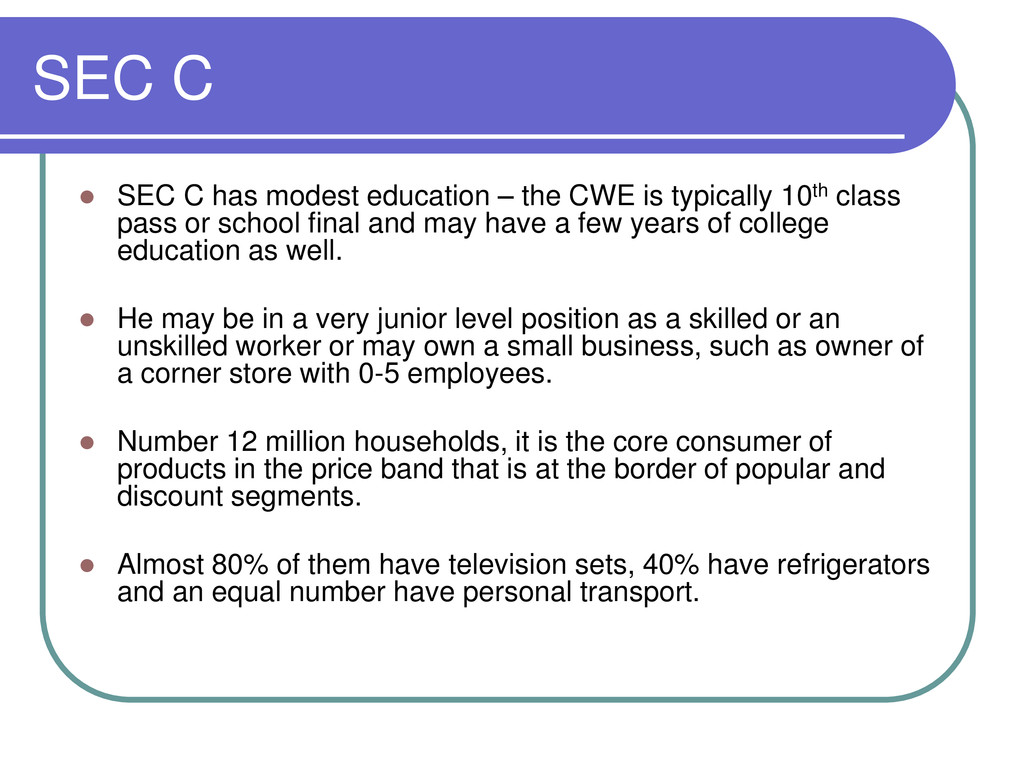
CWE is typically 10th class pass or school final and may have a few years of college education as well. He may be in a very junior level position as a skilled or an unskilled worker or may own a small business, such as owner of a corner store with 0-5 employees. Number 12 million households, it is the core consumer of products in the price band that is at the border of popular and discount segments. Almost 80% of them have television sets, 40% have refrigerators and an equal number have personal transport.
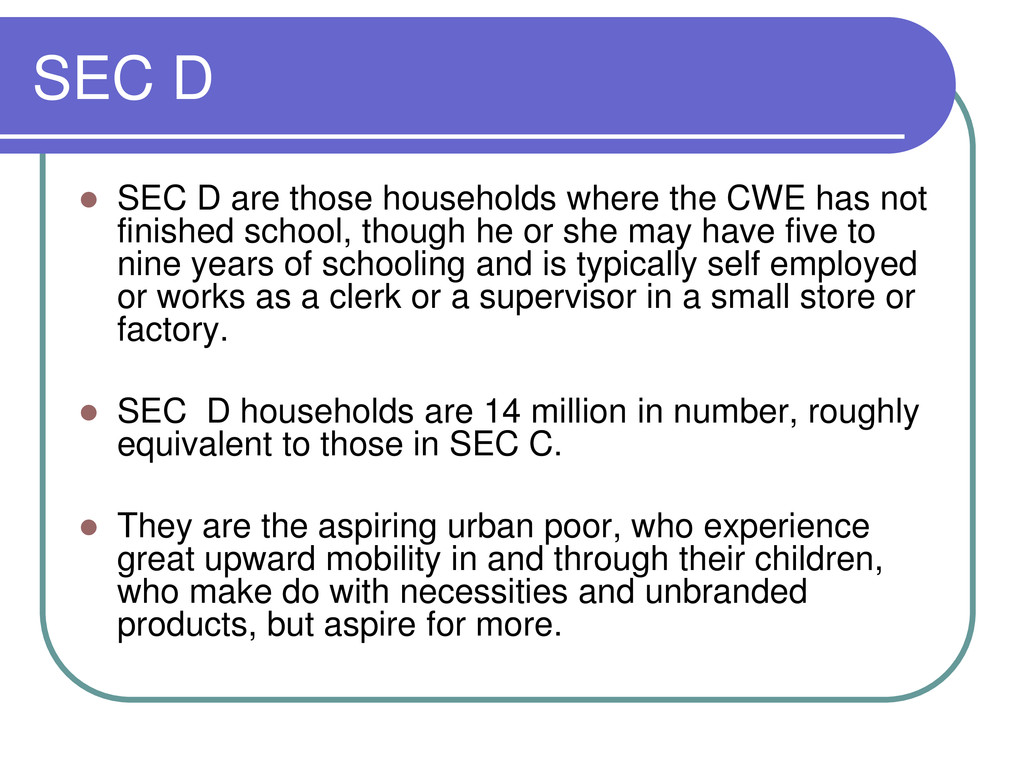
CWE has not finished school, though he or she may have five to nine years of schooling and is typically self employed or works as a clerk or a supervisor in a small store or factory. SEC D households are 14 million in number, roughly equivalent to those in SEC C. They are the aspiring urban poor, who experience great upward mobility in and through their children, who make do with necessities and unbranded products, but aspire for more.
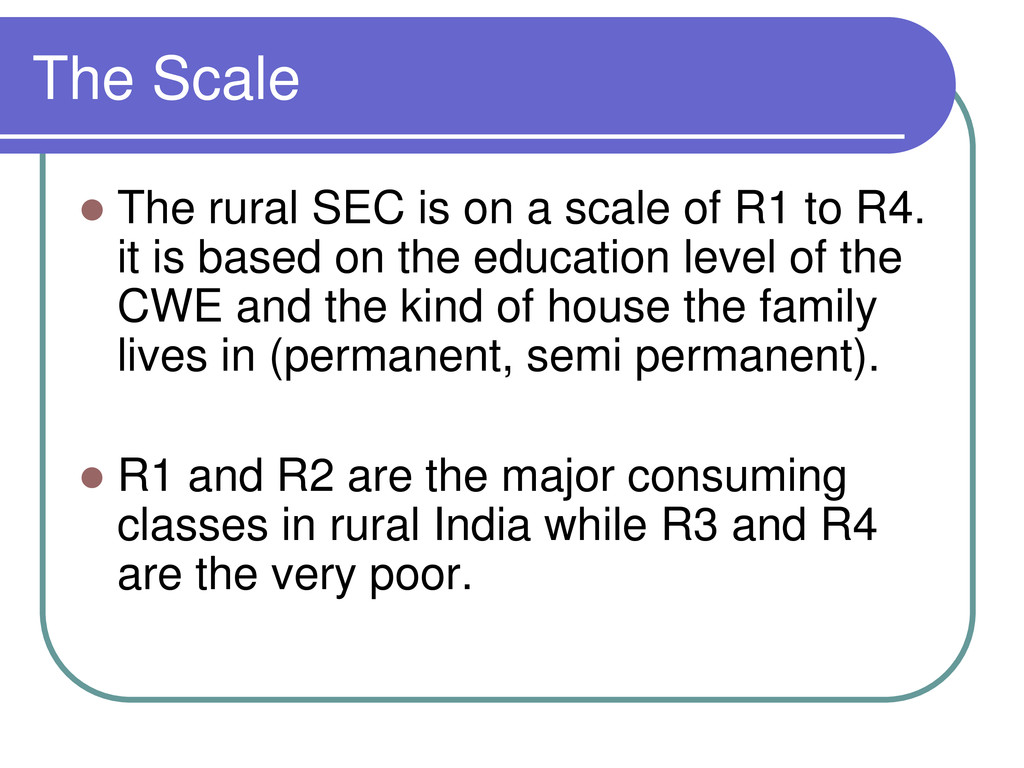
of R1 to R4. it is based on the education level of the CWE and the kind of house the family lives in (permanent, semi permanent). R1 and R2 are the major consuming classes in rural India while R3 and R4 are the very poor.
all rural households are R1 (college educated CWE and living in a permanent structure) and a little over 10 percent are R2. In terms of scale they are equivalent to one third the population of urban India, despite beind 15 % of rural India. Nearly half of rural India is R4, however, in certain states R4 is far smaller in size than R3 and upward mobility has set in.
would own a television of which half would be black and white About 30 million of R3 and R4 households also have television – which is a strong indicator of how much this group can consume in future. The fact that 80 to 90 % of R3 and R4 households use detergents in some form or another is a tribute to the pioneering efforts of Hindustan Unilever, and demonstrates how value right products and marketing juggernaut can work in creating markets out of the poor.
people or the tip of the iceberg in consumer India. They are typically targeted by luxury brands all across the world. SEC A+B Form a greatly favoured ‘my target india’ definition. It encompasses the prospering and spending India, comprising the A and B social classes – about 17 million households or around 85 million consumers. High end Indian brands and upper end international brands which can reduce cost and manufacture loaclly – define their target India as SEC A and B.
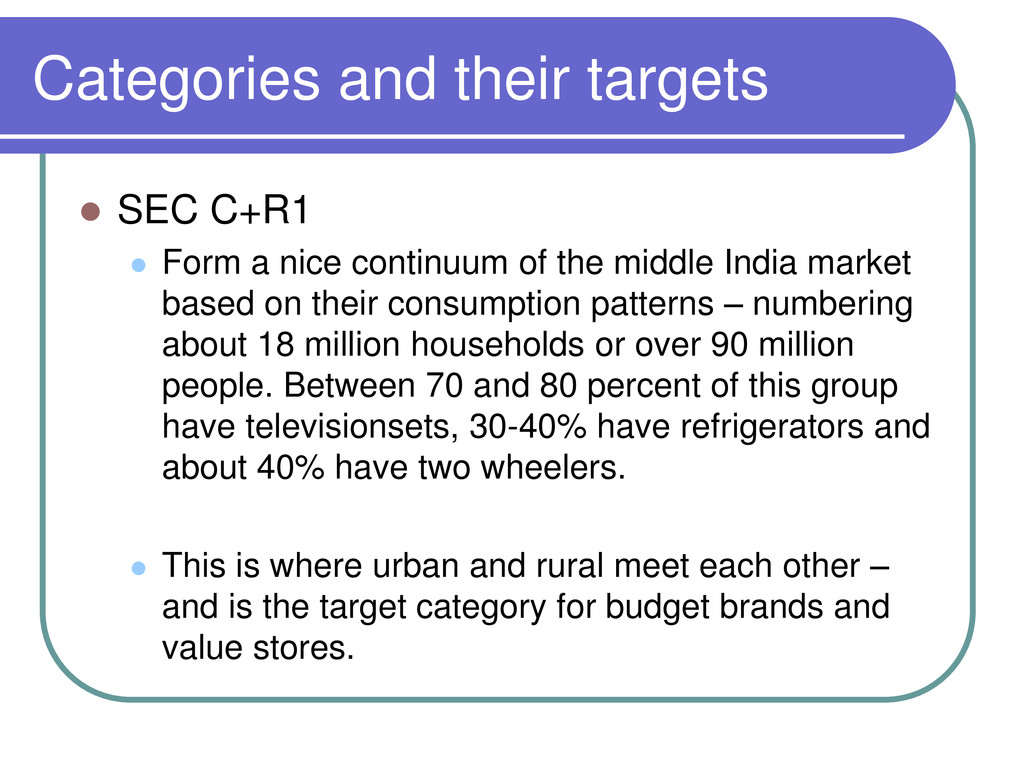
nice continuum of the middle India market based on their consumption patterns – numbering about 18 million households or over 90 million people. Between 70 and 80 percent of this group have televisionsets, 30-40% have refrigerators and about 40% have two wheelers. This is where urban and rural meet each other – and is the target category for budget brands and value stores.
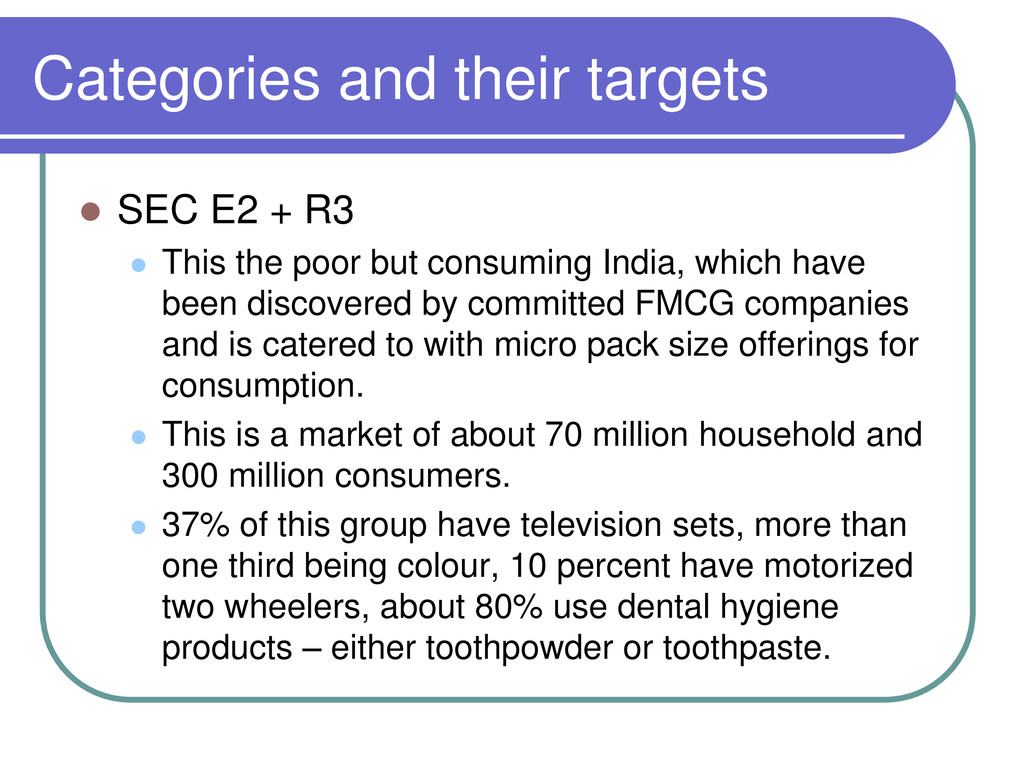
This the poor but consuming India, which have been discovered by committed FMCG companies and is catered to with micro pack size offerings for consumption. This is a market of about 70 million household and 300 million consumers. 37% of this group have television sets, more than one third being colour, 10 percent have motorized two wheelers, about 80% use dental hygiene products – either toothpowder or toothpaste.
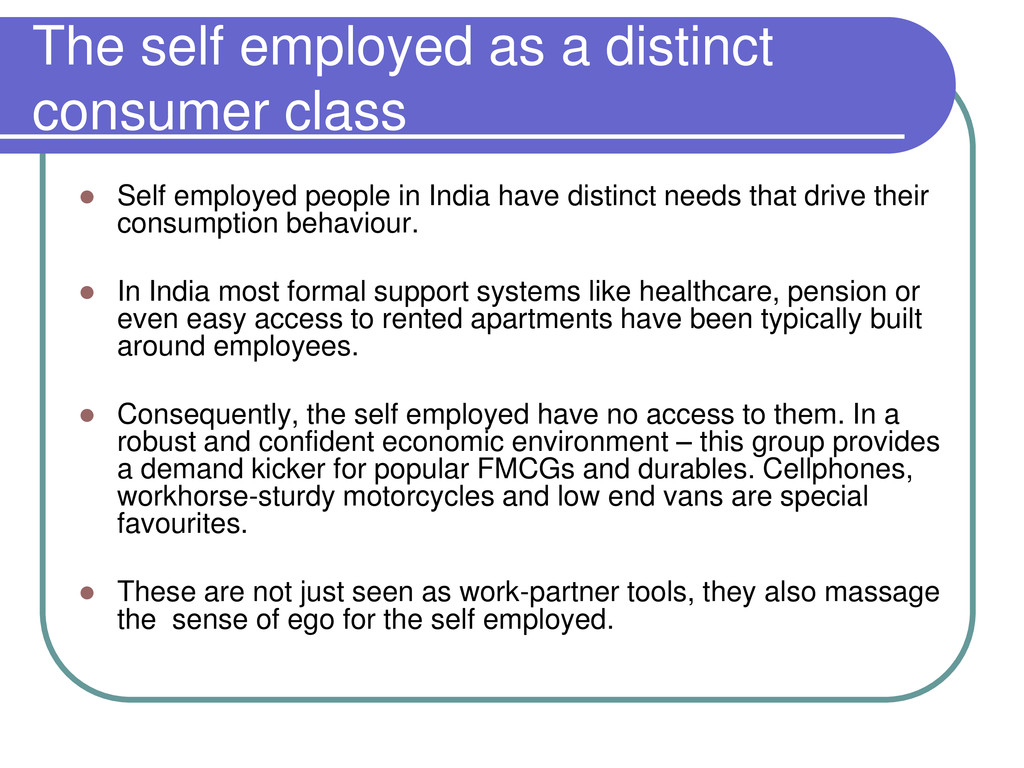
employed people in India have distinct needs that drive their consumption behaviour. In India most formal support systems like healthcare, pension or even easy access to rented apartments have been typically built around employees. Consequently, the self employed have no access to them. In a robust and confident economic environment – this group provides a demand kicker for popular FMCGs and durables. Cellphones, workhorse-sturdy motorcycles and low end vans are special favourites. These are not just seen as work-partner tools, they also massage the sense of ego for the self employed.
at roughly the same time in the same place in the country. Consequently, they have experienced the same major economic, political and social upheavels at about the same age. Their lives are punctuated by the same crisis, nation – memories of music, film, entertainers, public figures, fashion and fads. And they encounter every new decade, each with its own particular flavour, at similar stages in their lives”.
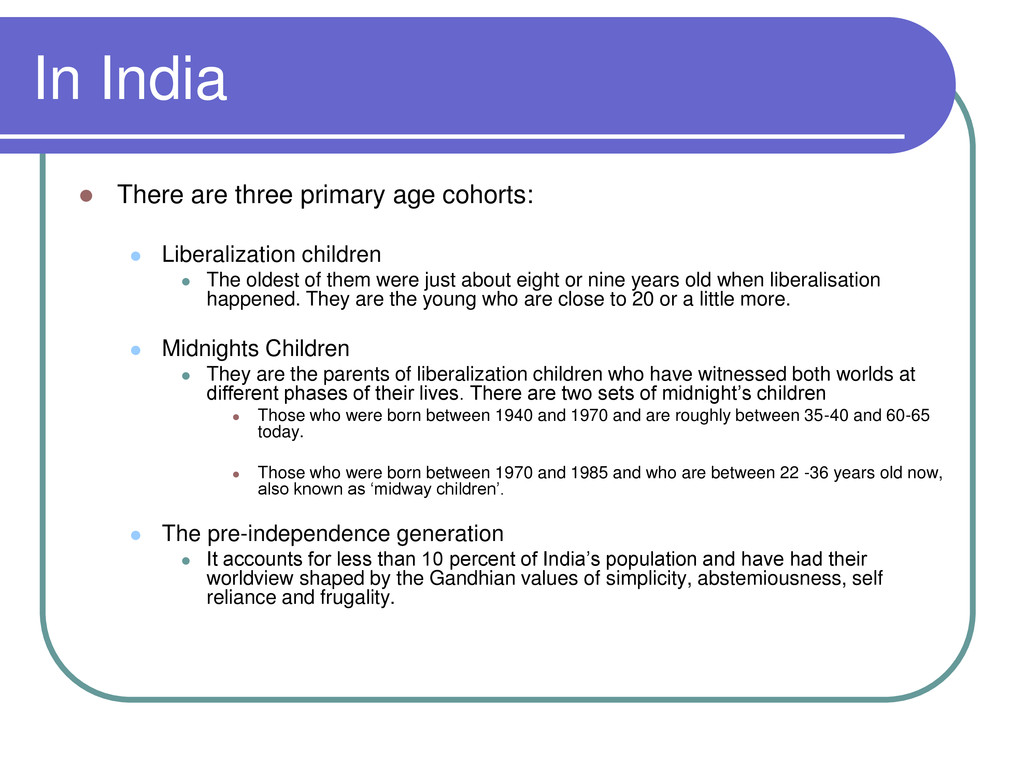
Liberalization children The oldest of them were just about eight or nine years old when liberalisation happened. They are the young who are close to 20 or a little more. Midnights Children They are the parents of liberalization children who have witnessed both worlds at different phases of their lives. There are two sets of midnight’s children Those who were born between 1940 and 1970 and are roughly between 35-40 and 60-65 today. Those who were born between 1970 and 1985 and who are between 22 -36 years old now, also known as ‘midway children’. The pre-independence generation It accounts for less than 10 percent of India’s population and have had their worldview shaped by the Gandhian values of simplicity, abstemiousness, self reliance and frugality.
percent of India’s population. For them, things foreign are a sensible, pragmatic choice, but primarily if their purchase can be justified on the grounds of their functionality rather than their brand or badge value. Often, the badge value vouches for the functionality itself – and therefore prompts a consumer of this kind to buy the product.
cohort of today – comprising about 55 percent of today’s population. They have experienced life both before and after liberalization and have seen enormous progress. The higher social classes amongst them are at the peak of their earning careers and consume, almost in a childlike manner, by themselves and through their children to make up for all the years of childhood deprivation. This cohort is also very value conscious, is perennially guilty about consuming and needs a rational function based reason to part with the big bucks.
midnight’s children or midway children – the early liberalization generation is just beginning to enter adulthood. Statistics indicate that even in 2025, about half the households will still be run by midway children. The coexistence of various shades and grades of consumption ideologies will continue to be an irrefutable fact in Consumer India for some time.
which businesses in India have dealt with ethnicity and made it work for them. In the area of media and entertainment there is no single channel or film producer or film star that enjoys pan-Indian popularity. Even Bollywood, the hindi film industry, is not popular in south India where regional language films. It isn’t just an issue with language – but with cultural identification.
highest viewership over years in the Indian television history. Her story lines were often seen to be regressive and ordinary by many critics – but yet she notched up high viewership. Her formula lay in executing programmes around different ethnic groups, because she knew the extent to which ethnic identity influenced consumer preferences.
tea called ‘Taaza’ popular in the 1990s was positioned across India on the same platform of freshness but contained high flavour Darjeeling or strong Assam tea depending on which part of the country it is available in. Case 2 FM Radio as a category does it all the time – creating specialised content to fit different regional and ethnic flavours.
hard to see ways. Sometimes it appears like everything is changing, at other times, it appears like nothing ever changes. Executives who work on their strat plans confess that year after year, they watch with an eagle eye and very often report that they have not found any significant change worth mentioning. Yet five years down the line they realise that the market is starting to look distinctly different. They invariably end up wondering ‘how’ and ‘when’ did this change happen. To experienced market watchers this is nothing but going back to high school Physics where we learnt Force=massXacceleration. The same is true for India as well – where a small force can unleash a large change if the mass under question is extremely huge.
can be traced back to the FMCG category in 2000 – when the category suddenly saw a puzzling decline in demand and consumer downtrading, despite income shooting up. Broader investigation revealed that the primary responsibility for this lay outside the FMCG world. The simultaneous blossoming of several categories such as consumer durables, housing finance, etc. had the consumer investing in such categories and spending carefully when it came to FMCG goods.
which change can happen Molting change Such as a snake which sheds its old skin and gets into a new one Morphing Change Slow but definitive change that happens over a long period of time. Change in India is of the morphing kind through ‘mixed verdicts’ and ‘continuity with change’ and people who are looking out for a molting change get frustrated.
verdict in India Starting from politics to business, India is the land of mixed verdict . The voting behaviour of the country is the best illustration of it – after the general election it is not unusual to find that the party qualified to rule at the center could have a majority of the seats but a minority of the vote share. Also, even in the top eight metro cities in India, we see that only 25 percent of the population own cars and only 10 percent own air conditioners. This too the topmost SEC. but on the other hand - in the top twenty three urban centers one out of two of the lowest SEC households has a television set, one in three has an audio system and one in five has cooking gas and satellite TV access.
change is that of the institution of marriage. Young people today don’t always want an arranged marriage – because it is backdated. But not all of them are eager to search for their own partners either – as it is too much hassle. Therefore they go for engineered arranged marriages – where instead of the entire groom’s family – a few close relatives visit the girl’s house, the boy and the girl also meet somewhere in private a few times and then take a decision. Modernity in India is often likened to the loosening of a tight fist – another prime example of continuity with change. Women are not moving en masse to western apparel – but the salwar kameez is giving sari a run for its money; at the same time the traditional salwar kameez is getting more of a fusion look called ‘east west’ outfits – where the kurta is shorter and the pyjama more tight and resembling a trouser.
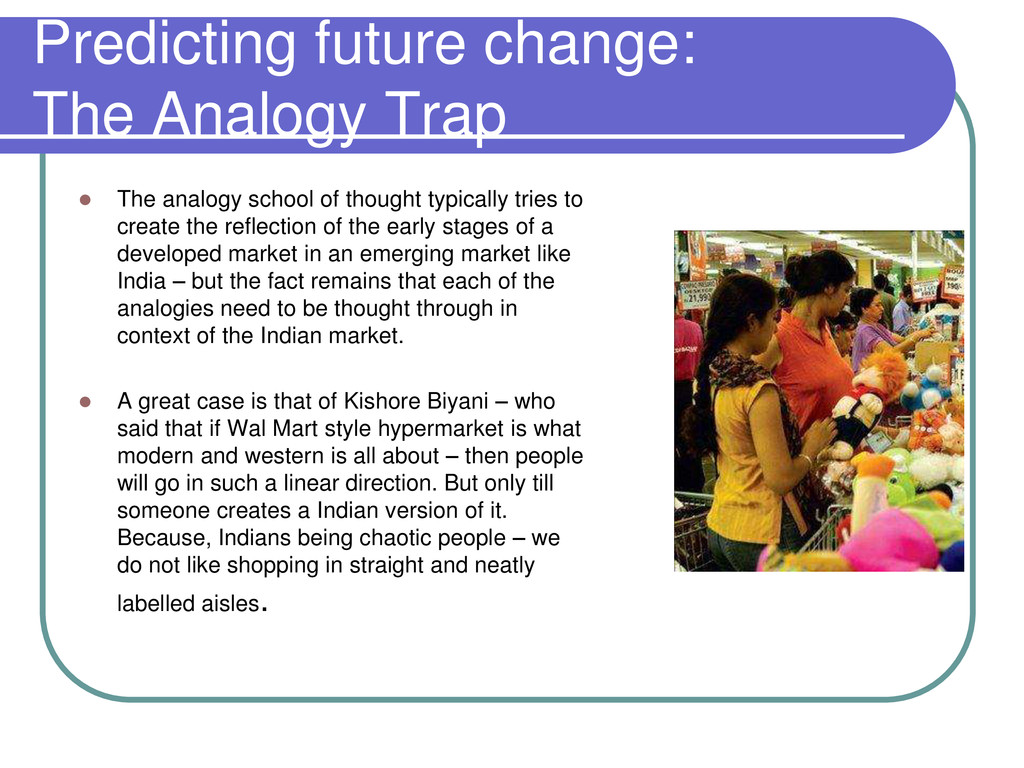
of thought typically tries to create the reflection of the early stages of a developed market in an emerging market like India – but the fact remains that each of the analogies need to be thought through in context of the Indian market. A great case is that of Kishore Biyani – who said that if Wal Mart style hypermarket is what modern and western is all about – then people will go in such a linear direction. But only till someone creates a Indian version of it. Because, Indians being chaotic people – we do not like shopping in straight and neatly labelled aisles.
say that there are three things that will drive the growth of consumer India The coming of age of liberalization children – who will drive consumption with a new vigour The changing Indian woman The rising income and consumption and the eventual transformation of rural India.
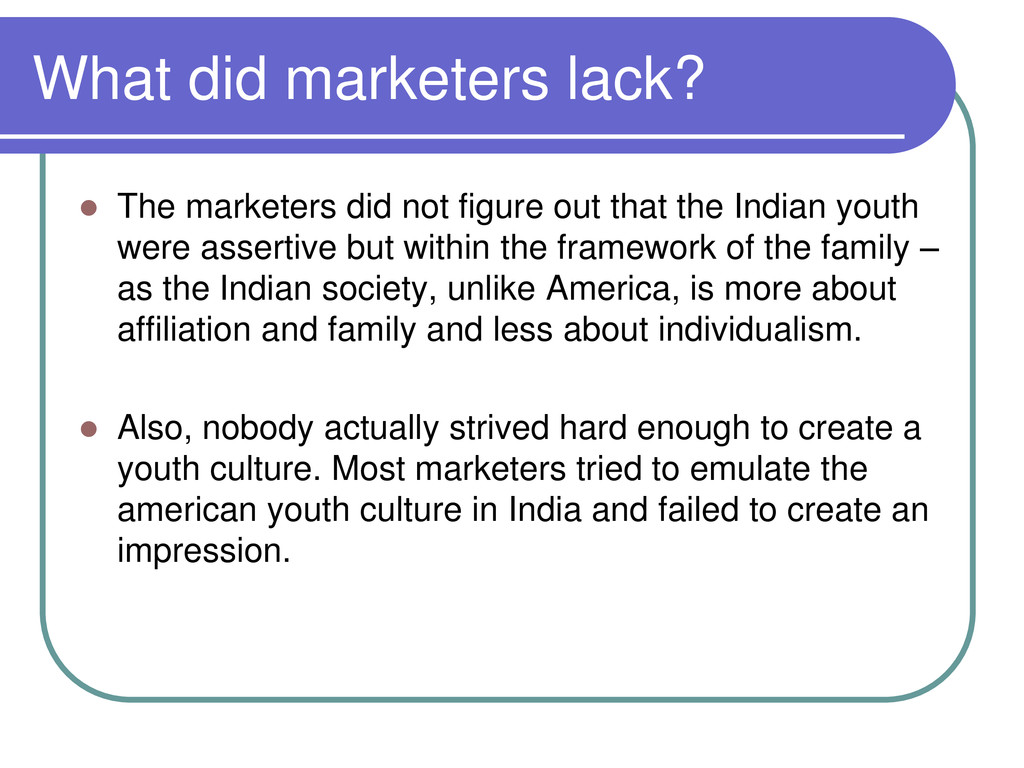
country with about half a billion people below the age of 25 (and the first non-socialistic generation in the country) would have a very vibrant youth market. Therefore for global marketers the expectation out of young India was similar to what they would have expected from a coming of age of USA. As a consequence, young India belied their expectations and reacted in a mixed way. Many youth brands like Coke, Pepsi, Levis and Wrangler did not have the success that they thought they would have.
out that the Indian youth were assertive but within the framework of the family – as the Indian society, unlike America, is more about affiliation and family and less about individualism. Also, nobody actually strived hard enough to create a youth culture. Most marketers tried to emulate the american youth culture in India and failed to create an impression.
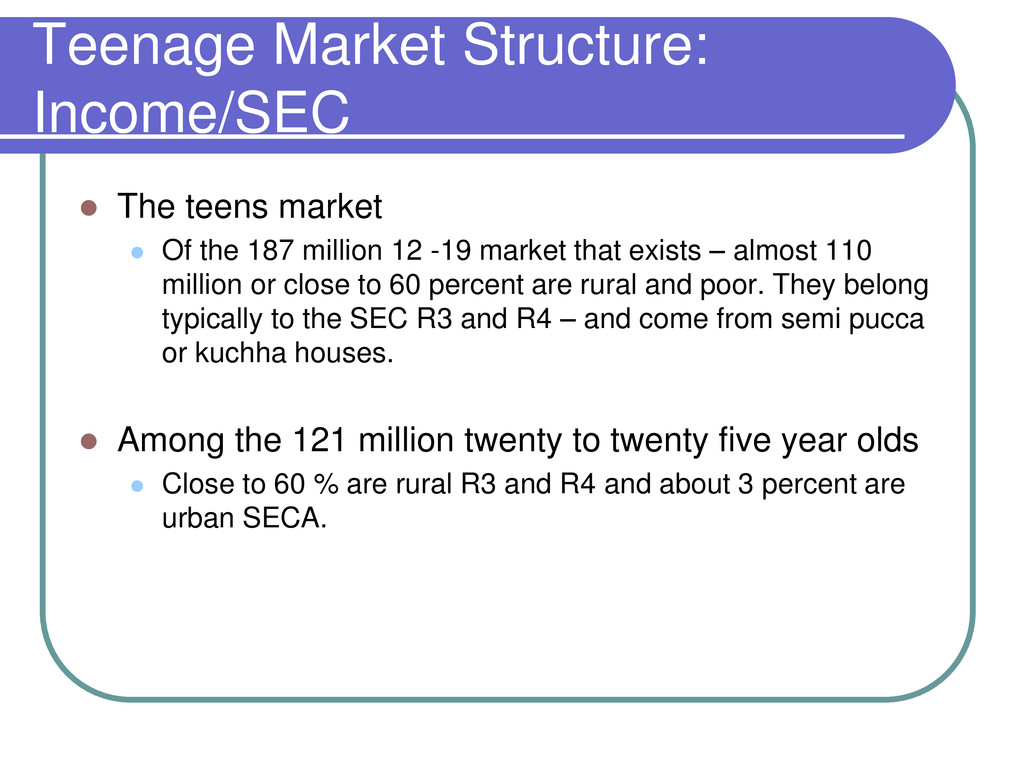
the 187 million 12 -19 market that exists – almost 110 million or close to 60 percent are rural and poor. They belong typically to the SEC R3 and R4 – and come from semi pucca or kuchha houses. Among the 121 million twenty to twenty five year olds Close to 60 % are rural R3 and R4 and about 3 percent are urban SECA.
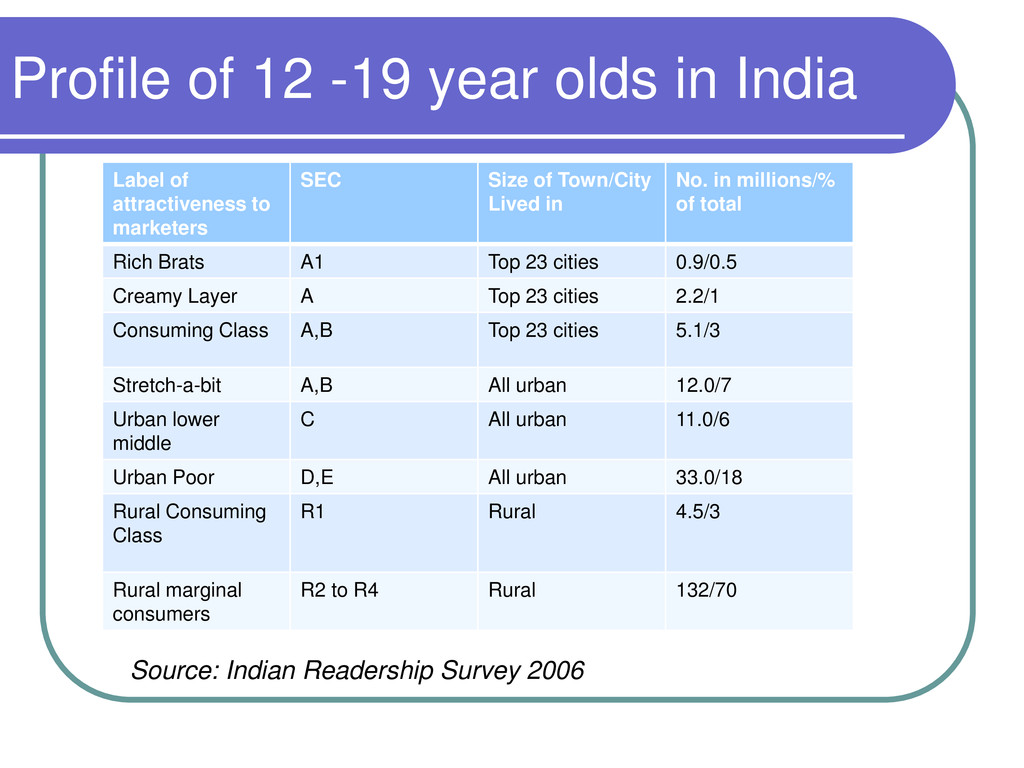
attractiveness to marketers SEC Size of Town/City Lived in No. in millions/% of total Rich Brats A1 Top 23 cities 0.9/0.5 Creamy Layer A Top 23 cities 2.2/1 Consuming Class A,B Top 23 cities 5.1/3 Stretch-a-bit A,B All urban 12.0/7 Urban lower middle C All urban 11.0/6 Urban Poor D,E All urban 33.0/18 Rural Consuming Class R1 Rural 4.5/3 Rural marginal consumers R2 to R4 Rural 132/70 Source: Indian Readership Survey 2006
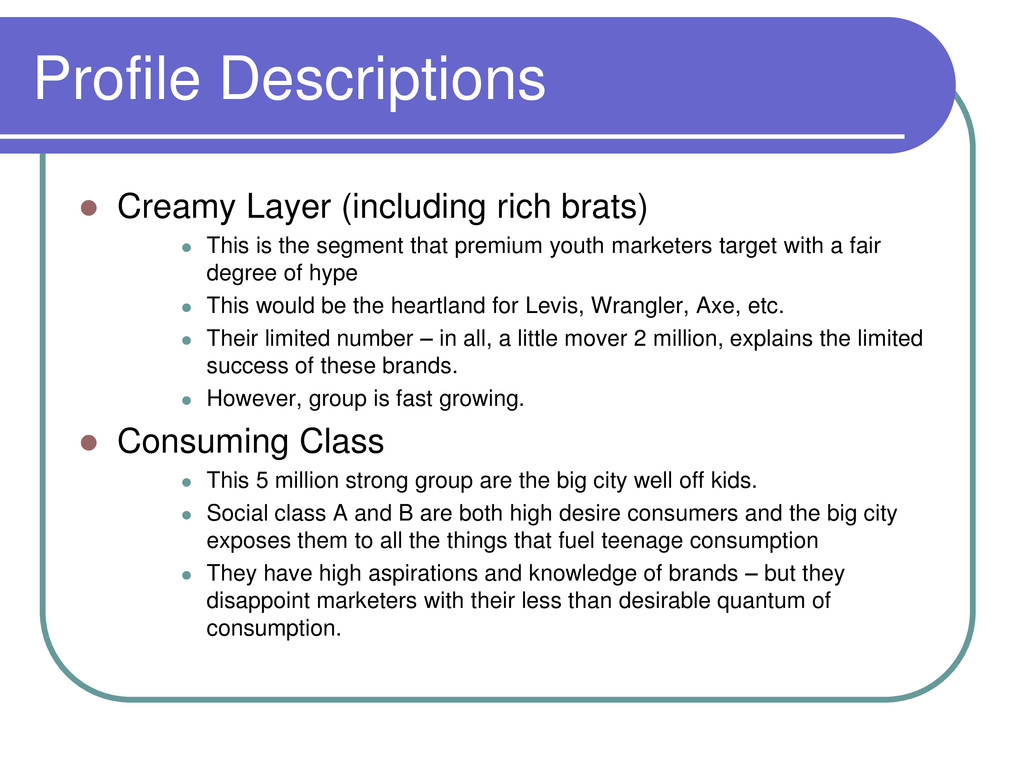
is the segment that premium youth marketers target with a fair degree of hype This would be the heartland for Levis, Wrangler, Axe, etc. Their limited number – in all, a little mover 2 million, explains the limited success of these brands. However, group is fast growing. Consuming Class This 5 million strong group are the big city well off kids. Social class A and B are both high desire consumers and the big city exposes them to all the things that fuel teenage consumption They have high aspirations and knowledge of brands – but they disappoint marketers with their less than desirable quantum of consumption.
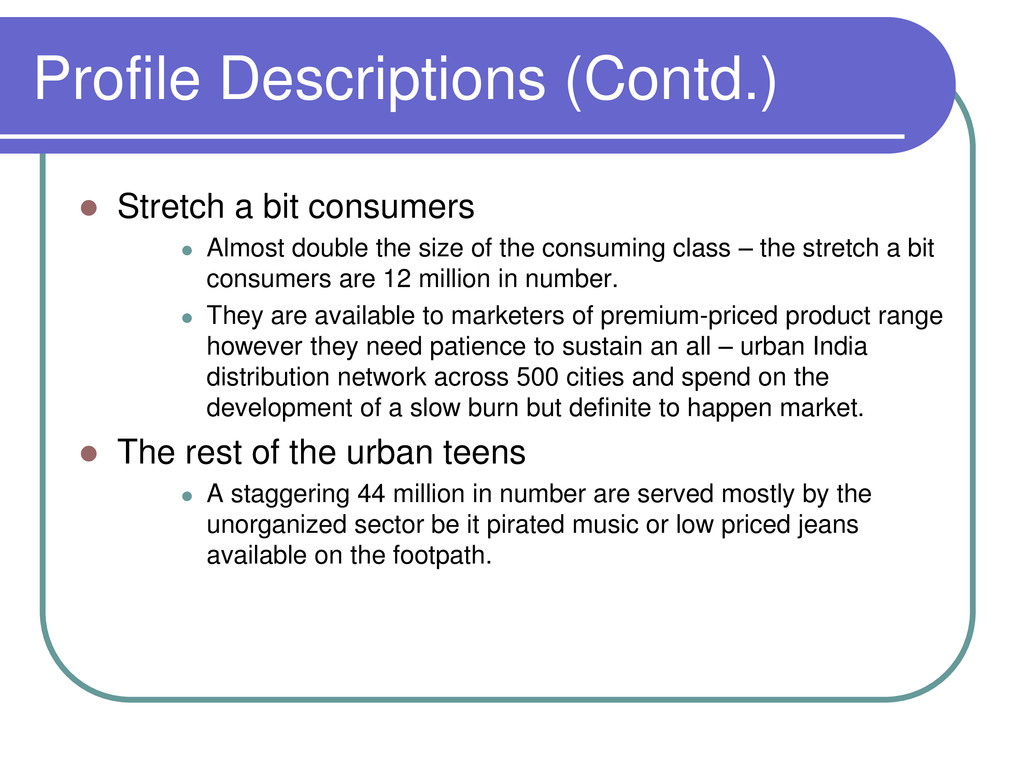
double the size of the consuming class – the stretch a bit consumers are 12 million in number. They are available to marketers of premium-priced product range however they need patience to sustain an all – urban India distribution network across 500 cities and spend on the development of a slow burn but definite to happen market. The rest of the urban teens A staggering 44 million in number are served mostly by the unorganized sector be it pirated music or low priced jeans available on the footpath.
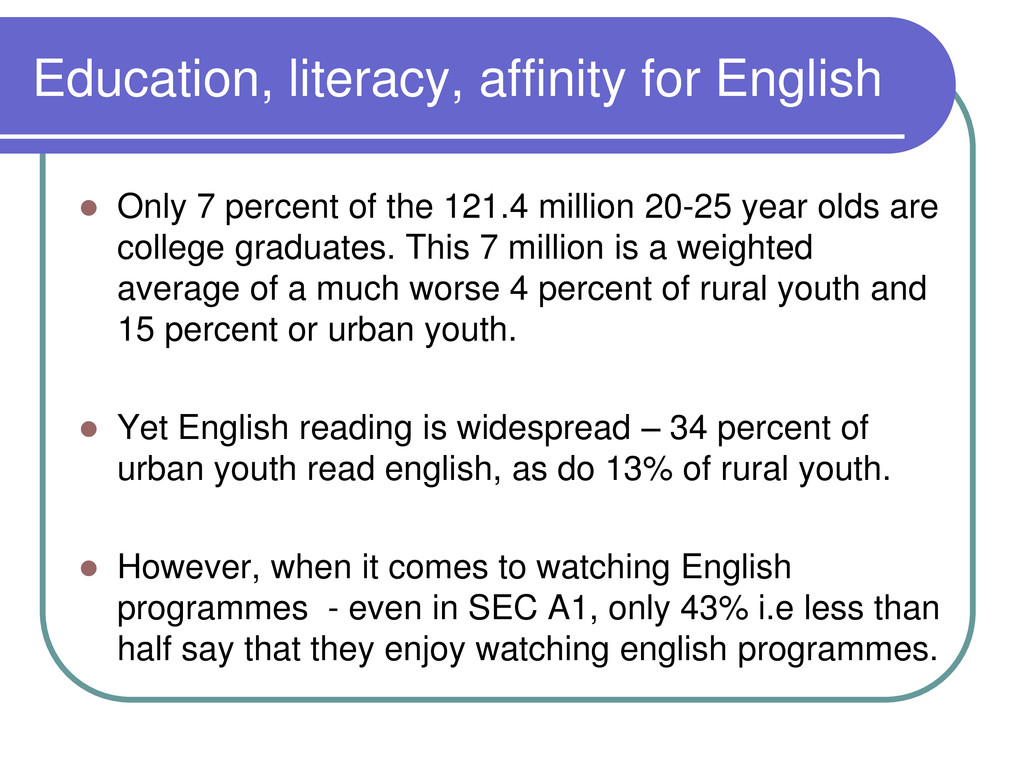
the 121.4 million 20-25 year olds are college graduates. This 7 million is a weighted average of a much worse 4 percent of rural youth and 15 percent or urban youth. Yet English reading is widespread – 34 percent of urban youth read english, as do 13% of rural youth. However, when it comes to watching English programmes - even in SEC A1, only 43% i.e less than half say that they enjoy watching english programmes.
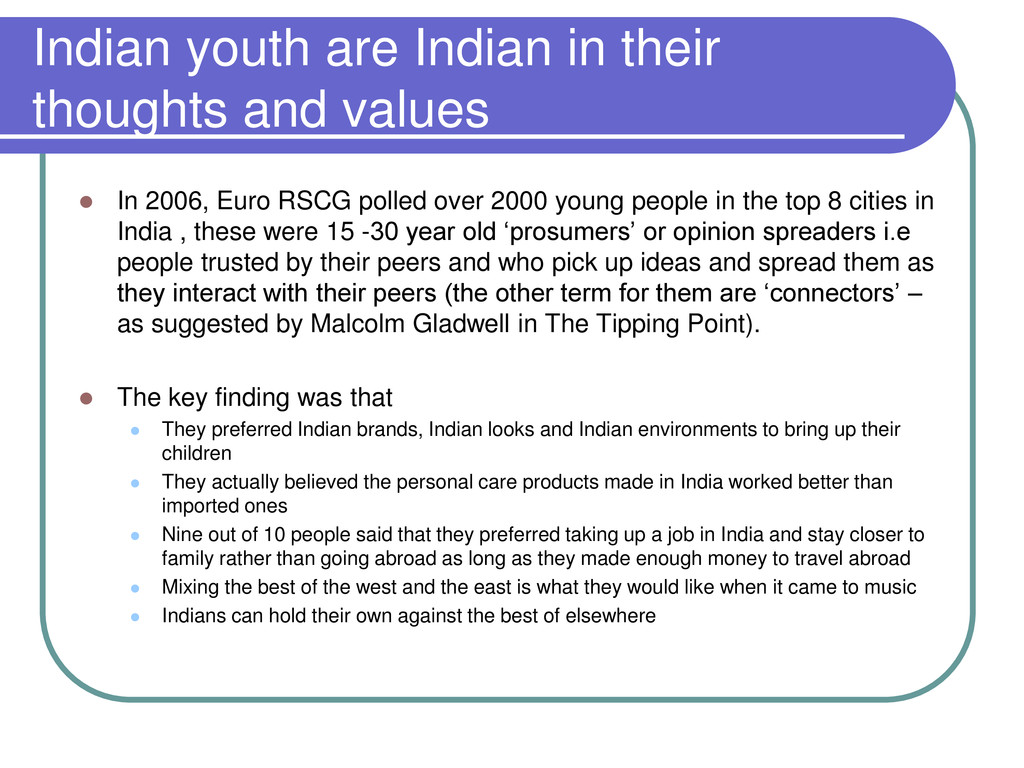
In 2006, Euro RSCG polled over 2000 young people in the top 8 cities in India , these were 15 -30 year old ‘prosumers’ or opinion spreaders i.e people trusted by their peers and who pick up ideas and spread them as they interact with their peers (the other term for them are ‘connectors’ – as suggested by Malcolm Gladwell in The Tipping Point). The key finding was that They preferred Indian brands, Indian looks and Indian environments to bring up their children They actually believed the personal care products made in India worked better than imported ones Nine out of 10 people said that they preferred taking up a job in India and stay closer to family rather than going abroad as long as they made enough money to travel abroad Mixing the best of the west and the east is what they would like when it came to music Indians can hold their own against the best of elsewhere
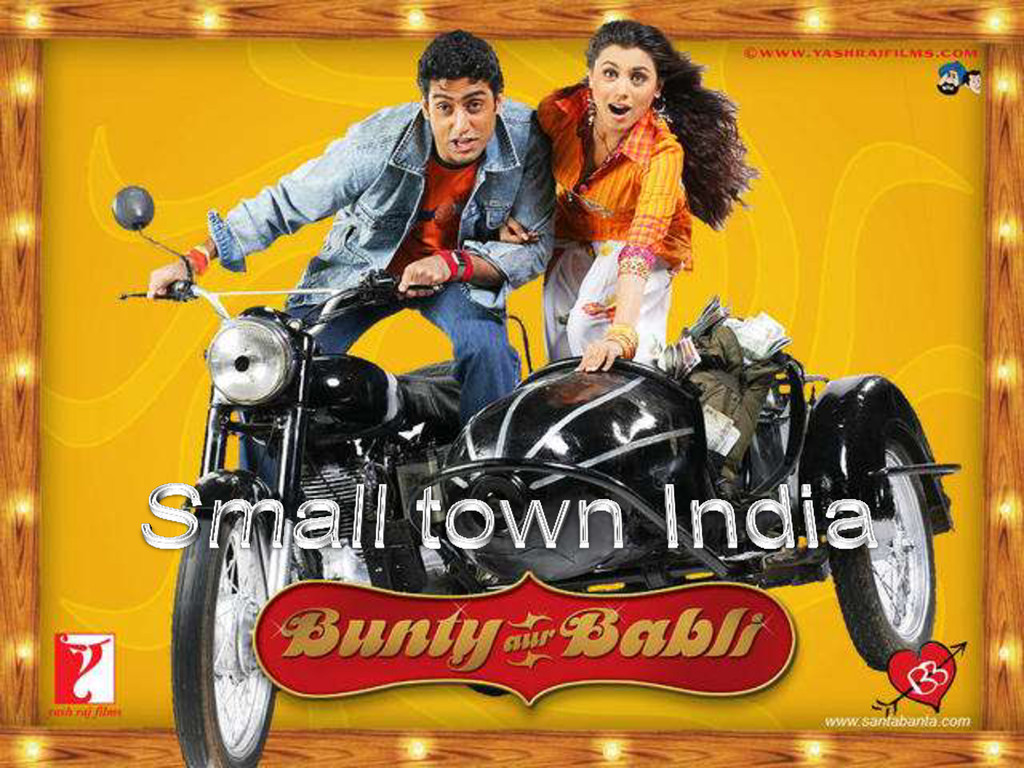
perfectly explained the worldview of India’s small town young adults. The two chief protagonists – Bunty and Babli are small town young enthusiasts with high aspirations. While Babli wants to be a supermodel and wants to join the Miss India contest to that effect, Bunty believes that a financial services business involving small depositors and finance companies could well be a route to becoming rich. They are united by the severe hunger to escape the humdrum, modest world and turn into voyagers who do not worry about worrying the parents, have no deep yearning for home and just enjoy the pragmatism of missing home cooked food.
a rebellion that brews in small town India. Rebellion is old fashioned for the SEC A metro kids who do not need or want to rock the boats – but for small town India, searching for an escape velocity into the consumerist paradise purely with the desire to achieve fun and enjoy it all.
story too in the movie Bunty’s ‘Nikee’ t-shirt, jeans and sneakers are a good example of what the non premium market is all about – not less style at lower cost, but a more affordable, slightly less perfect clone. Babli’s familiar in concept but totally morphed salwar kameez also tells you about the marriage of east and west story.
get married echoes the theme of Phir bhi dil hai hindustani They take the ritual seven steps around the fire but the vows that are traditionally taken with each step are modernized She is a virgin till her wedding day despite living together before and is not coy about physicality when it is permissible The feminist statement of being an equal partner is a thread that is run throughout the film without overt mention And the reasonable man taking over from the egoist male is clearly present.
in the household consumption behaviour are happening rapidly because more women are now working outside home – and they are becoming more exposed and financially independent. While this is true to some extent – the reality in consumer India is not so simple.
Urban India have a job outside of home. In comparison, this number is 42% in rural India, where working in the fields is common for women. What’s more, as households get richer, the proportion of women in the workforce falls.
women working outside home does not have the expected impact on consumption, since the ‘this as well as that’ working woman continues to the play the traditional role at home, and is in many ways the last to change practices inside the home. Working outside home may change her spending and saving patterns on personal products but not her household behaviour in most cases.
working women just emerging, called micro entrepreneurs, who run what they call home businesses. A 2006 study conducted for TIE ( a non-profit organisation) in six cities among 1200 women in the social class B,C and D showed that 25 percent were already doing some work from home and another 30 percent intended to start a home business.
working women is not driving change as much as the increasing number of housewives who have acquired the ‘working women’ mindset. Working from home or not, all women say that they see themselves as chief executive of the household and primary coaches of children. Also, since 60 percent of families both urban and rural, are nuclear, the housewife sees herself as having a very important role to play. This is called ‘womanism’ which drives a major change across households in consumer India. Starting from micro finance in the rural areas, SHG movement, to the choice of a child’s education in urban India– womanism had had serious impact on consumption behaviour in India.
the driving forces is the increase in education amongst women of all social strata especially urban women. At one level, the statistics on household education are dismal – only 12 percent of urban housewives are college graduates and another 20% have completed school. 30% are illiterate and remaining 40% have studied up to a maximum of class 9. individually, the percentages are low but on adding up, the total educational capital available to women is large enough to drive morphing change.
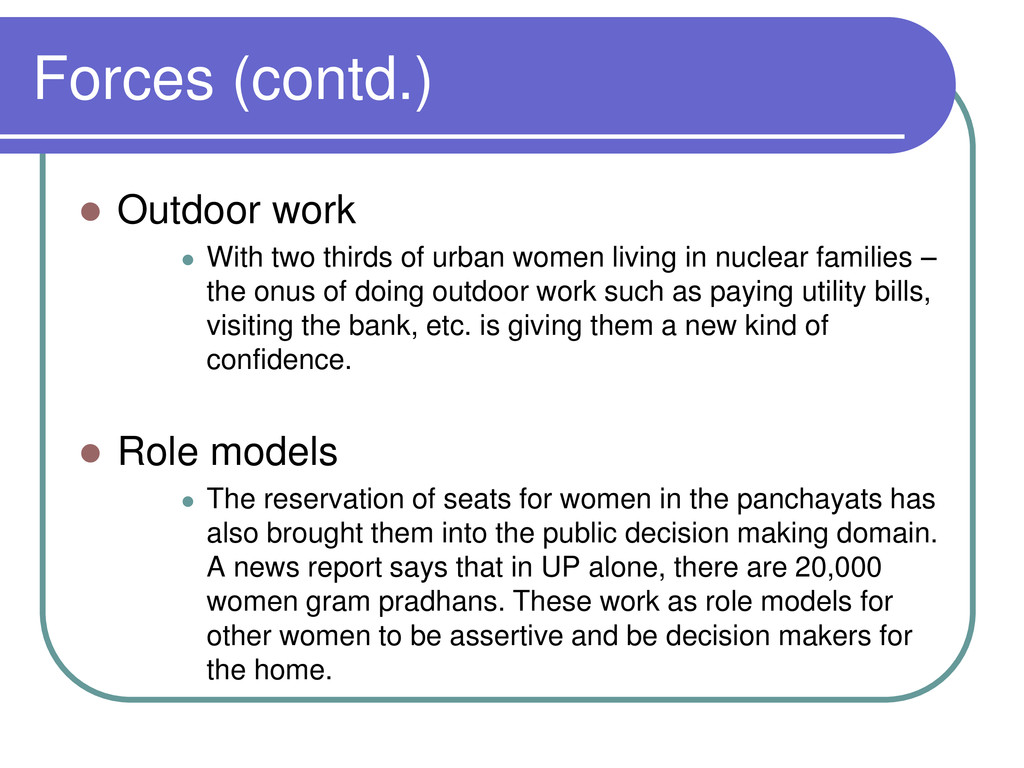
urban women living in nuclear families – the onus of doing outdoor work such as paying utility bills, visiting the bank, etc. is giving them a new kind of confidence. Role models The reservation of seats for women in the panchayats has also brought them into the public decision making domain. A news report says that in UP alone, there are 20,000 women gram pradhans. These work as role models for other women to be assertive and be decision makers for the home.
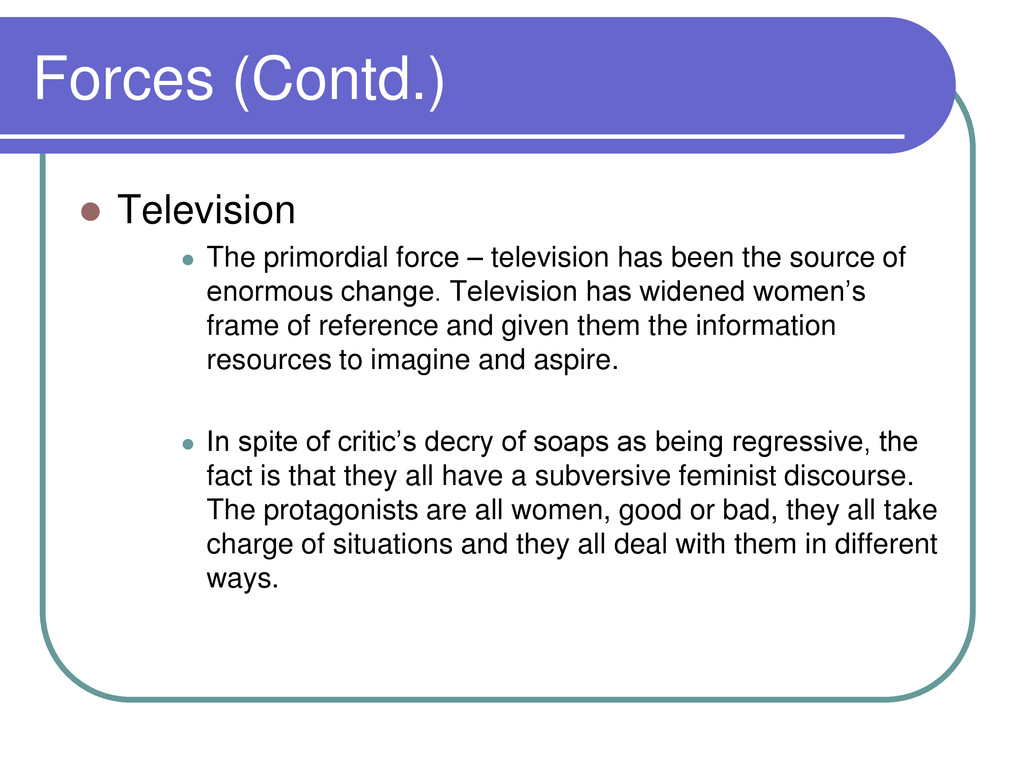
has been the source of enormous change. Television has widened women’s frame of reference and given them the information resources to imagine and aspire. In spite of critic’s decry of soaps as being regressive, the fact is that they all have a subversive feminist discourse. The protagonists are all women, good or bad, they all take charge of situations and they all deal with them in different ways.
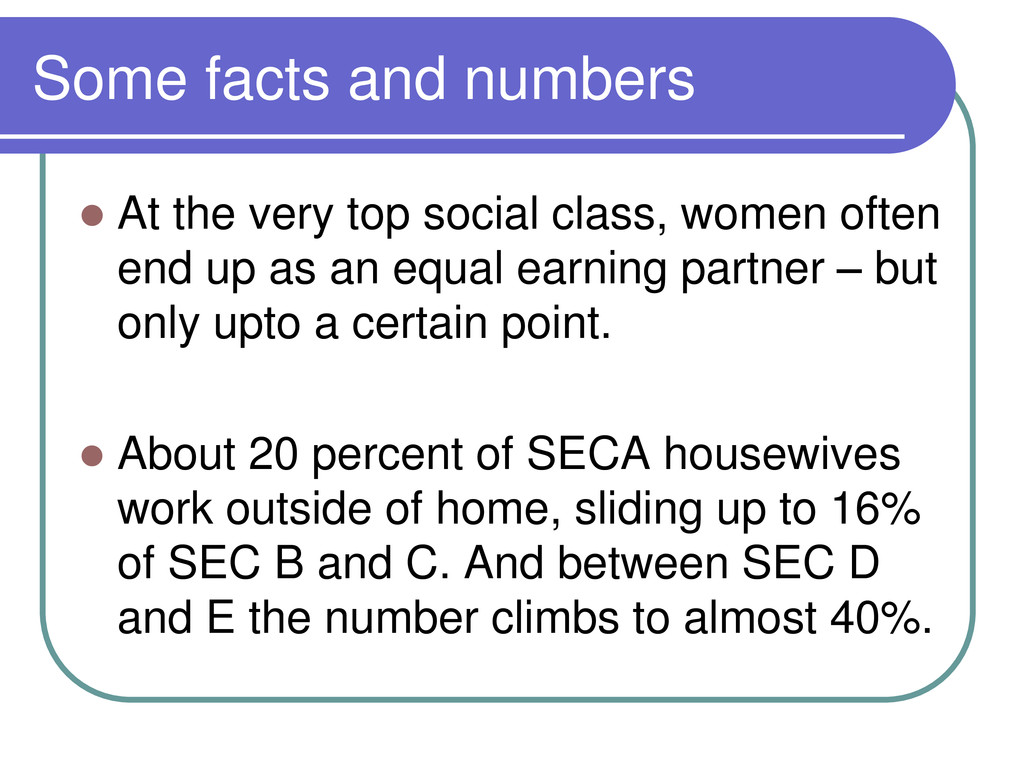
class, women often end up as an equal earning partner – but only upto a certain point. About 20 percent of SECA housewives work outside of home, sliding up to 16% of SEC B and C. And between SEC D and E the number climbs to almost 40%.
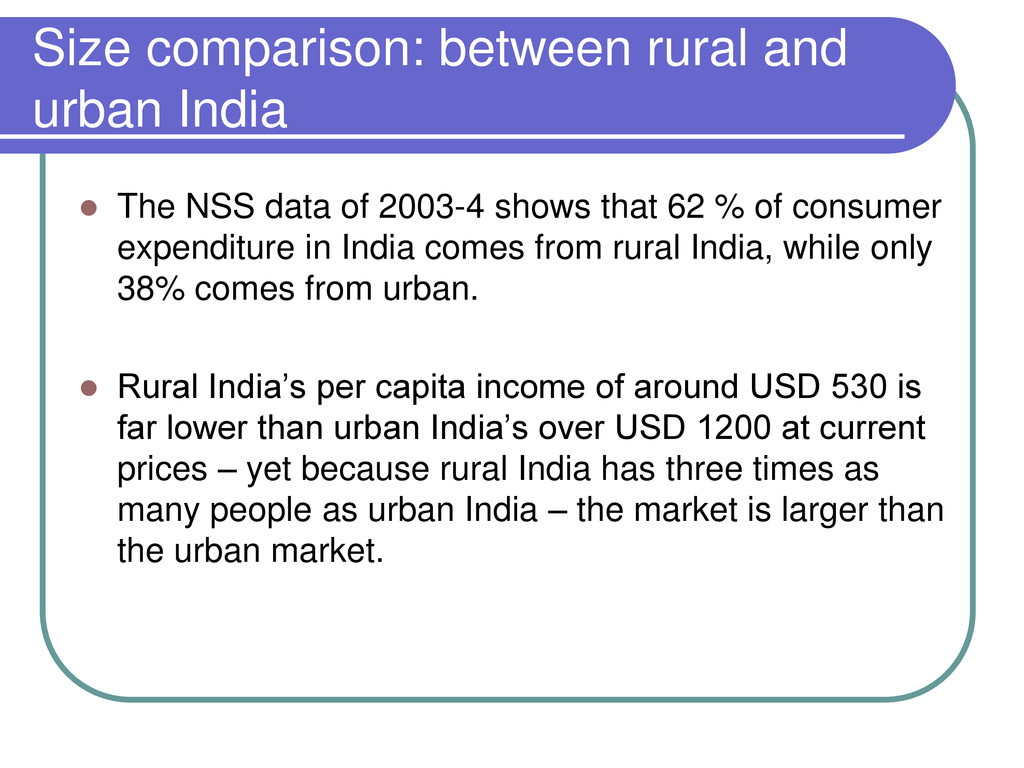
data of 2003-4 shows that 62 % of consumer expenditure in India comes from rural India, while only 38% comes from urban. Rural India’s per capita income of around USD 530 is far lower than urban India’s over USD 1200 at current prices – yet because rural India has three times as many people as urban India – the market is larger than the urban market.
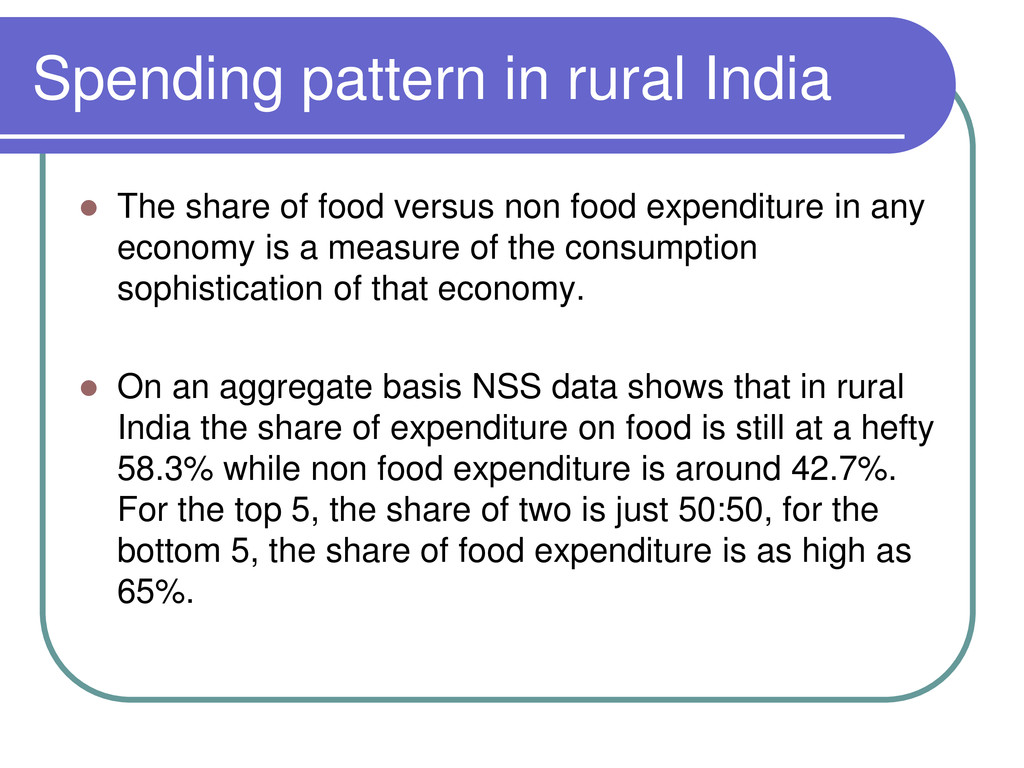
versus non food expenditure in any economy is a measure of the consumption sophistication of that economy. On an aggregate basis NSS data shows that in rural India the share of expenditure on food is still at a hefty 58.3% while non food expenditure is around 42.7%. For the top 5, the share of two is just 50:50, for the bottom 5, the share of food expenditure is as high as 65%.
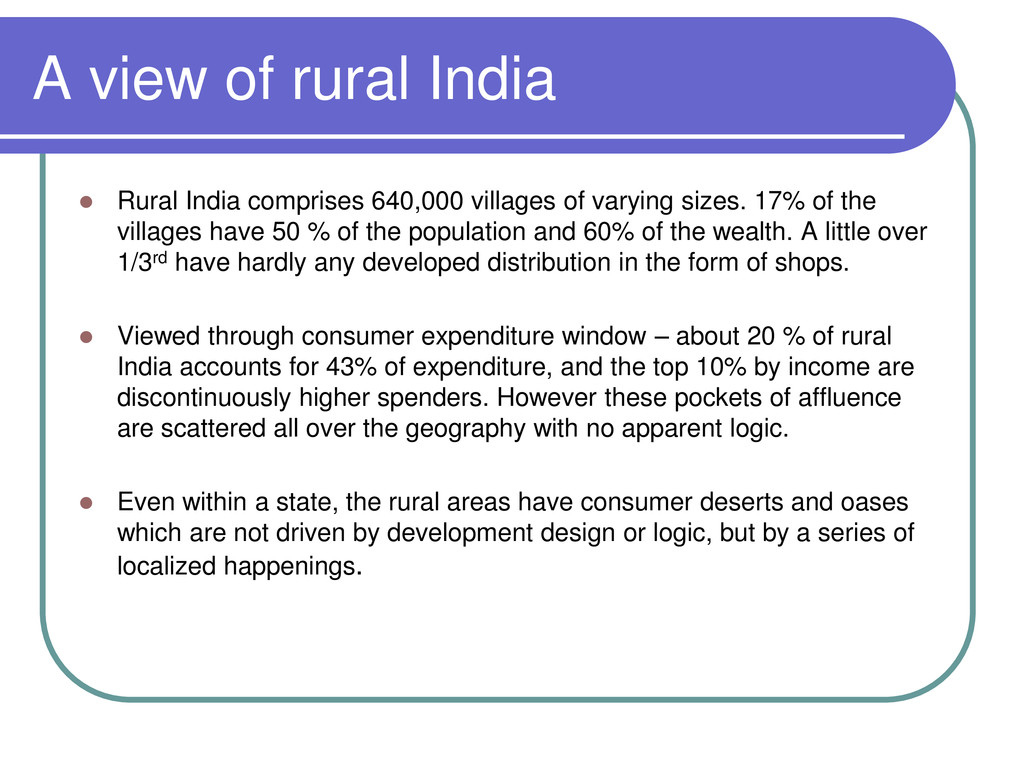
villages of varying sizes. 17% of the villages have 50 % of the population and 60% of the wealth. A little over 1/3rd have hardly any developed distribution in the form of shops. Viewed through consumer expenditure window – about 20 % of rural India accounts for 43% of expenditure, and the top 10% by income are discontinuously higher spenders. However these pockets of affluence are scattered all over the geography with no apparent logic. Even within a state, the rural areas have consumer deserts and oases which are not driven by development design or logic, but by a series of localized happenings.
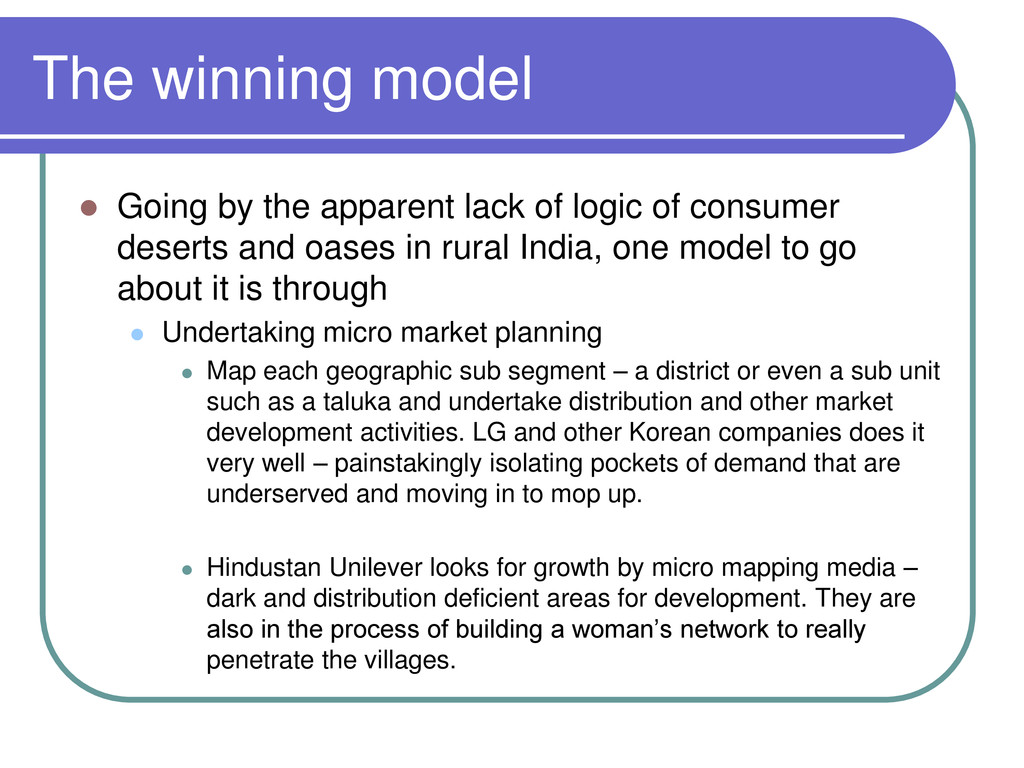
logic of consumer deserts and oases in rural India, one model to go about it is through Undertaking micro market planning Map each geographic sub segment – a district or even a sub unit such as a taluka and undertake distribution and other market development activities. LG and other Korean companies does it very well – painstakingly isolating pockets of demand that are underserved and moving in to mop up. Hindustan Unilever looks for growth by micro mapping media – dark and distribution deficient areas for development. They are also in the process of building a woman’s network to really penetrate the villages.
why would we be concerned about the BOP consumer anyway Large value The size of the BOP market in India is 650 million people who individually earn less than a dollar a day, but collectively account for 30 percent of the national income, and a little over 33 percent of consumption expenditure. According to the prices of 2004-5, this amounts to a market of 650 million people, with an aggregate income of about USD 165 billion and consumption expenditure of about USD 125 billion.
reasonable income in India One US dollar a day per capita per person translates into about Rs.6750/- per month for an average family of five. On a PPP this would convert to a comfortable middle class living with all basic consumer durables and the ability to service a mortgage. Even assuming no conversion to PPP, Rs. 6750/- will buy only shanty dwelling in big cities, but it can buy better living conditions especially in smaller towns. Two months of this salary can buy a good colour television set, five months of this salary can buy a good second hand motorcycle, and half a month’s salary can get a cellphone.
markets in growing economies are very good investments to make because Brand emotions and aspirations that are established when consumers are poor tend to stick as they get richer, provided that relevant product offerings are available. Securing the loyalty of 400 million consumers who are in an economy where real national income doubles every decade – if not earlier, makes for a very good business case for investment.
been perceptible change in the social attitudes of the poor. An indication of this are the changing themes in the Hindi movies – the biggest attitude change has been one from demanding social justice to grabbing economic opportunity. The fear of authority has now been replaced by reducing power distances and the language is one of striving, aspiration an self esteem.
neither resigned, unexposed nor destiny driven. Instead they maximise benefits like any other income group. This is where most of the ‘no frills’ offerings to the poor go wrong. What supplier consider to be a frill, the poor consumers consider to be a necessity. A better wood stove is not good enough in the world of LPG, nor is a black and white television or even a colour one without a remote.
earn more Poor consumers see access to information, knowledge, healthcare, education, transport and communication as the means to earn more. A classic case one of two wheelers in villages – where as availability of public transport increased, the sales of two wheelers also went up. On investigation it was found that the rural consumers had nowhere to go when public transport was not there. However, as it became available, they started doing business outside their village – and the more they started doing that, the more they wanted to go at timings that suited them in order to maximise their productivity.
models Because of limited resources and complicated financial balancing acts the poor people need to do, their financial transactions are lot more complex. They borrow from several sources at several interest rates, kend when needed at different terms depending on the exigencies involves and constantly revolve sources and uses of funds. For something like a cable television – they calculate the value of how much more the family would spend if they had to step out of the house to entertain themselves – especially teenage children who are likely to spend more.
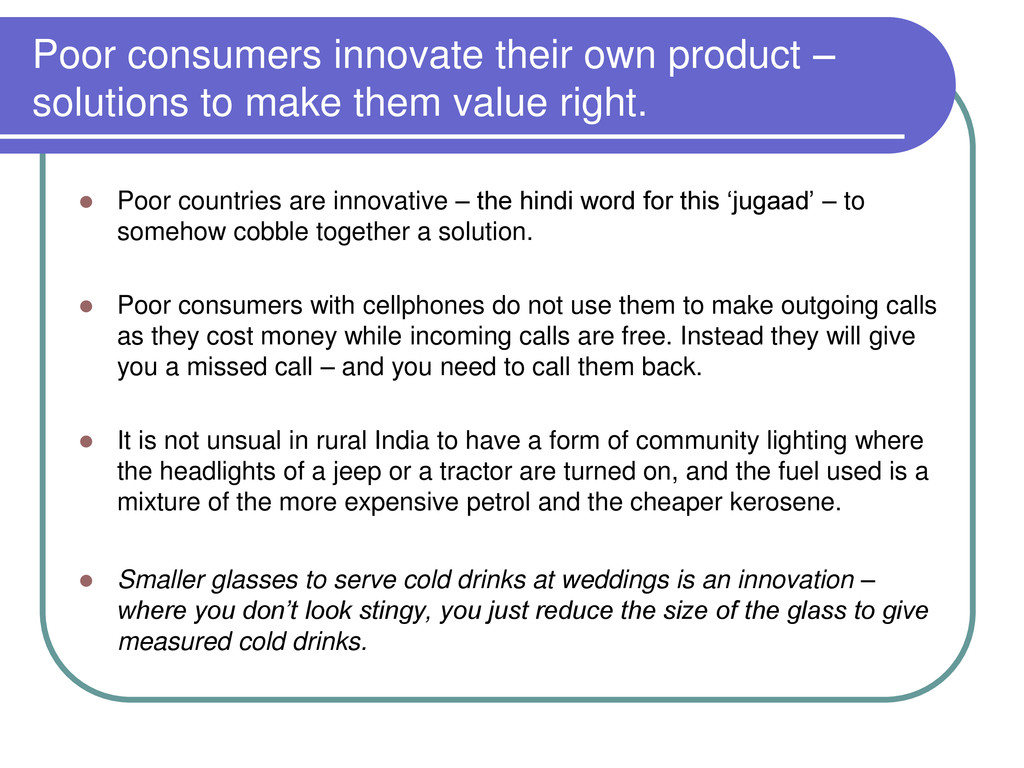
them value right. Poor countries are innovative – the hindi word for this ‘jugaad’ – to somehow cobble together a solution. Poor consumers with cellphones do not use them to make outgoing calls as they cost money while incoming calls are free. Instead they will give you a missed call – and you need to call them back. It is not unsual in rural India to have a form of community lighting where the headlights of a jeep or a tractor are turned on, and the fuel used is a mixture of the more expensive petrol and the cheaper kerosene. Smaller glasses to serve cold drinks at weddings is an innovation – where you don’t look stingy, you just reduce the size of the glass to give measured cold drinks.
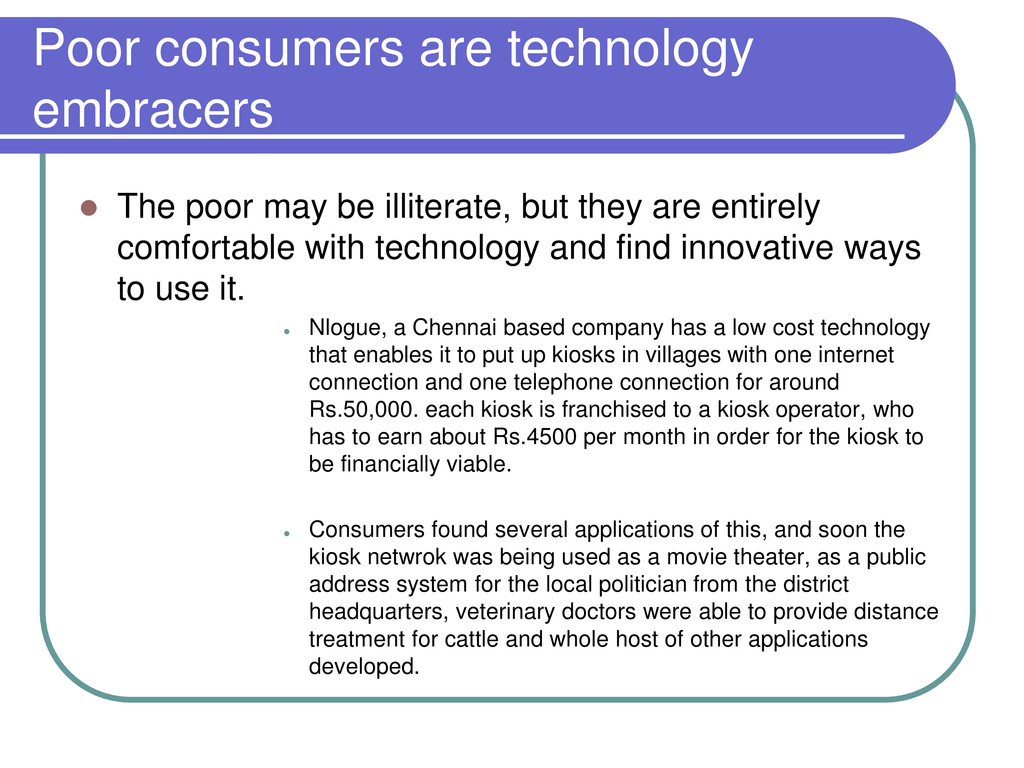
illiterate, but they are entirely comfortable with technology and find innovative ways to use it. Nlogue, a Chennai based company has a low cost technology that enables it to put up kiosks in villages with one internet connection and one telephone connection for around Rs.50,000. each kiosk is franchised to a kiosk operator, who has to earn about Rs.4500 per month in order for the kiosk to be financially viable. Consumers found several applications of this, and soon the kiosk netwrok was being used as a movie theater, as a public address system for the local politician from the district headquarters, veterinary doctors were able to provide distance treatment for cattle and whole host of other applications developed.
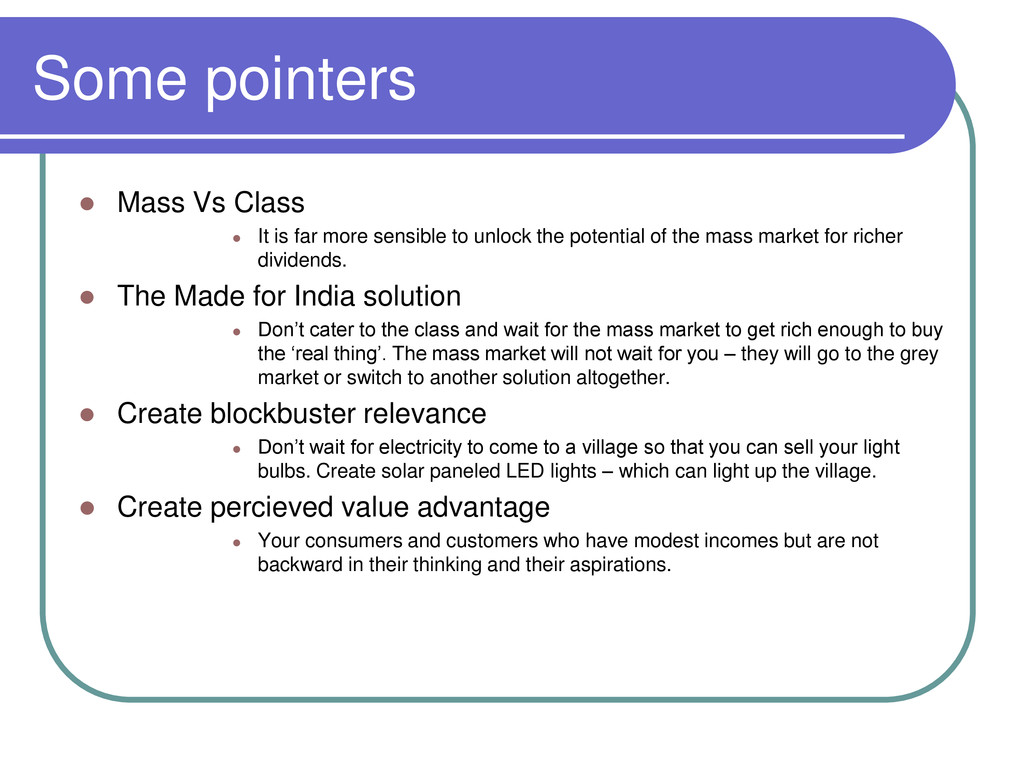
more sensible to unlock the potential of the mass market for richer dividends. The Made for India solution Don’t cater to the class and wait for the mass market to get rich enough to buy the ‘real thing’. The mass market will not wait for you – they will go to the grey market or switch to another solution altogether. Create blockbuster relevance Don’t wait for electricity to come to a village so that you can sell your light bulbs. Create solar paneled LED lights – which can light up the village. Create percieved value advantage Your consumers and customers who have modest incomes but are not backward in their thinking and their aspirations.
the developed markets It has a consumer base which expects high functionality at low cost A patchy ecosystem where all elements of what is needed to support a business are not equally well developed.