of information technology on commuting “. . . we shall endeavour to spread the bread thin on the butter-to make what work there is still to be done to be as widely shared as possible. Three-hour shifts or a fifteen-hour week may put off the problem for a great while. (Keynes, 1930)” Information technology has large impact on the labor market We consider adoption of information technology (telecommuting) on average commuting distances
Better work-life balance, higher productivity, lower (external) costs of commute. Great! Governments promote telework (e.g., US Telework Enhancement Act of 2010) But economic theory predicts longer commute. More congestion, pollution, noise. Not good! See, among others, Lund and Mokhtarian (1994), Safirova (2002), Rhee (2008) and Glaeser (2008, p. 41)
paper The problem Teleworkers commute longer In the Netherlands in 2010 teleworkers commuted on average 50 percent longer distances than non-teleworkers But it is causal? Teleworkers have strongers incentives to have a longer commute (e.g., better housing) Employees from far away have stronger incentives to telework (e.g., lower travel costs)
paper What we do (in a nut-shell) We look at the long-run causal effect of teleworking adoption on commuting distances within professions we do so by comparing treated and non-treated professions in 1996 with the same professions in 2010 1 If relative increase within treated professions: causal effect 2 If no relative increase within treated professions: sorting effect for possible sorting of individuals into different types of professions we apply an individual matching procedure
paper Our main conclusion We find no long-run relative effect of the adoption of telecommuting within professions on commuting distance not in total and not by sectors So, given that teleworkers themselves have longer commutes: No causal effect of teleworking on commuting distance But strong sorting effect of workers with long commutes into teleworking
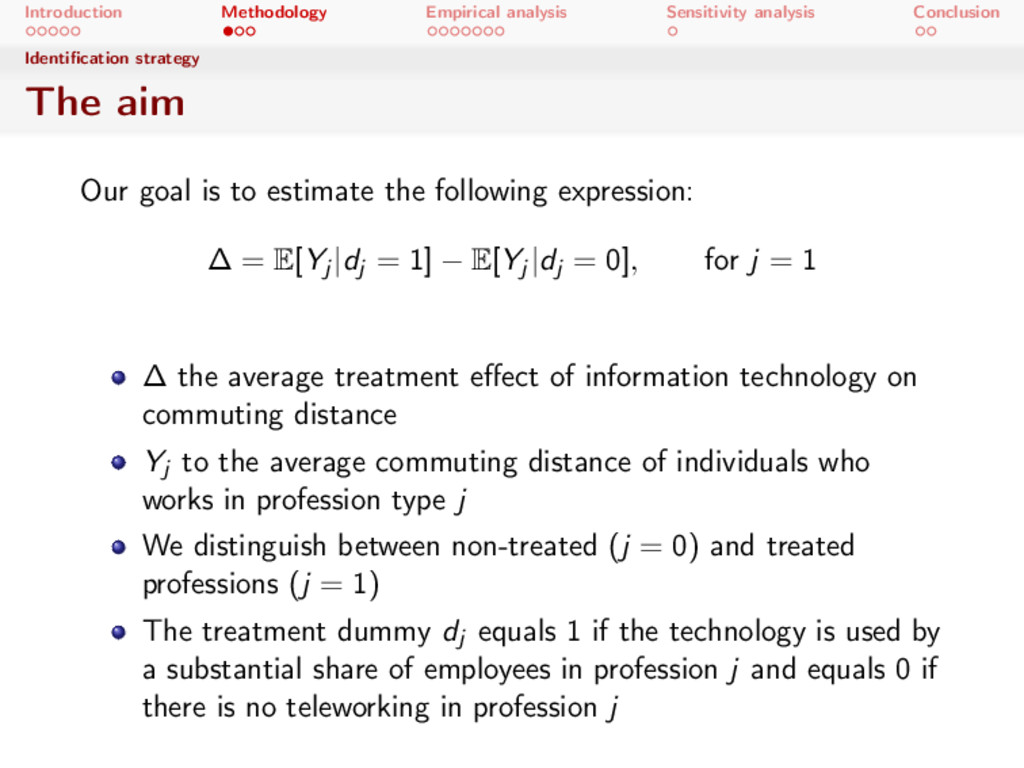
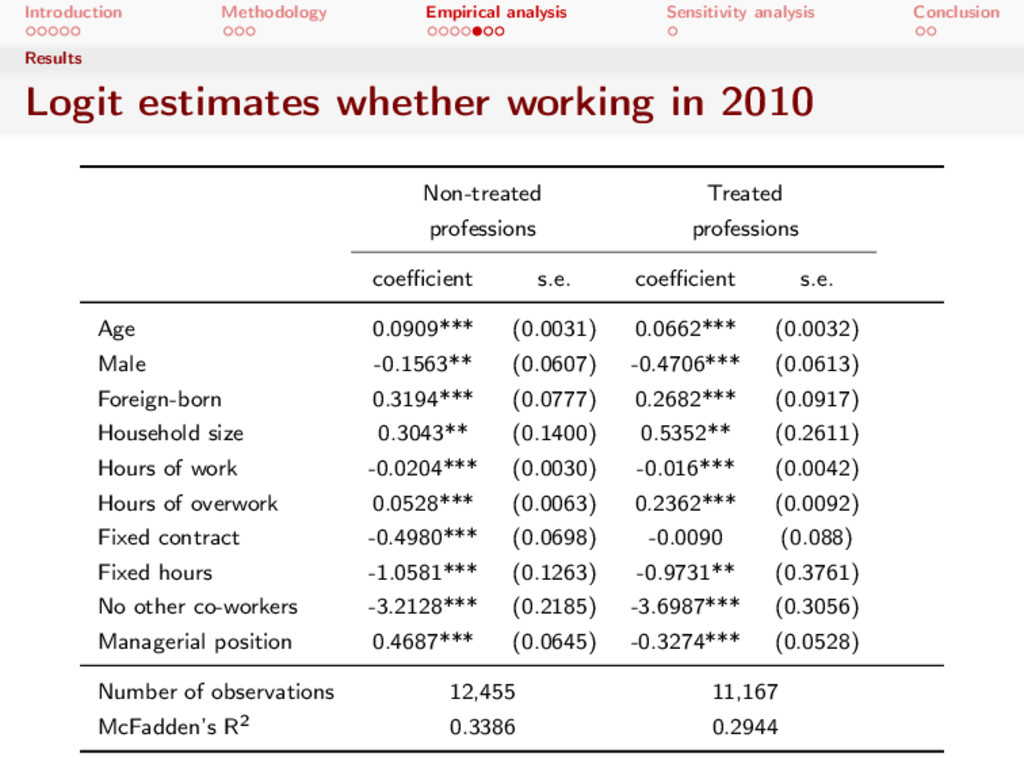
aim Our goal is to estimate the following expression: ∆ = E[Yj |dj = 1] − E[Yj |dj = 0], for j = 1 ∆ the average treatment effect of information technology on commuting distance Yj to the average commuting distance of individuals who works in profession type j We distinguish between non-treated (j = 0) and treated professions (j = 1) The treatment dummy dj equals 1 if the technology is used by a substantial share of employees in profession j and equals 0 if there is no teleworking in profession j
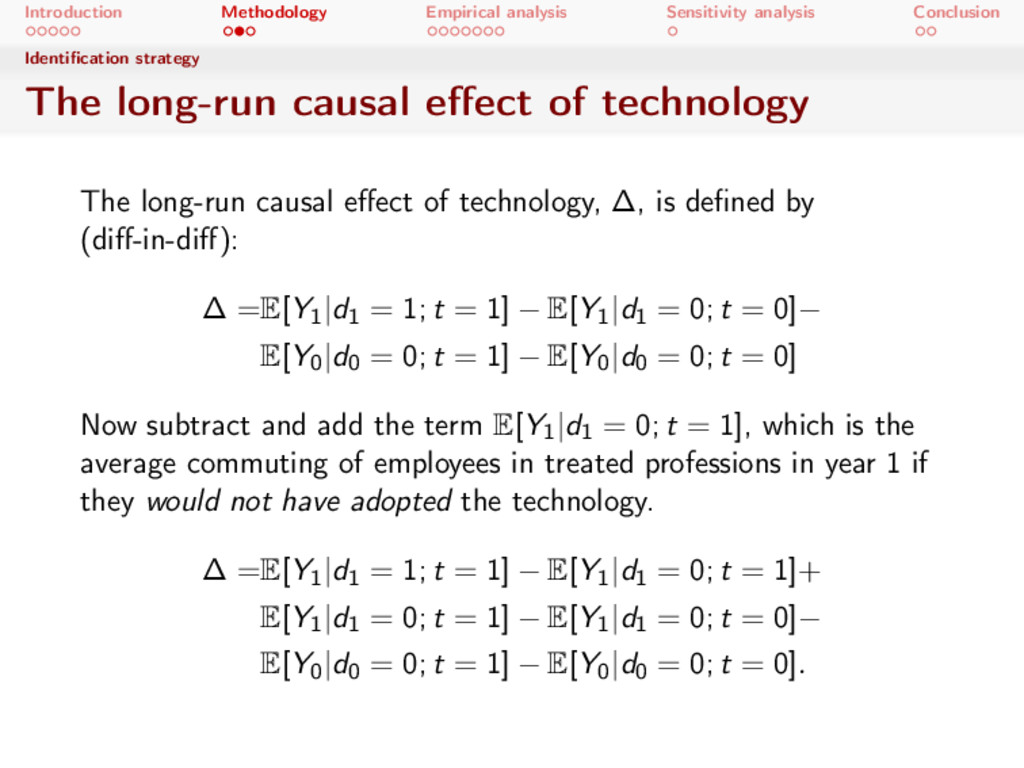
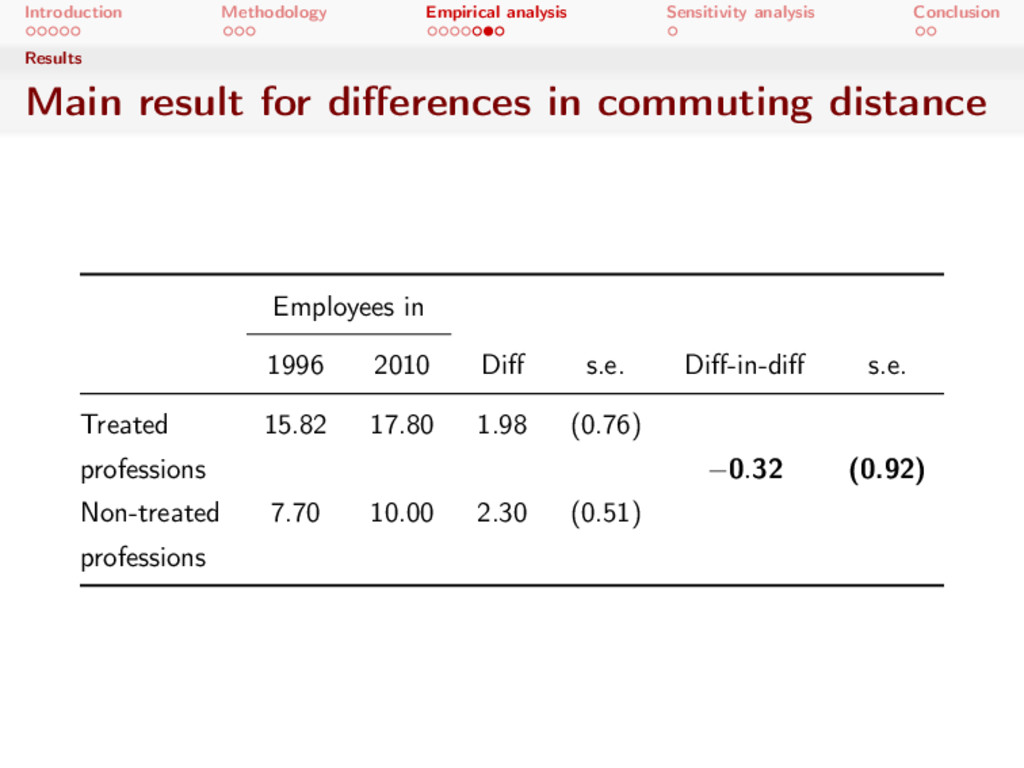
long-run causal effect of technology The long-run causal effect of technology, ∆, is defined by (diff-in-diff): ∆ =E[Y1|d1 = 1; t = 1] − E[Y1|d1 = 0; t = 0]− E[Y0|d0 = 0; t = 1] − E[Y0|d0 = 0; t = 0] Now subtract and add the term E[Y1|d1 = 0; t = 1], which is the average commuting of employees in treated professions in year 1 if they would not have adopted the technology. ∆ =E[Y1|d1 = 1; t = 1] − E[Y1|d1 = 0; t = 1]+ E[Y1|d1 = 0; t = 1] − E[Y1|d1 = 0; t = 0]− E[Y0|d0 = 0; t = 1] − E[Y0|d0 = 0; t = 0].
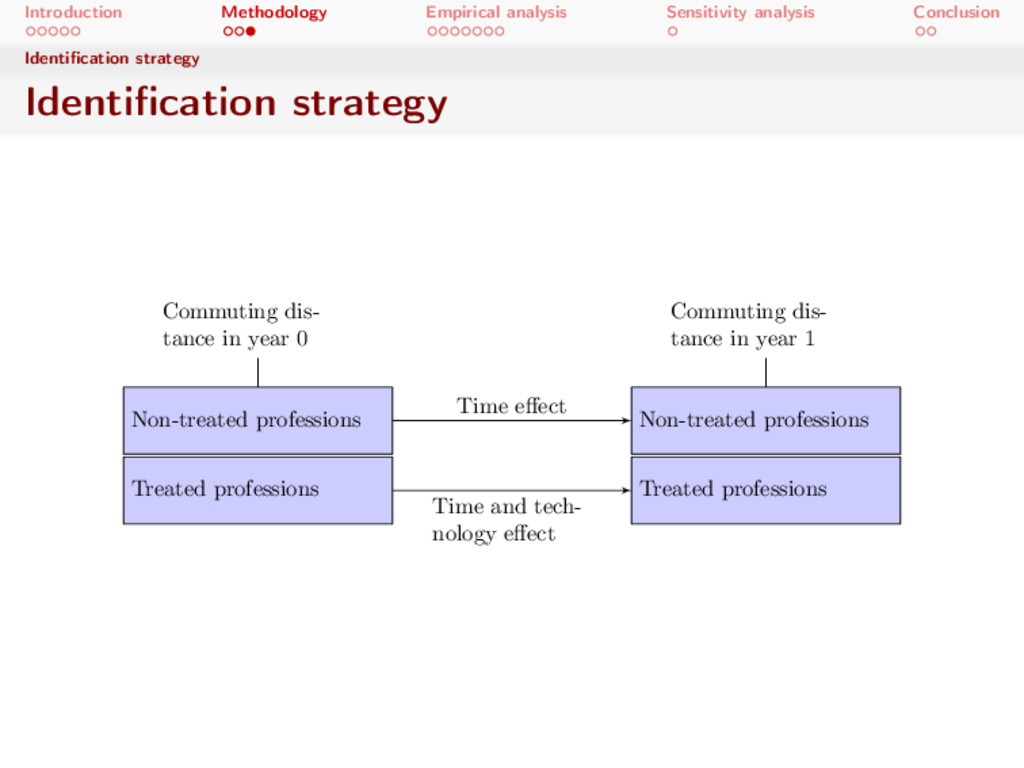
strategy Non-treated professions Commuting dis- tance in year 0 Treated professions Non-treated professions Commuting dis- tance in year 1 Treated professions Time effect Time and tech- nology effect
Cross-sectional Labor Force Surveys for 1996 and 2010, plus Job Location Database 2 “Waar werkt u in deze werkkring doorgaans?” (“Where do you usually work on this job?”) 3 Distance between centroids of municipalities
observations in both 1996 and 2010 1,065 employees telework in 2010 Average commuting distances for non-teleworkers are 10.1 km (in 1996) and 12.4 km (in 2010) Average commuting distance for teleworkers is 21 km (irrespective of profession)
is an interaction term of a job and an industry (more thatn 400 professions) In non-teleworking professions nobody teleworks In teleworking professions more than 10 percent of employees telework
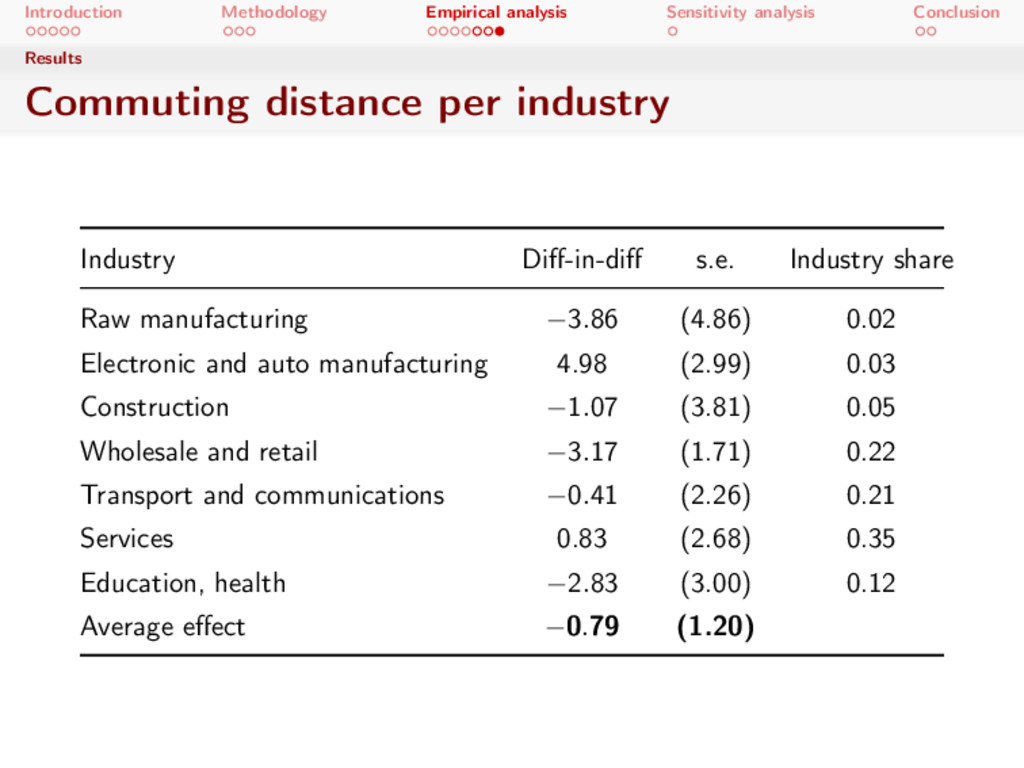
per industry Industry Diff-in-diff s.e. Industry share Raw manufacturing −3.86 (4.86) 0.02 Electronic and auto manufacturing 4.98 (2.99) 0.03 Construction −1.07 (3.81) 0.05 Wholesale and retail −3.17 (1.71) 0.22 Transport and communications −0.41 (2.26) 0.21 Services 0.83 (2.68) 0.35 Education, health −2.83 (3.00) 0.12 Average effect −0.79 (1.20)
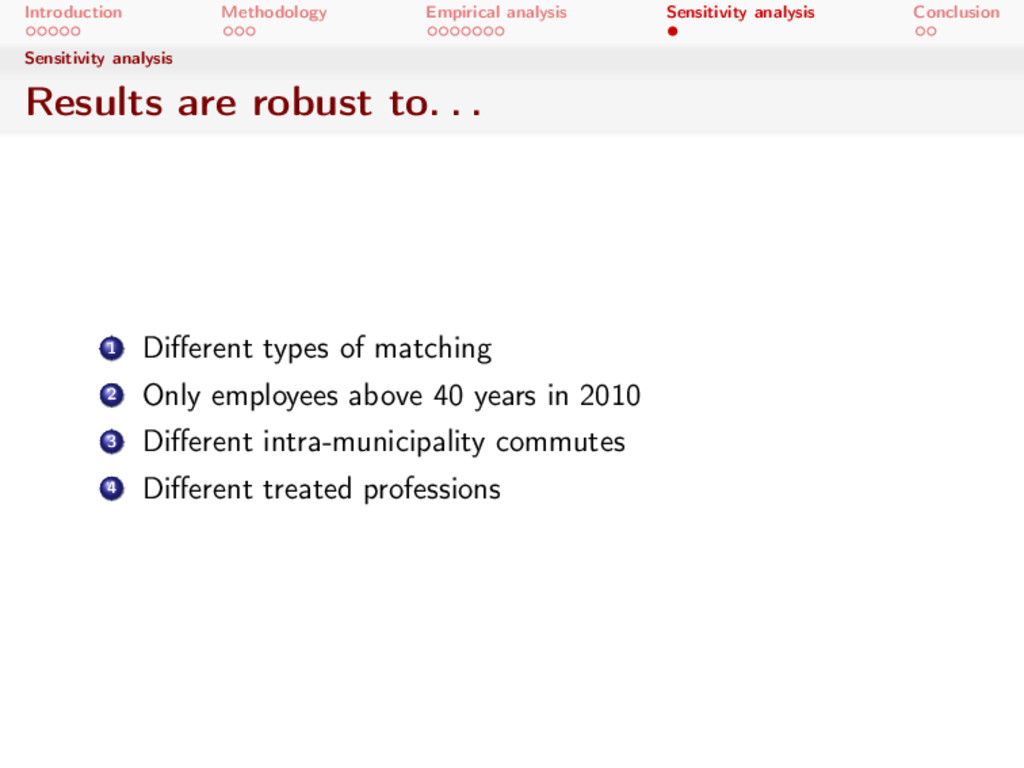
are robust to. . . 1 Different types of matching 2 Only employees above 40 years in 2010 3 Different intra-municipality commutes 4 Different treated professions
We found no long-run causal effect of telecommuting on commuting distance but a strong sorting effect Possible alternative explanations Teleworking is still marginal Violation of common time trend assumption Workers in treated professions got stronger city preferences Firms in treated professions have changed location Urbanisaton patterns of both profession types have changed over time similarly So, the total impact of information technology on the spatial structure of the labor market remains marginal at best For policy recommendations dual message Information technology itself does not seem to have affected aggregate commuting distance, but strongly subsidizing teleworking could increase aggregate commuting distance