heterogeneity and robustness of determinants of European regional growth Thomas de Graaff Department of spatial economics, Vrije Universiteit Amsterdam http://www.spatialeconomics.nl http://www.thomasdegraaff.nl/ Netherlands Environmental Assessment Agency http://www.pbl.nl/ May 30, 2018
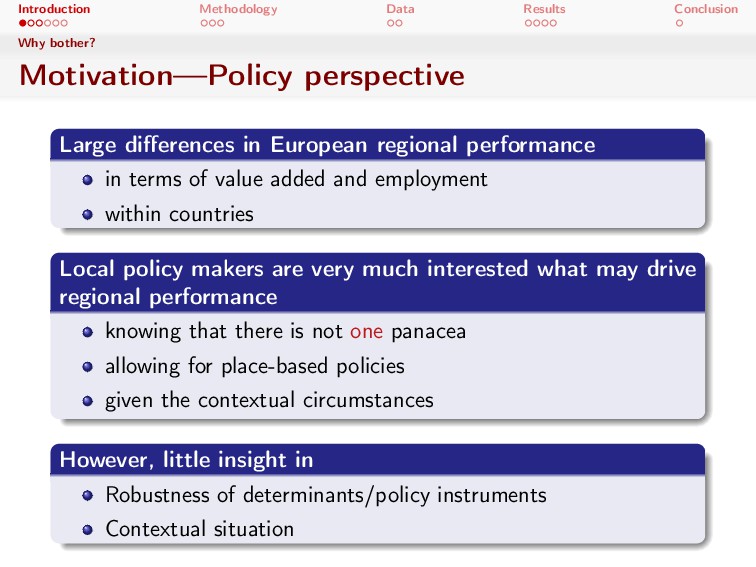
differences in European regional performance in terms of value added and employment within countries Local policy makers are very much interested what may drive regional performance knowing that there is not one panacea allowing for place-based policies given the contextual circumstances However, little insight in Robustness of determinants/policy instruments Contextual situation
empirical literature using regional growth regressions (conform the macro “Barro-regressions”) Plethora of specifications (“Testing withouth theorizing”) Econometric problems How much confidence can one have in these emprical results?
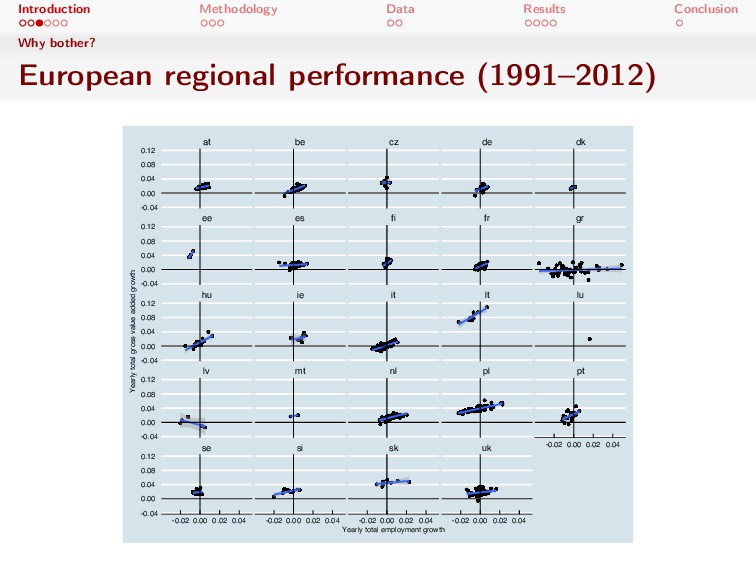
(1991–2012) se si sk uk lv mt nl pl pt hu ie it lt lu ee es fi fr gr at be cz de dk -0.02 0.00 0.02 0.04 -0.02 0.00 0.02 0.04 -0.02 0.00 0.02 0.04 -0.02 0.00 0.02 0.04 -0.02 0.00 0.02 0.04 -0.04 0.00 0.04 0.08 0.12 -0.04 0.00 0.04 0.08 0.12 -0.04 0.00 0.04 0.08 0.12 -0.04 0.00 0.04 0.08 0.12 -0.04 0.00 0.04 0.08 0.12 Yearly total employment growth Yearly total gross value added growth
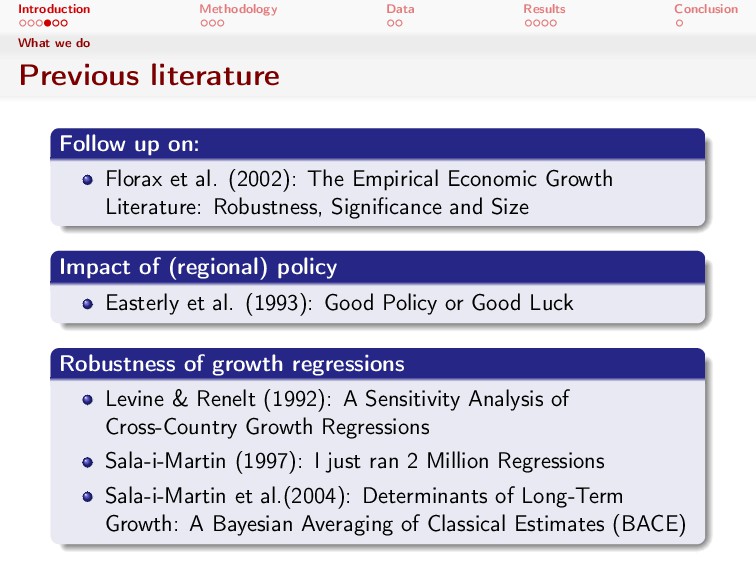
Follow up on: Florax et al. (2002): The Empirical Economic Growth Literature: Robustness, Significance and Size Impact of (regional) policy Easterly et al. (1993): Good Policy or Good Luck Robustness of growth regressions Levine & Renelt (1992): A Sensitivity Analysis of Cross-Country Growth Regressions Sala-i-Martin (1997): I just ran 2 Million Regressions Sala-i-Martin et al.(2004): Determinants of Long-Term Growth: A Bayesian Averaging of Classical Estimates (BACE)
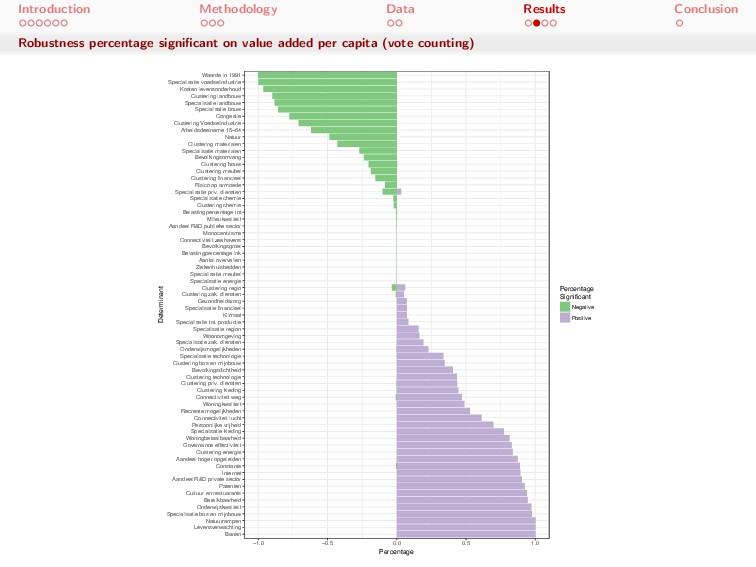
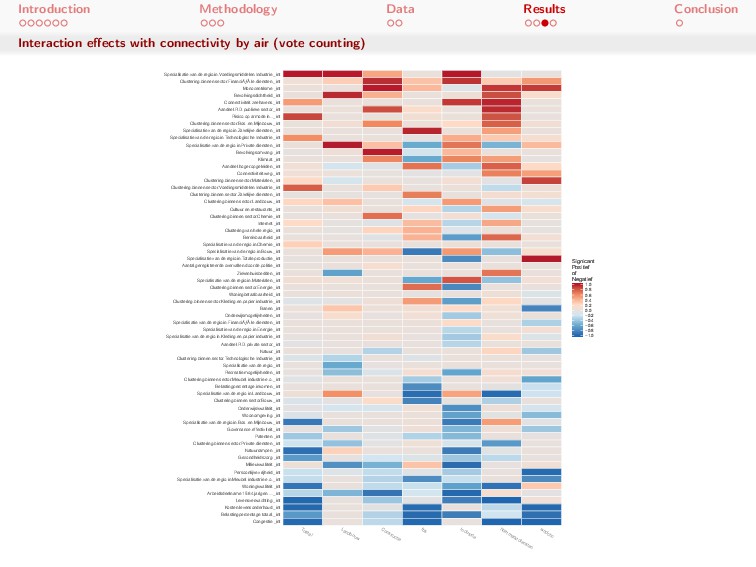
We provide a general view on the robustness of what works by performing a robustness analysis of regional growth regressions for value added growth per capita and employment growth per capita for various sectors using over more than 60 candidate determinants We look into the impact of contextual variables by looking at interaction terms spatial variation
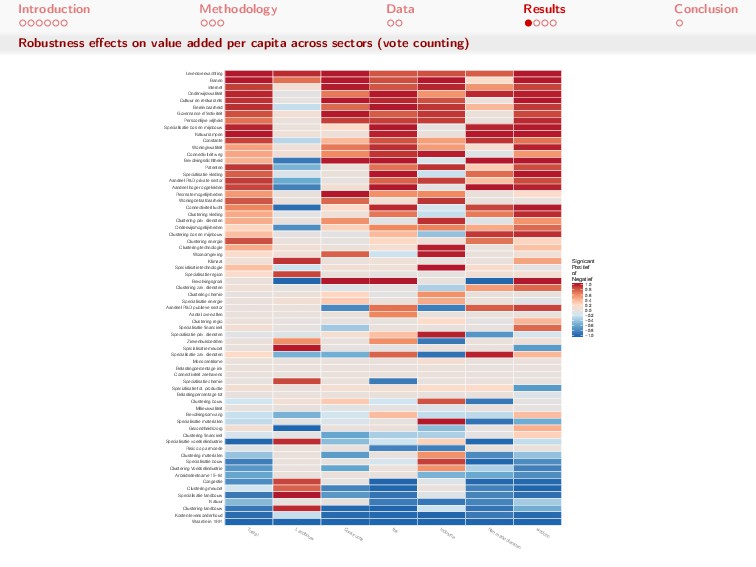
Not many indicators are robust especially policy related indicators Some contextual variables are robust governance indicator important Moreover accessibility and R&D related indicators context and region specific
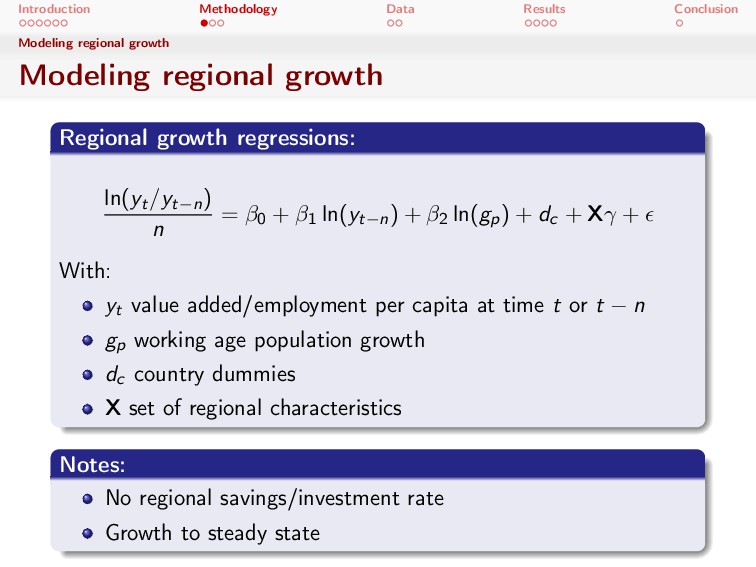
growth Regional growth regressions: ln(yt/yt−n) n = β0 + β1 ln(yt−n) + β2 ln(gp) + dc + Xγ + With: yt value added/employment per capita at time t or t − n gp working age population growth dc country dummies X set of regional characteristics Notes: No regional savings/investment rate Growth to steady state
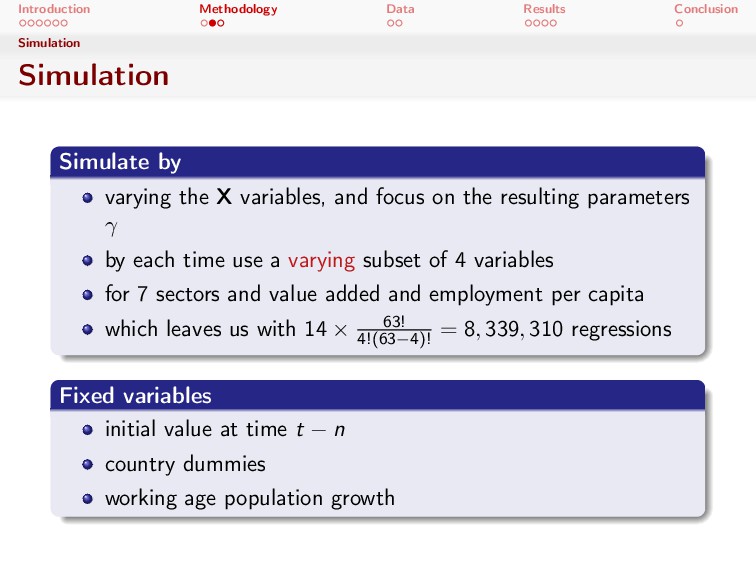
the X variables, and focus on the resulting parameters γ by each time use a varying subset of 4 variables for 7 sectors and value added and employment per capita which leaves us with 14 × 63! 4!(63−4)! = 8, 339, 310 regressions Fixed variables initial value at time t − n country dummies working age population growth
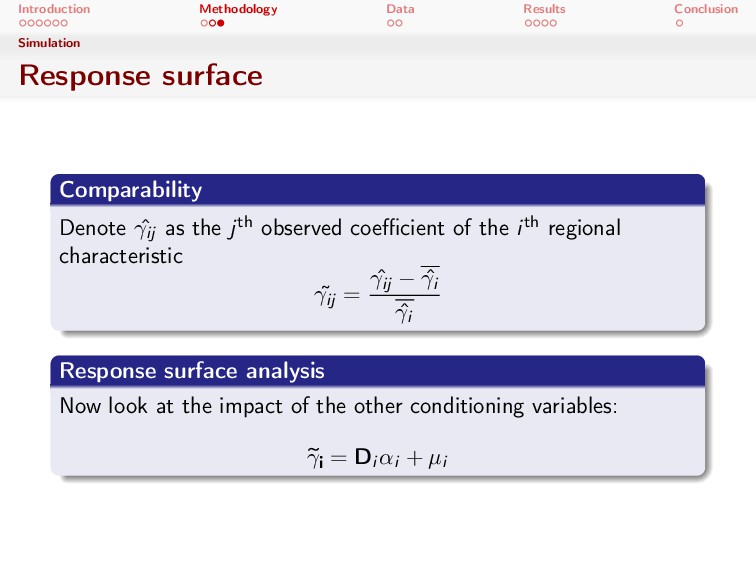
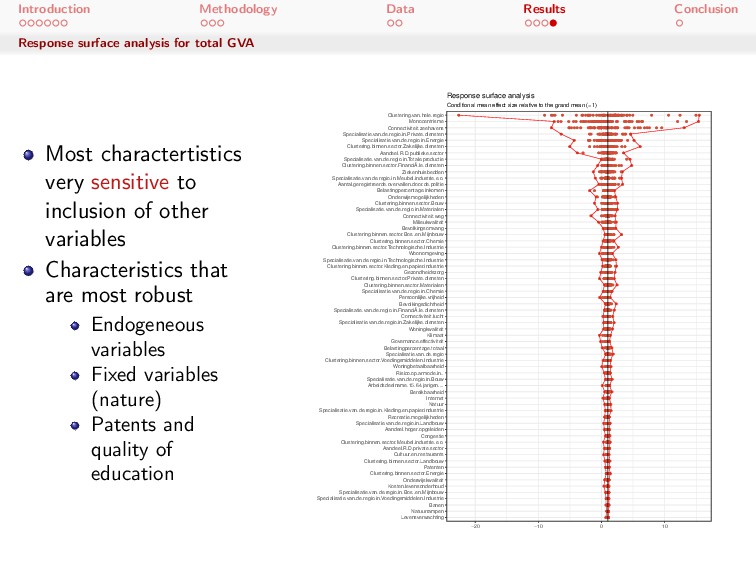
ˆ γij as the jth observed coefficient of the ith regional characteristic ˜ γij = ˆ γij − ˆ γi ˆ γi Response surface analysis Now look at the impact of the other conditioning variables: ~ γi = Di αi + µi
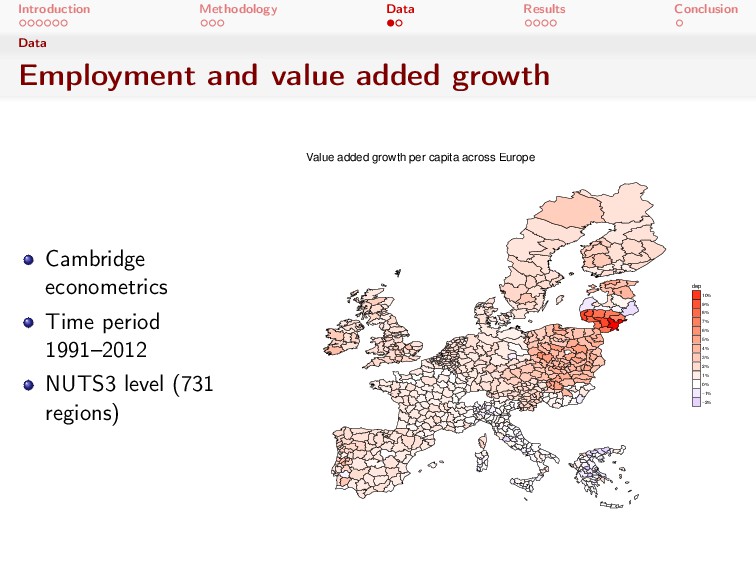
growth Cambridge econometrics Time period 1991–2012 NUTS3 level (731 regions) dep 10% 9% 8% 7% 6% 5% 4% 3% 2% 1% 0% −1% −2% Value added growth per capita across Europe
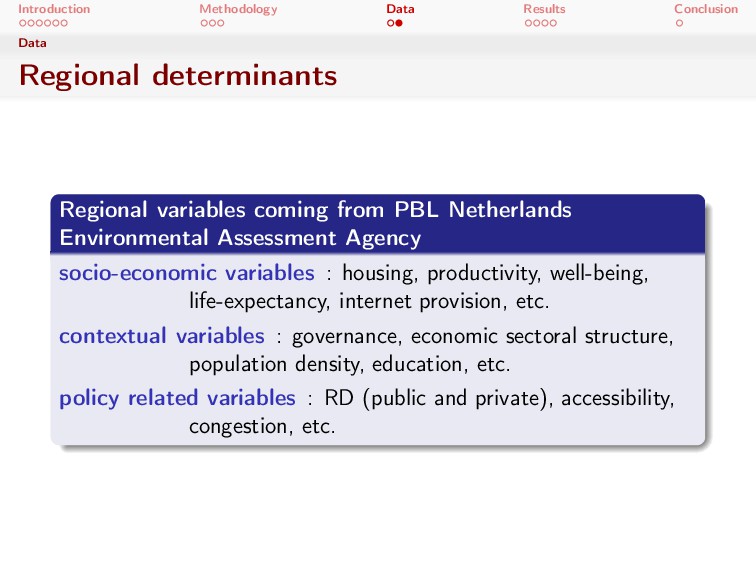
coming from PBL Netherlands Environmental Assessment Agency socio-economic variables : housing, productivity, well-being, life-expectancy, internet provision, etc. contextual variables : governance, economic sectoral structure, population density, education, etc. policy related variables : RD (public and private), accessibility, congestion, etc.
regional economic performance Not many indicators very robust in explaining Pointing at path dependency (“luck”) Large role of context In the presence of other characteristics Spatially