Upgrade to Pro
— share decks privately, control downloads, hide ads and more …
Speaker Deck
Features
Speaker Deck
PRO
Sign in
Sign up for free
Search
Search
SVG + D3.JS Course Slide
Search
Sponsored
·
Your Podcast. Everywhere. Effortlessly.
Share. Educate. Inspire. Entertain. You do you. We'll handle the rest.
→
tkirby
May 28, 2015
Education
290
0
Share
Embed
Copy iframe code
Copy JS code
Copy link
Start on current slide
SVG + D3.JS Course Slide
tkirby
May 28, 2015
More Decks by tkirby
See All by tkirby
前端網頁資料視覺化設計
tkirby
1
630
Theory of Graphical Perception
tkirby
0
660
Open Refine Course
tkirby
0
280
Language Reference
tkirby
0
140
新聞記者的程式設計第一課
tkirby
0
610
Visualization over Web
tkirby
0
170
迎戰壞資料 @ dbootcamp Taipei
tkirby
0
840
Rasterize D3.js
tkirby
7
1.8k
資料新聞學手冊導讀
tkirby
0
330
Other Decks in Education
See All in Education
自己紹介 / who-am-i
yasulab
6
7k
AI-Based Speaking Assessment of a Short-Term Study Abroad Program
uranoken
0
370
[2026前期火5] 論理学(京都大学文学部 前期 第8回)「正規化定理の証明」
yatabe
0
230
モブ社員がモブエンジニアを名乗って得られたこと_20260413
masakiokuda
4
560
Case Studies - Lecture 12 - Information Visualisation (4019538FNR)
signer
PRO
0
180
輻射安全管理系統2.0暨輻防e++學園平台說明會
aecrp
0
1.8k
2026年度春学期 統計学 第6回 データの関係を知る(1)ー 相関関係 (2026. 5. 14)
akiraasano
PRO
0
180
Visionary Initiative: Future Intelligence — Laying the foundations for the future of science, intelligence, and society | Science Tokyo
sciencetokyo
PRO
0
140
[2026前期火5] 論理学(京都大学文学部 前期 第4回)「 ならば(→)の導入と証明ネット」
yatabe
0
510
Soluciones al examen de Geografía 2026. JUNIO (Convocatoria Ordinaria)
juanmartin2026
1
6.2k
Lectura 2 (PIT : Python Basico)
robintux
0
380
JAWS-UG初心者支部#81 GWにEduJAWSと何か作ろうもくもく会!
otsuki
0
150
Featured
See All Featured
エンジニアに許された特別な時間の終わり
watany
108
250k
More Than Pixels: Becoming A User Experience Designer
marktimemedia
3
460
Ecommerce SEO: The Keys for Success Now & Beyond - #SERPConf2024
aleyda
1
2.1k
Building AI with AI
inesmontani
PRO
1
1.1k
BBQ
matthewcrist
89
10k
Designing Experiences People Love
moore
143
24k
Deep Space Network (abreviated)
tonyrice
0
230
A Tale of Four Properties
chriscoyier
163
24k
Why You Should Never Use an ORM
jnunemaker
PRO
61
9.9k
XXLCSS - How to scale CSS and keep your sanity
sugarenia
249
1.3M
The Art of Delivering Value - GDevCon NA Keynote
reverentgeek
16
2k
Exploring the relationship between traditional SERPs and Gen AI search
raygrieselhuber
PRO
2
4.1k
Transcript
Visualization over Web
HTML <a href=“link”>content</a> <img src=“blah.png”> <br> <a href=“link”> this link
</a> links to a page <br> <p><a href=“link”> this link </a> links to a page </p>
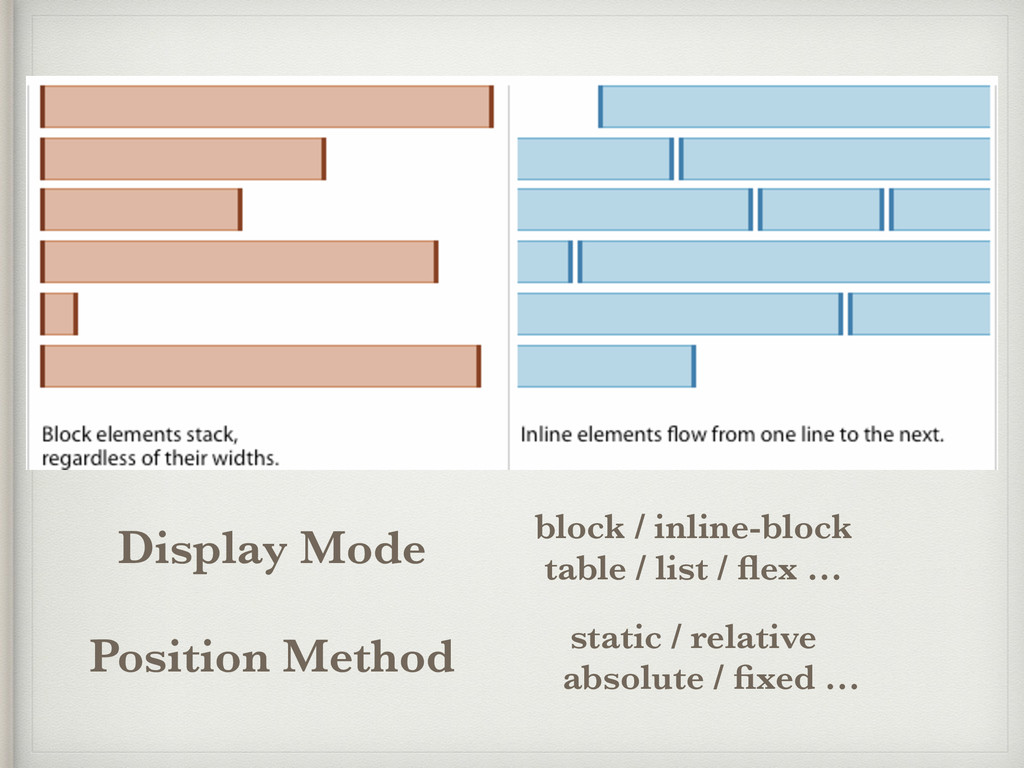
block / inline-block table / list / flex … static
/ relative absolute / fixed … Display Mode Position Method
None
Scalable Vector Graphics SVG
<p> <svg> … </svg> </p>
<svg> <rect x=“10” y=“10” width=“20” height=“20”> </svg>
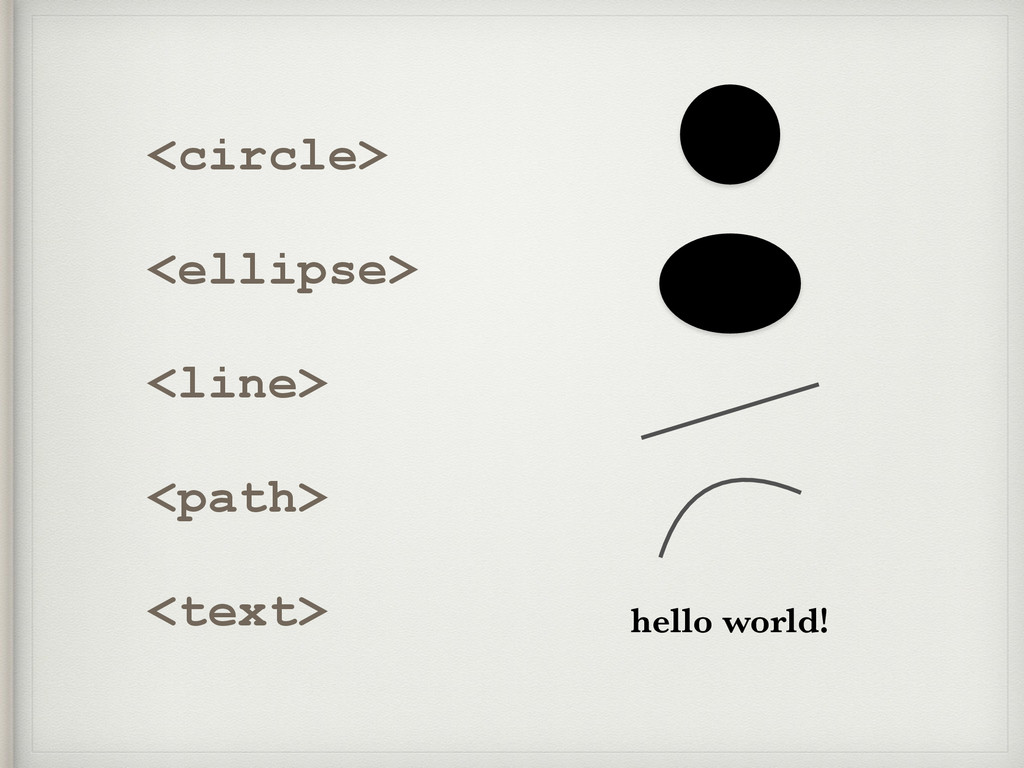
<circle> <ellipse> <line> <path> <text> hello world!
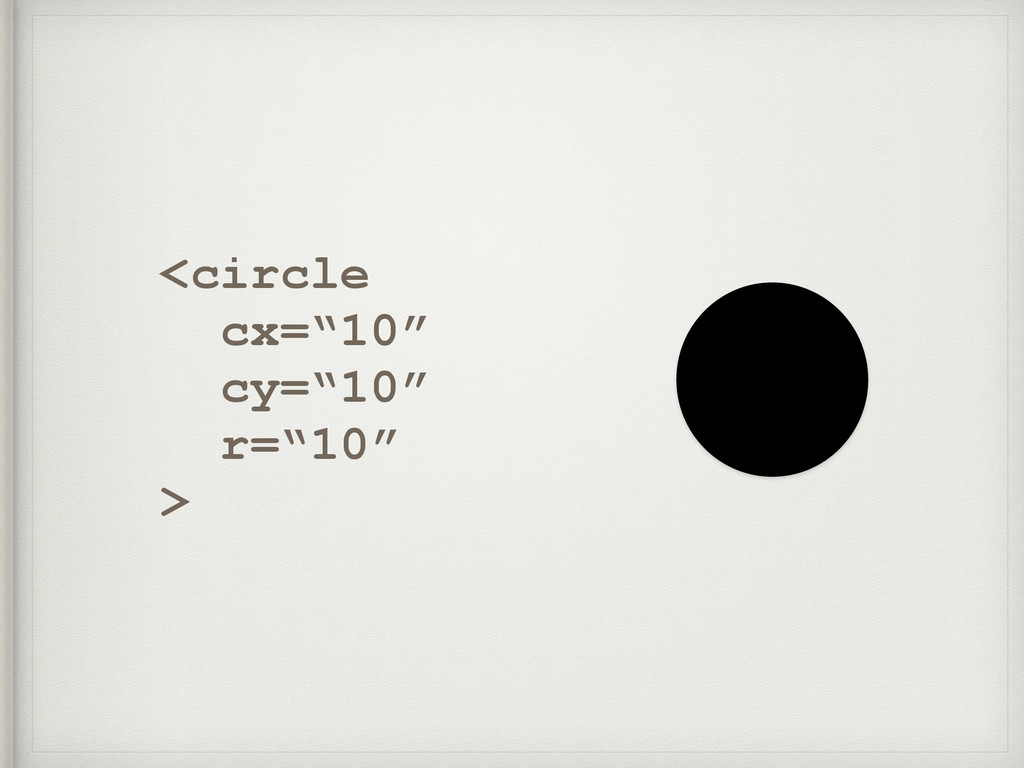
<circle cx=“10” cy=“10” r=“10” >
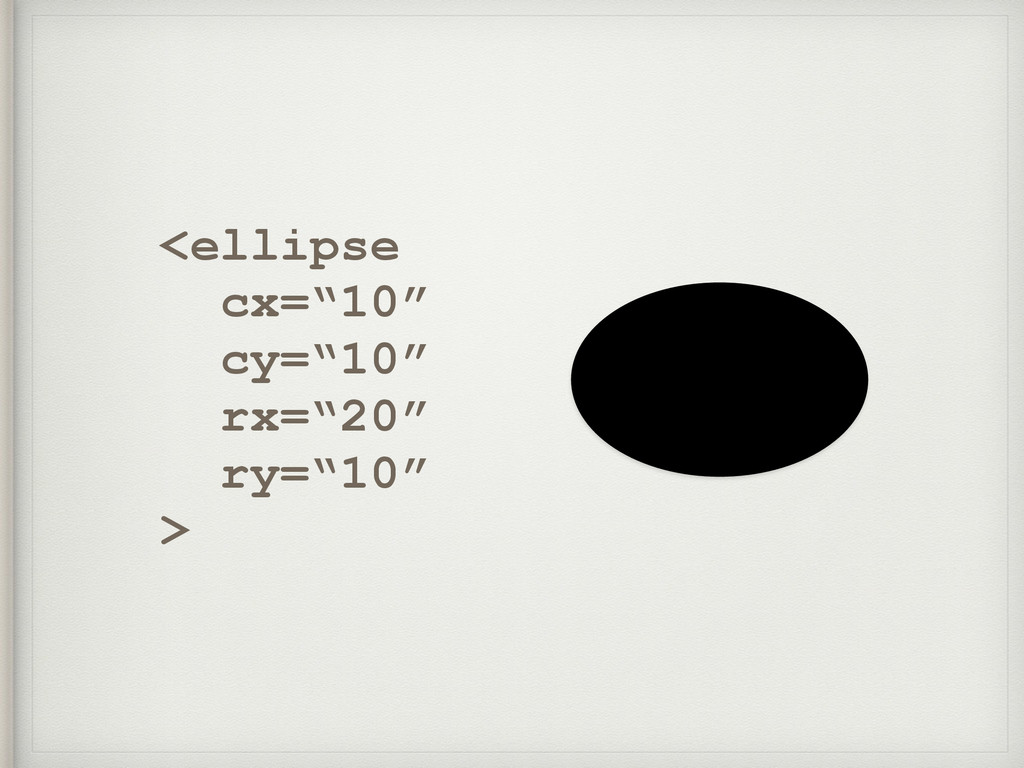
<ellipse cx=“10” cy=“10” rx=“20” ry=“10” >
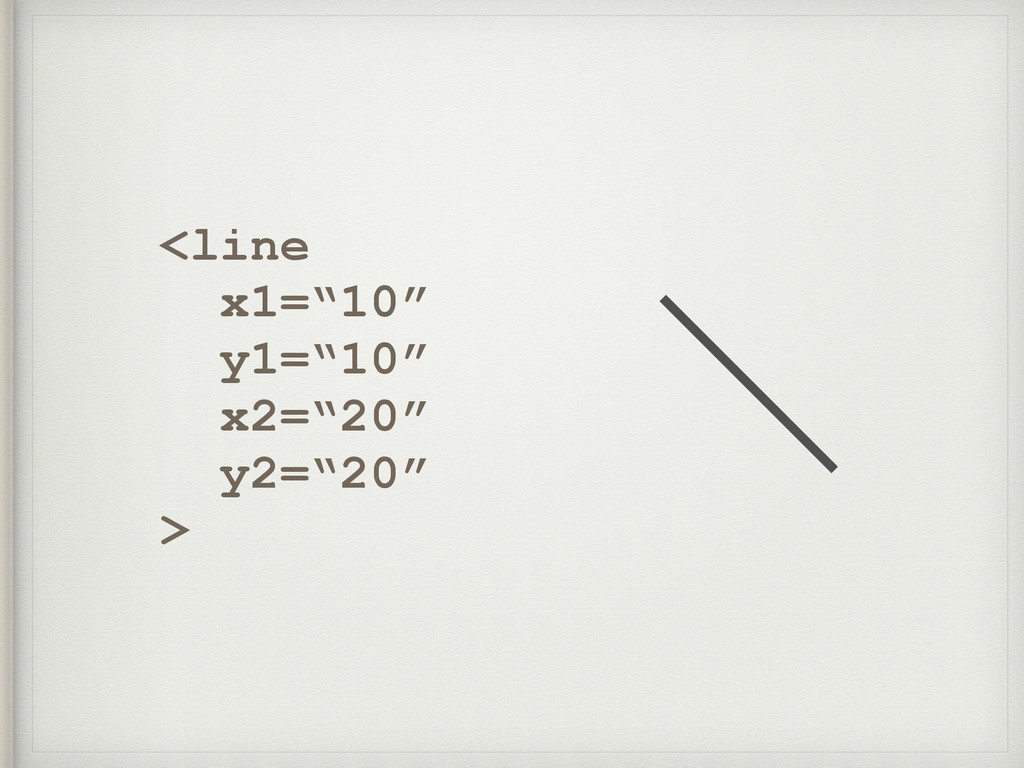
<line x1=“10” y1=“10” x2=“20” y2=“20” >
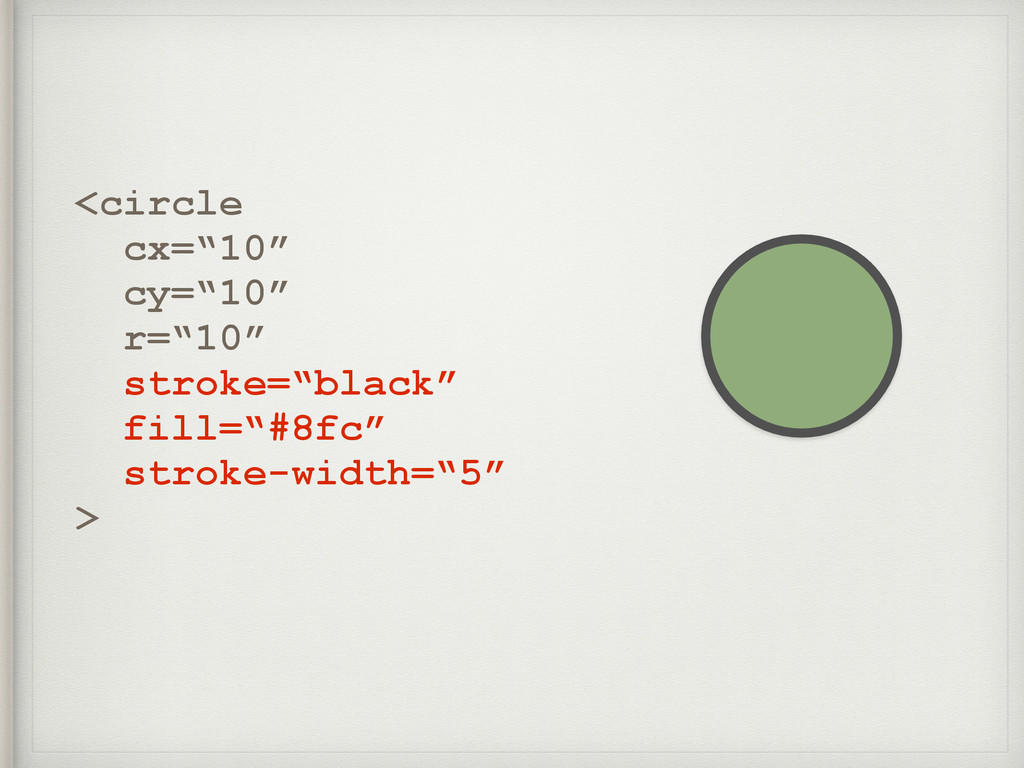
<circle cx=“10” cy=“10” r=“10” stroke=“color” fill=“color” stroke-width=“size” >
None
#abcdef RG B 0 ~ 255 = 0 ~ ff
#adf = #aaddff
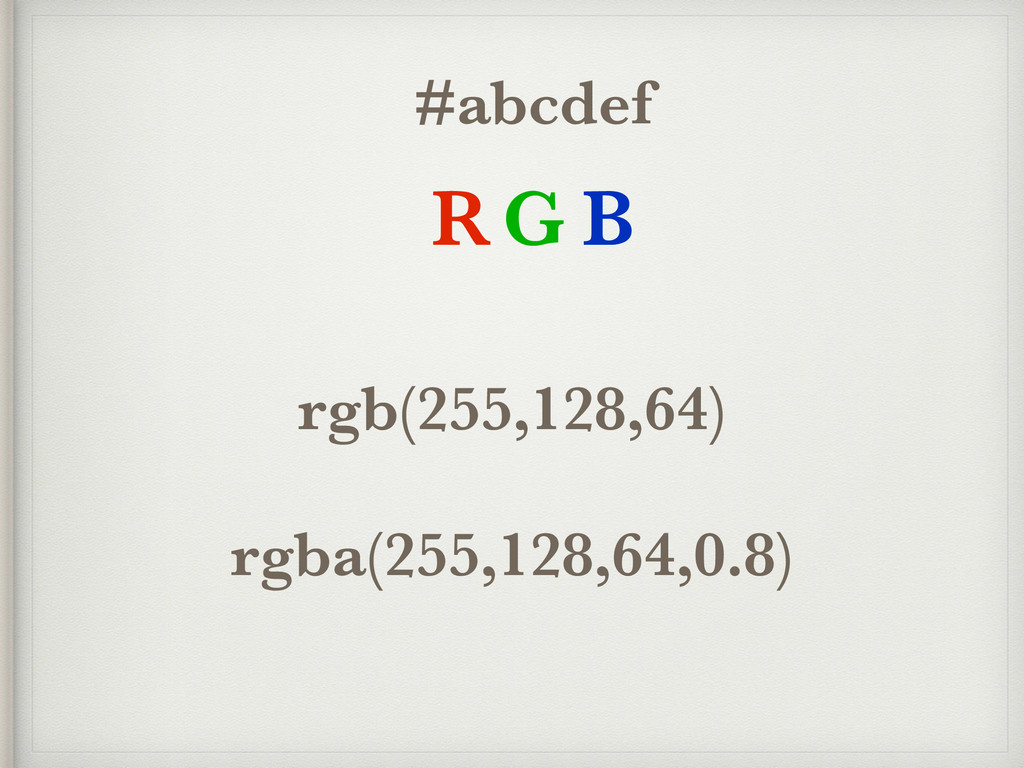
#abcdef RG B rgb(255,128,64) rgba(255,128,64,0.8)
<circle cx=“10” cy=“10” r=“10” stroke=“black” fill=“#8fc” stroke-width=“5” >
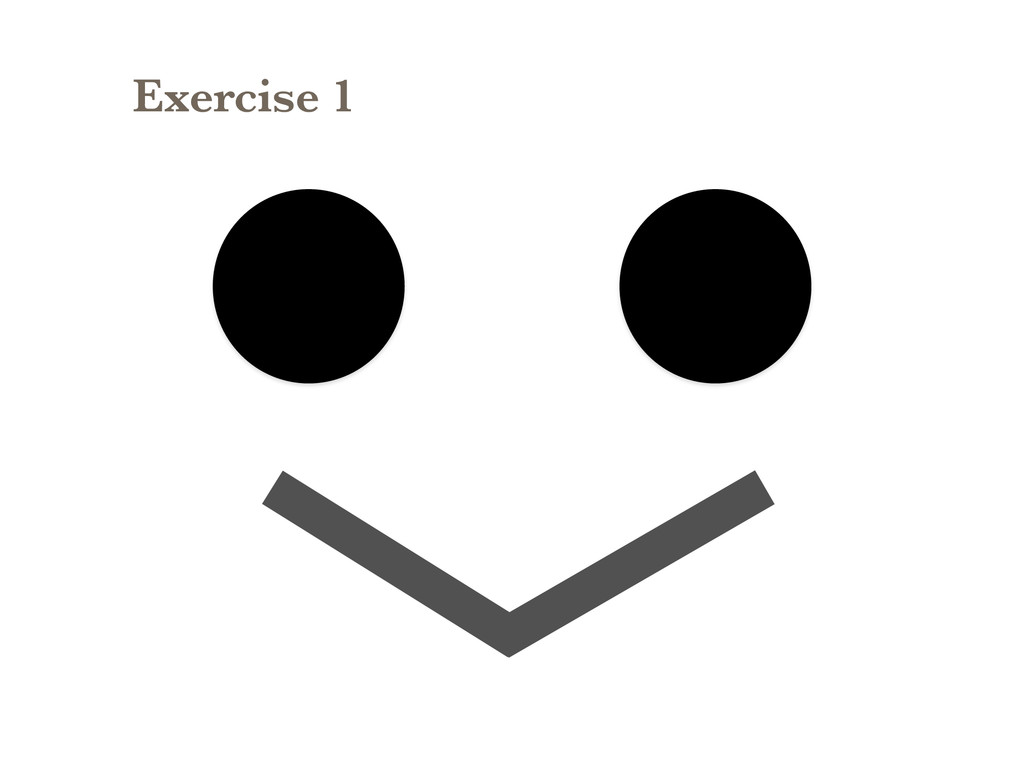
Exercise 1
?
None
None
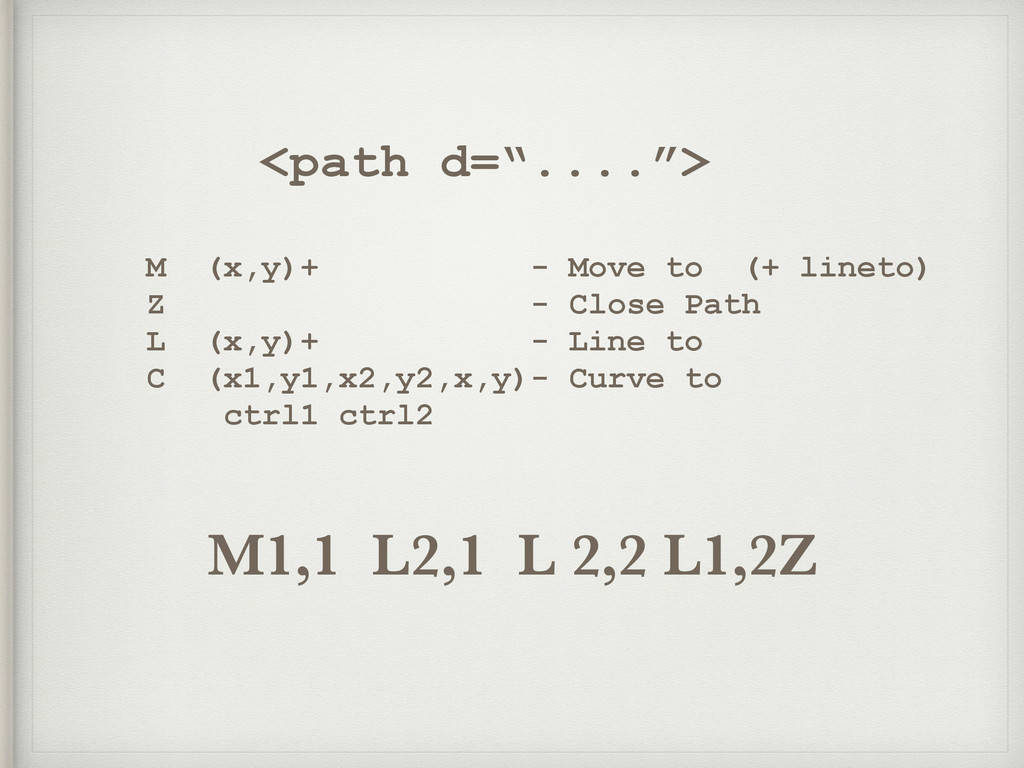
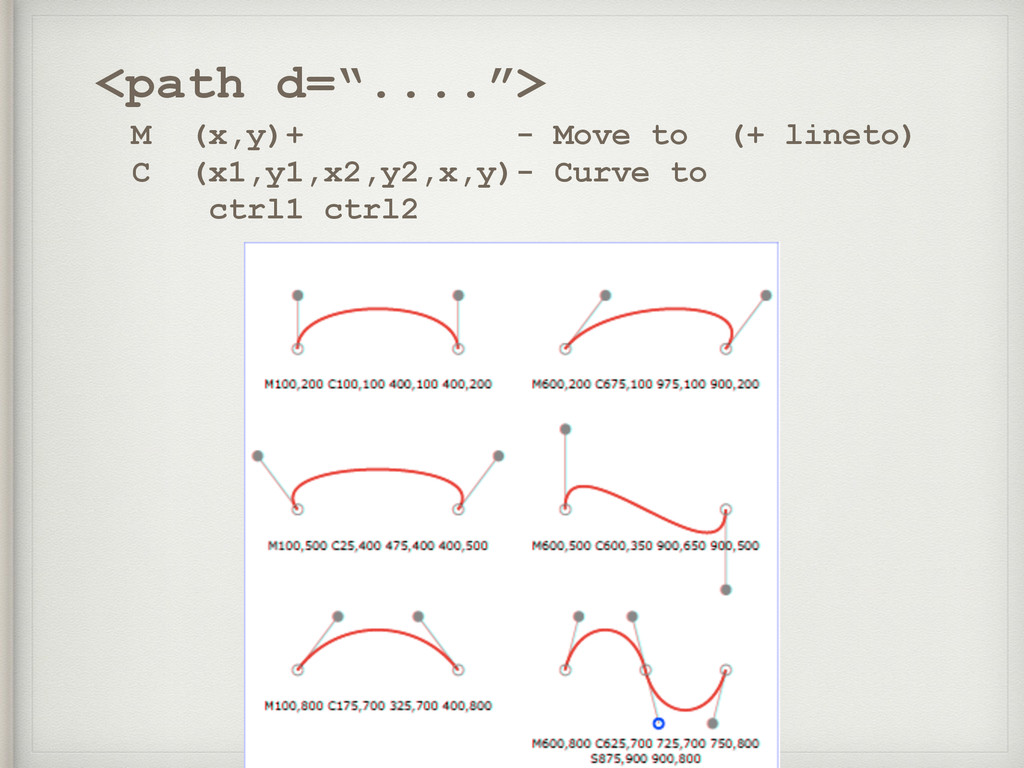
<path d=“....”> M (x,y)+ - Move to (+ lineto) Z
- Close Path L (x,y)+ - Line to C (x1,y1,x2,y2,x,y)- Curve to ctrl1 ctrl2 M1,1 L2,1 L 2,2 L1,2Z
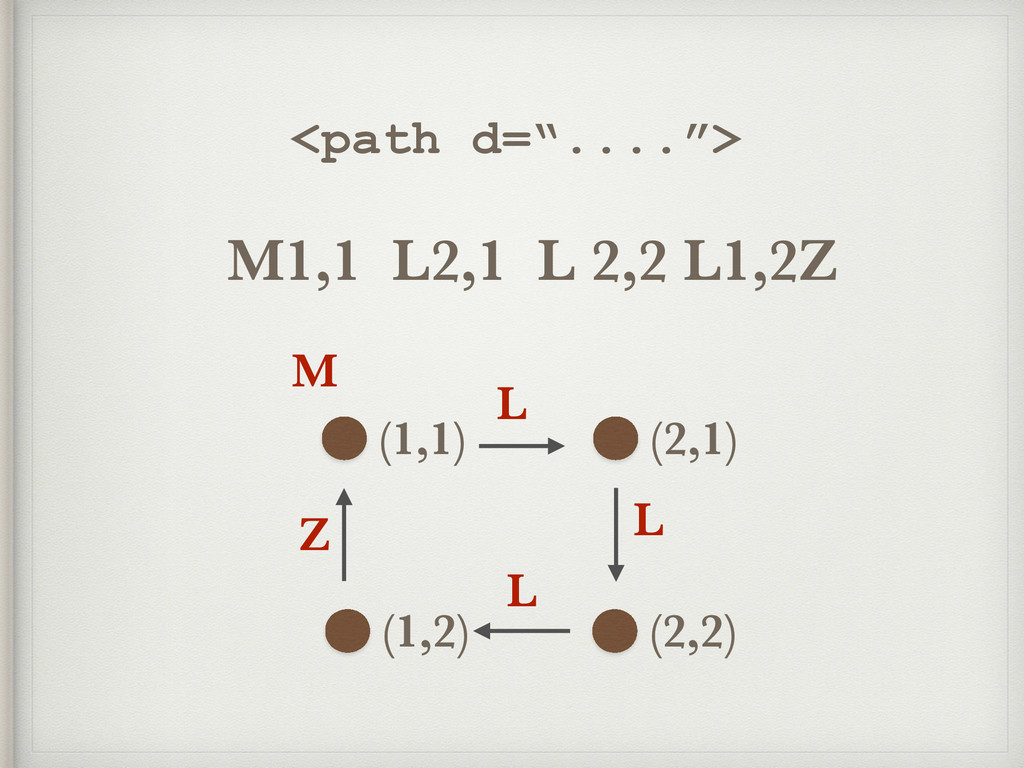
<path d=“....”> M1,1 L2,1 L 2,2 L1,2Z (1,1) (2,1) (2,2)
(1,2) M L L L Z
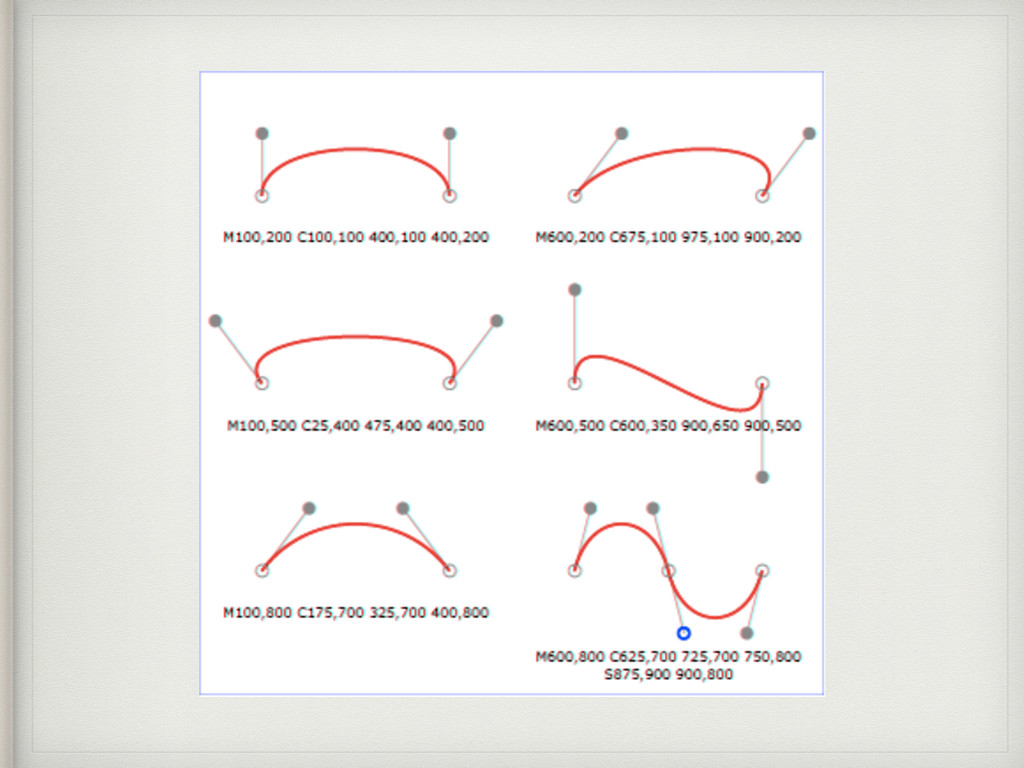
<path d=“....”> M (x,y)+ - Move to (+ lineto) C
(x1,y1,x2,y2,x,y)- Curve to ctrl1 ctrl2
None
<path d=“....”> Q (x1,y1,x,y)+ - Quadratic Bezier T (x,y)+ -
Quadratic Bezier
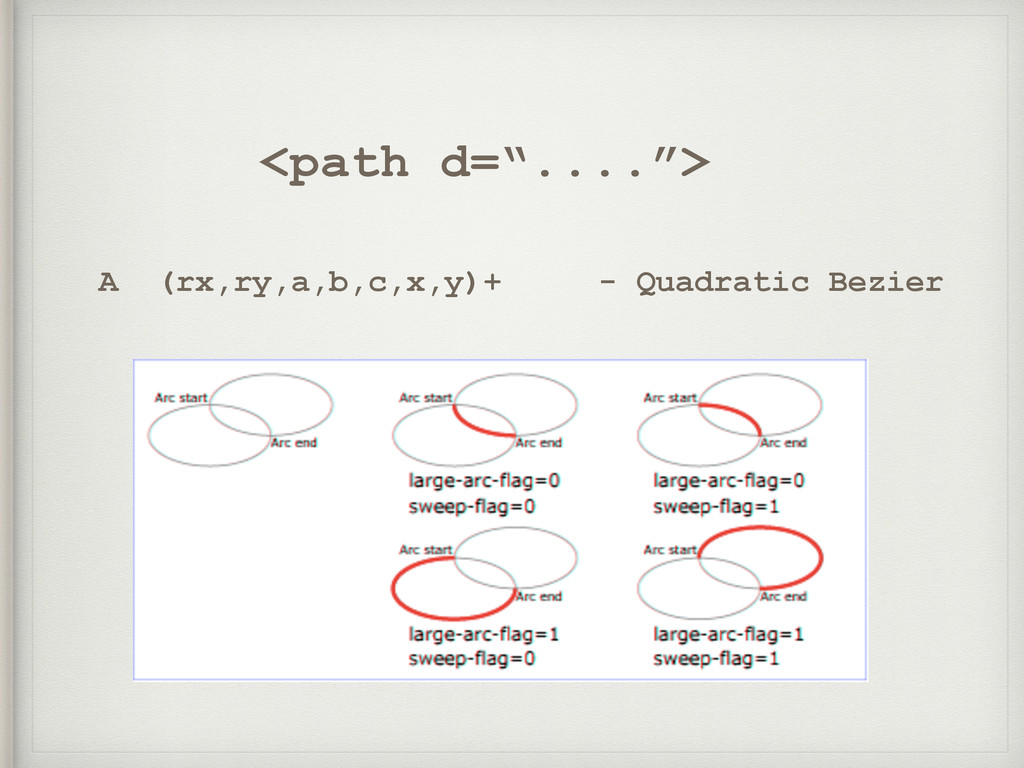
<path d=“....”> A (rx,ry,a,b,c,x,y)+ - Quadratic Bezier
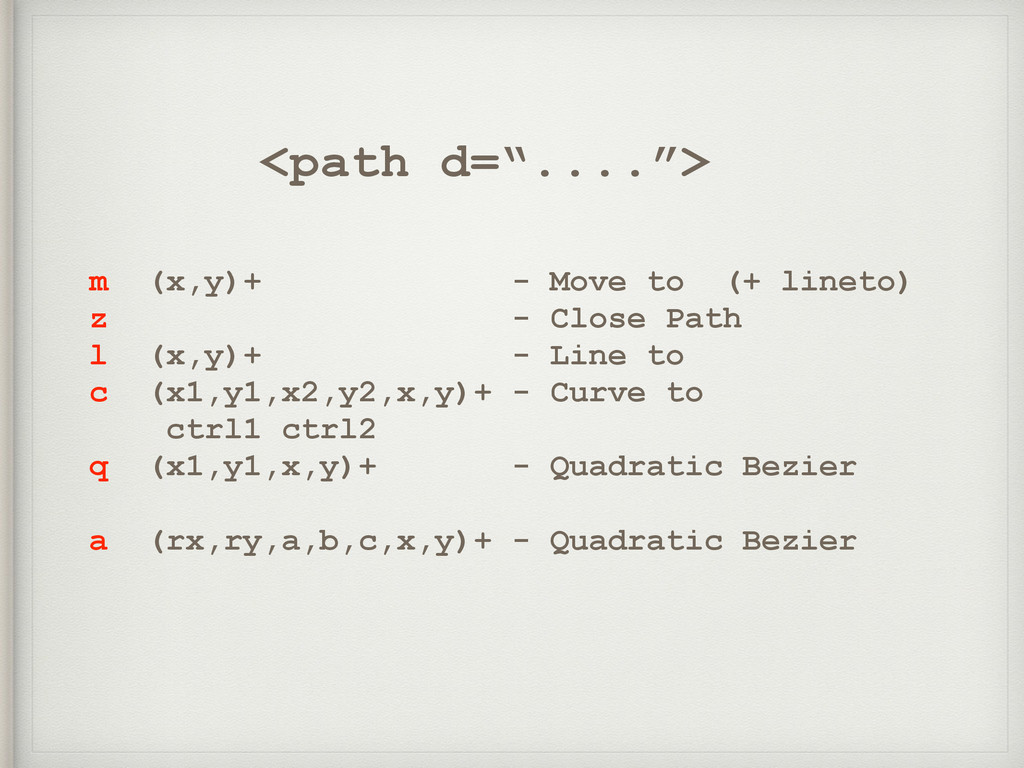
<path d=“....”> m (x,y)+ - Move to (+ lineto) z
- Close Path l (x,y)+ - Line to c (x1,y1,x2,y2,x,y)+ - Curve to ctrl1 ctrl2 q (x1,y1,x,y)+ - Quadratic Bezier a (rx,ry,a,b,c,x,y)+ - Quadratic Bezier
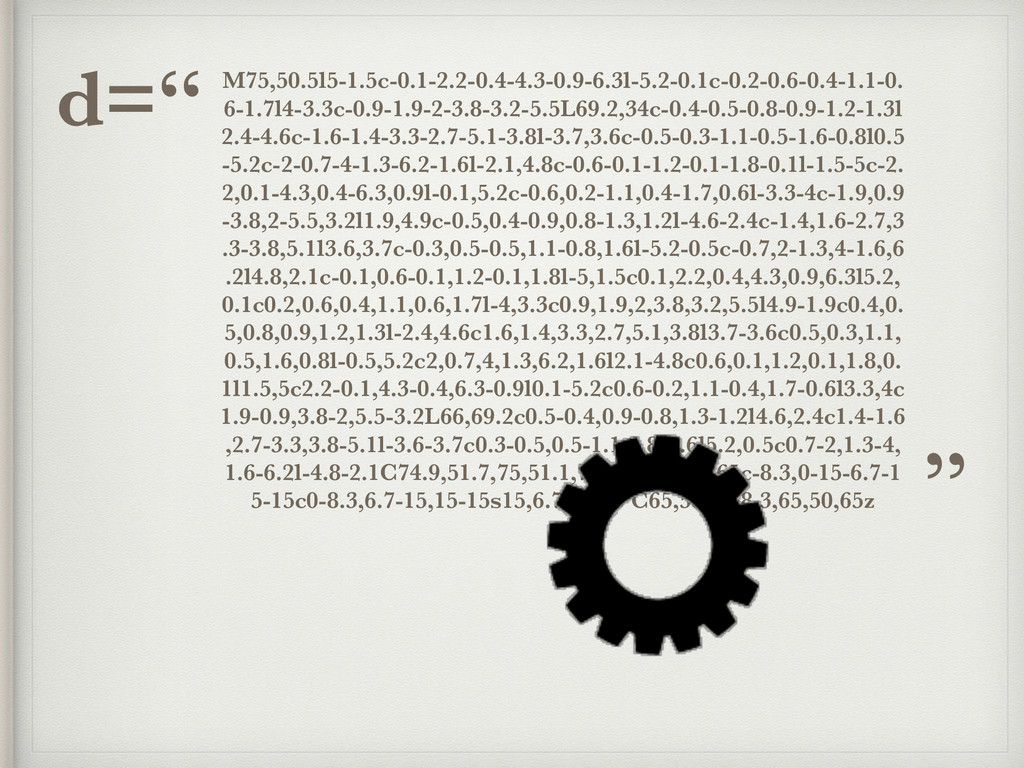
M75,50.5l5-1.5c-0.1-2.2-0.4-4.3-0.9-6.3l-5.2-0.1c-0.2-0.6-0.4-1.1-0. 6-1.7l4-3.3c-0.9-1.9-2-3.8-3.2-5.5L69.2,34c-0.4-0.5-0.8-0.9-1.2-1.3l 2.4-4.6c-1.6-1.4-3.3-2.7-5.1-3.8l-3.7,3.6c-0.5-0.3-1.1-0.5-1.6-0.8l0.5 -5.2c-2-0.7-4-1.3-6.2-1.6l-2.1,4.8c-0.6-0.1-1.2-0.1-1.8-0.1l-1.5-5c-2. 2,0.1-4.3,0.4-6.3,0.9l-0.1,5.2c-0.6,0.2-1.1,0.4-1.7,0.6l-3.3-4c-1.9,0.9 -3.8,2-5.5,3.2l1.9,4.9c-0.5,0.4-0.9,0.8-1.3,1.2l-4.6-2.4c-1.4,1.6-2.7,3 .3-3.8,5.1l3.6,3.7c-0.3,0.5-0.5,1.1-0.8,1.6l-5.2-0.5c-0.7,2-1.3,4-1.6,6 .2l4.8,2.1c-0.1,0.6-0.1,1.2-0.1,1.8l-5,1.5c0.1,2.2,0.4,4.3,0.9,6.3l5.2, 0.1c0.2,0.6,0.4,1.1,0.6,1.7l-4,3.3c0.9,1.9,2,3.8,3.2,5.5l4.9-1.9c0.4,0. 5,0.8,0.9,1.2,1.3l-2.4,4.6c1.6,1.4,3.3,2.7,5.1,3.8l3.7-3.6c0.5,0.3,1.1,
0.5,1.6,0.8l-0.5,5.2c2,0.7,4,1.3,6.2,1.6l2.1-4.8c0.6,0.1,1.2,0.1,1.8,0. 1l1.5,5c2.2-0.1,4.3-0.4,6.3-0.9l0.1-5.2c0.6-0.2,1.1-0.4,1.7-0.6l3.3,4c 1.9-0.9,3.8-2,5.5-3.2L66,69.2c0.5-0.4,0.9-0.8,1.3-1.2l4.6,2.4c1.4-1.6 ,2.7-3.3,3.8-5.1l-3.6-3.7c0.3-0.5,0.5-1.1,0.8-1.6l5.2,0.5c0.7-2,1.3-4, 1.6-6.2l-4.8-2.1C74.9,51.7,75,51.1,75,50.5zM50,65c-8.3,0-15-6.7-1 5-15c0-8.3,6.7-15,15-15s15,6.7,15,15 C65,58.3,58.3,65,50,65z d=“ ”
http://goo.gl/fPUFgv SVG Editor
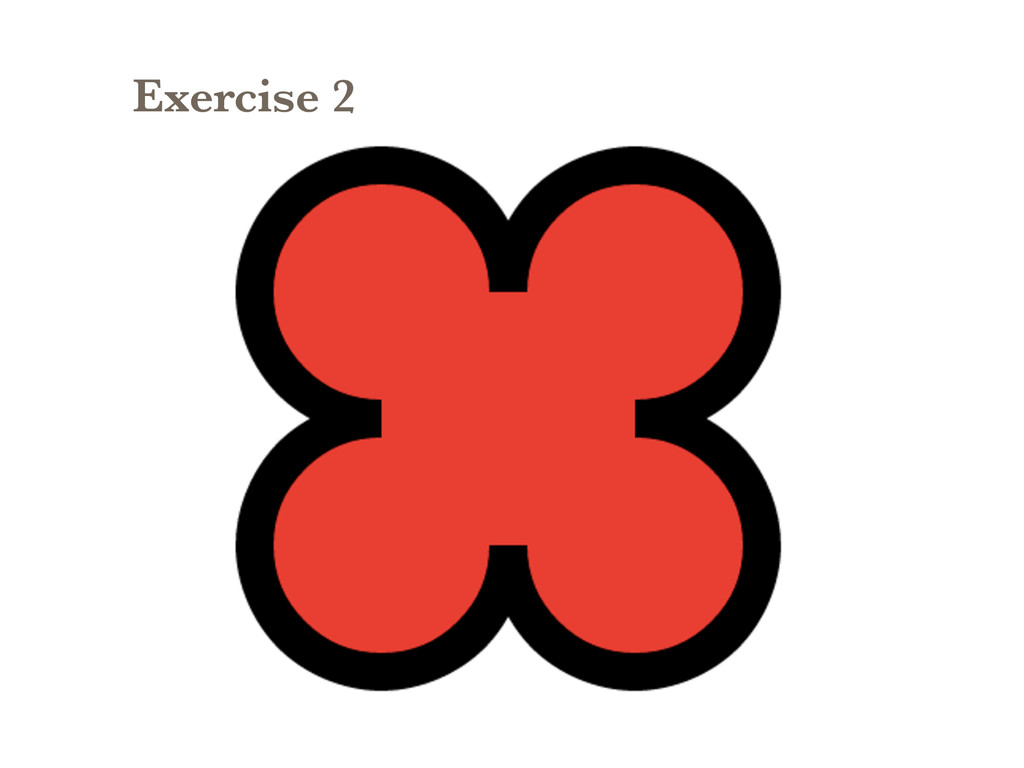
Exercise 2
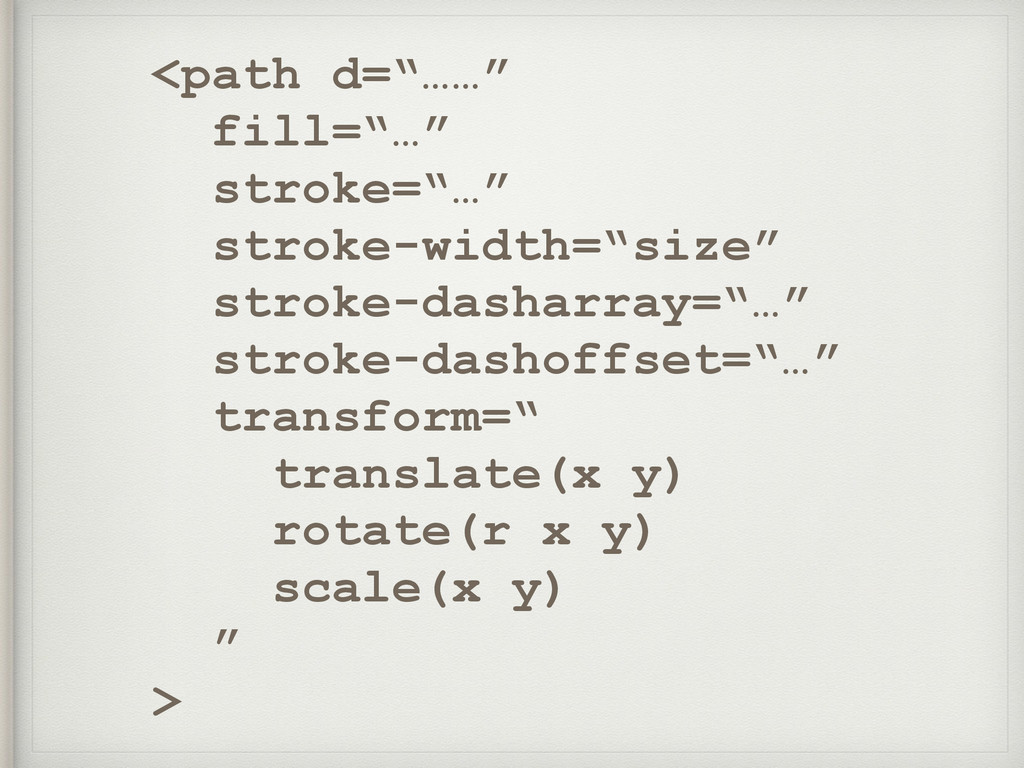
<path d=“……” fill=“…” stroke=“…” stroke-width=“size” stroke-dasharray=“…” stroke-dashoffset=“…” transform=“ translate(x y)
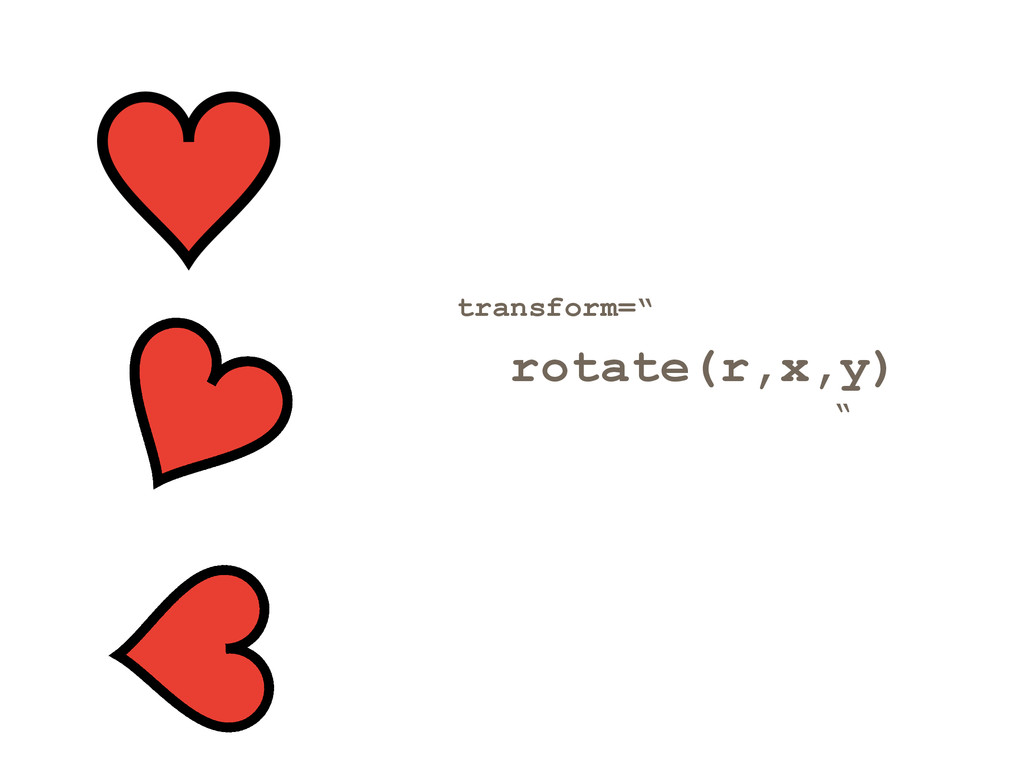
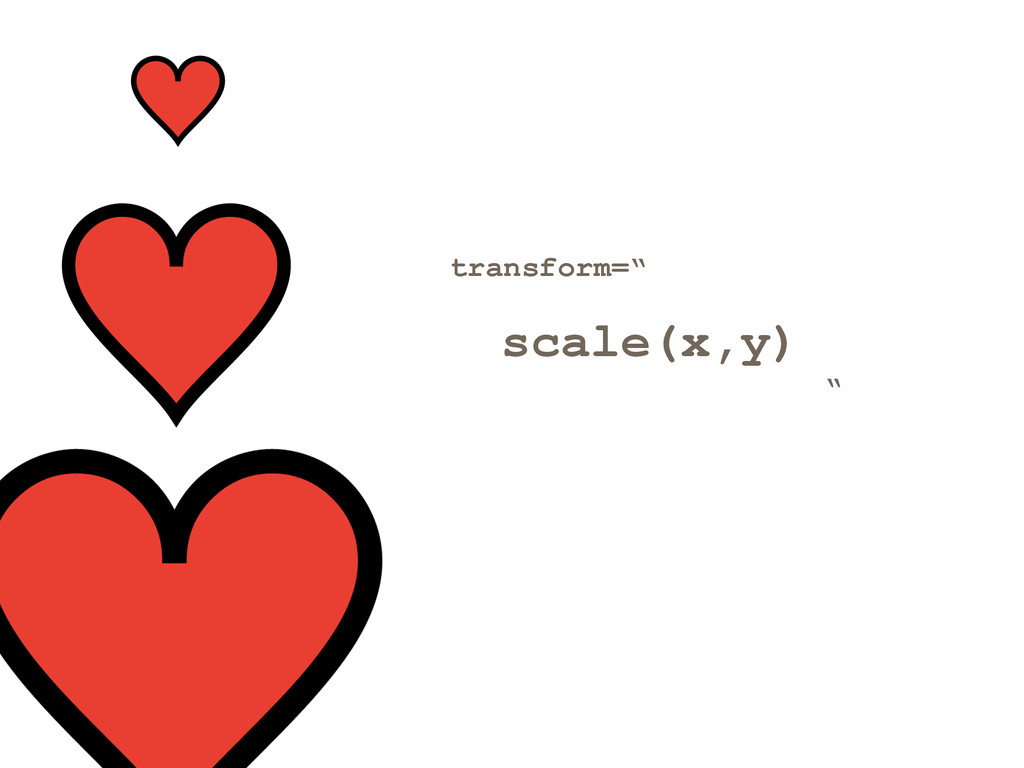
rotate(r x y) scale(x y) ” >
None
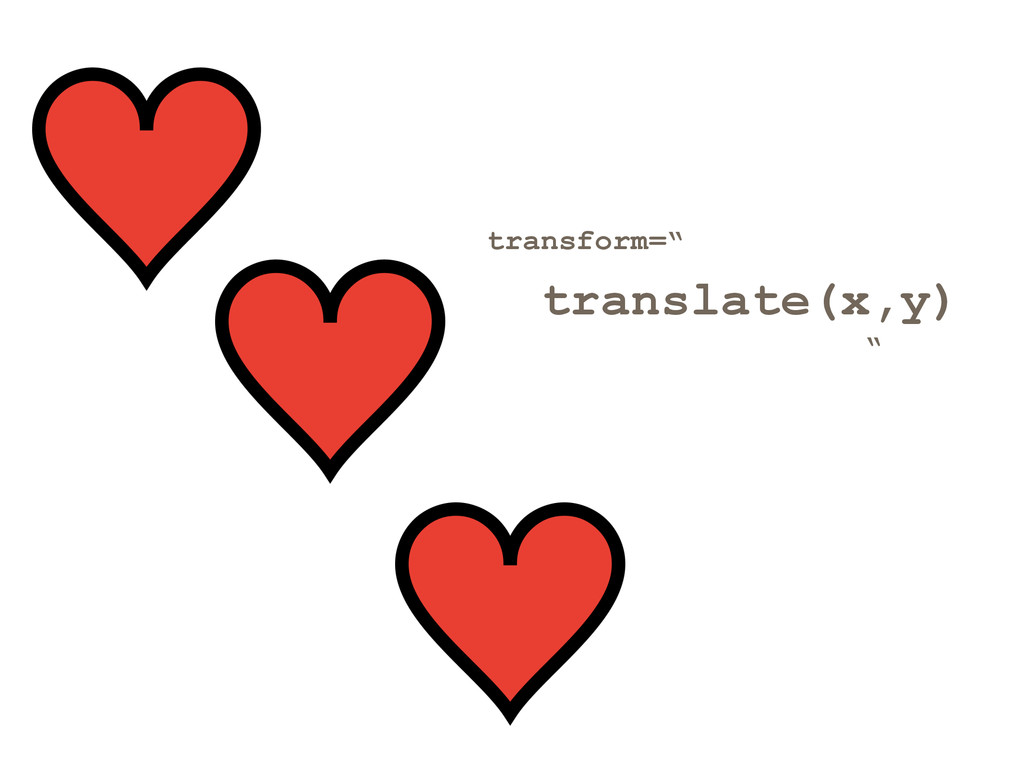
transform=“ translate(x,y) “
transform=“ rotate(r,x,y) “
transform=“ scale(x,y) “
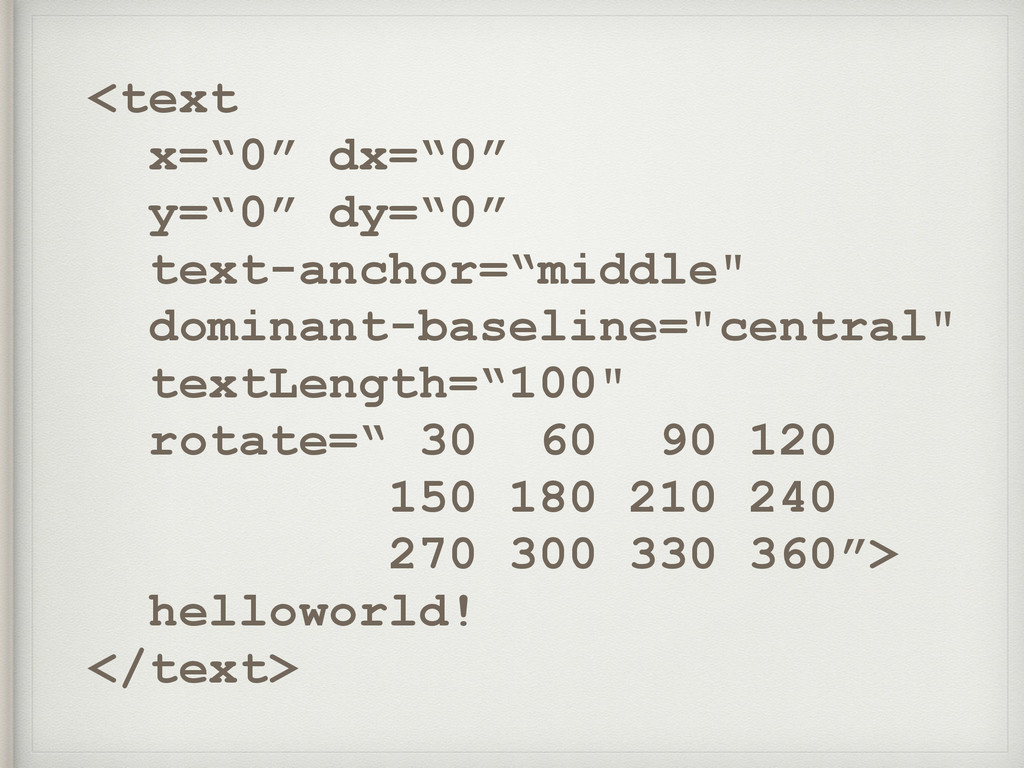
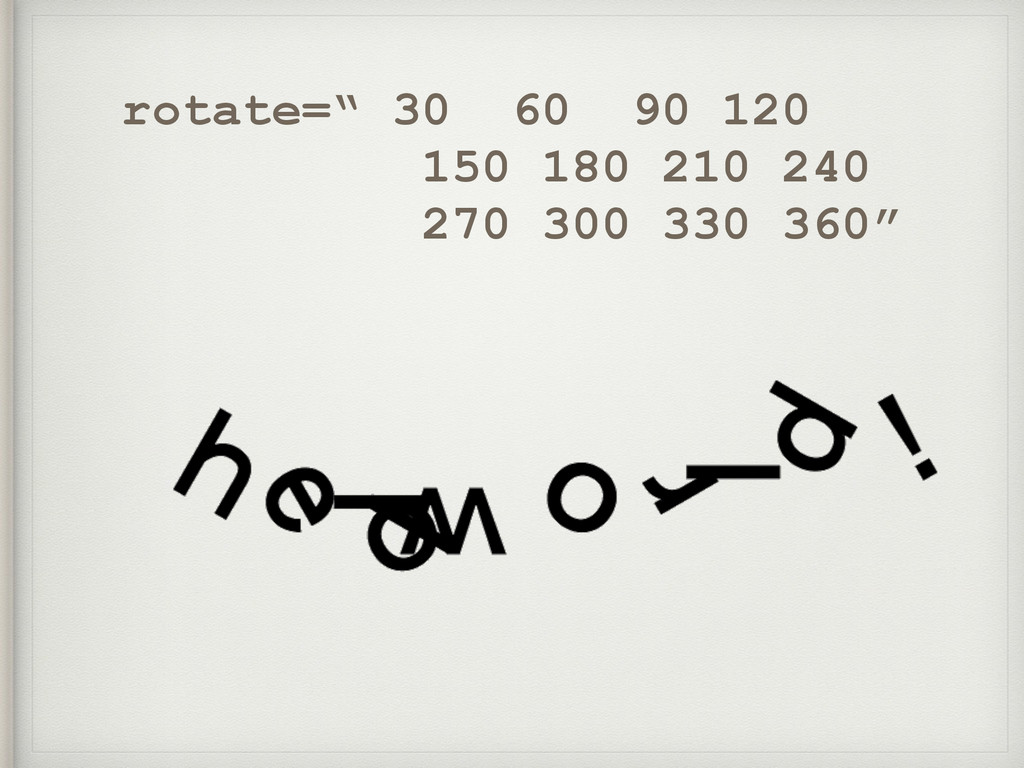
<text x=“0” dx=“0” y=“0” dy=“0” text-anchor=“middle" dominant-baseline="central" textLength=“100" rotate=“ 30
60 90 120 150 180 210 240 270 300 330 360”> helloworld! </text>
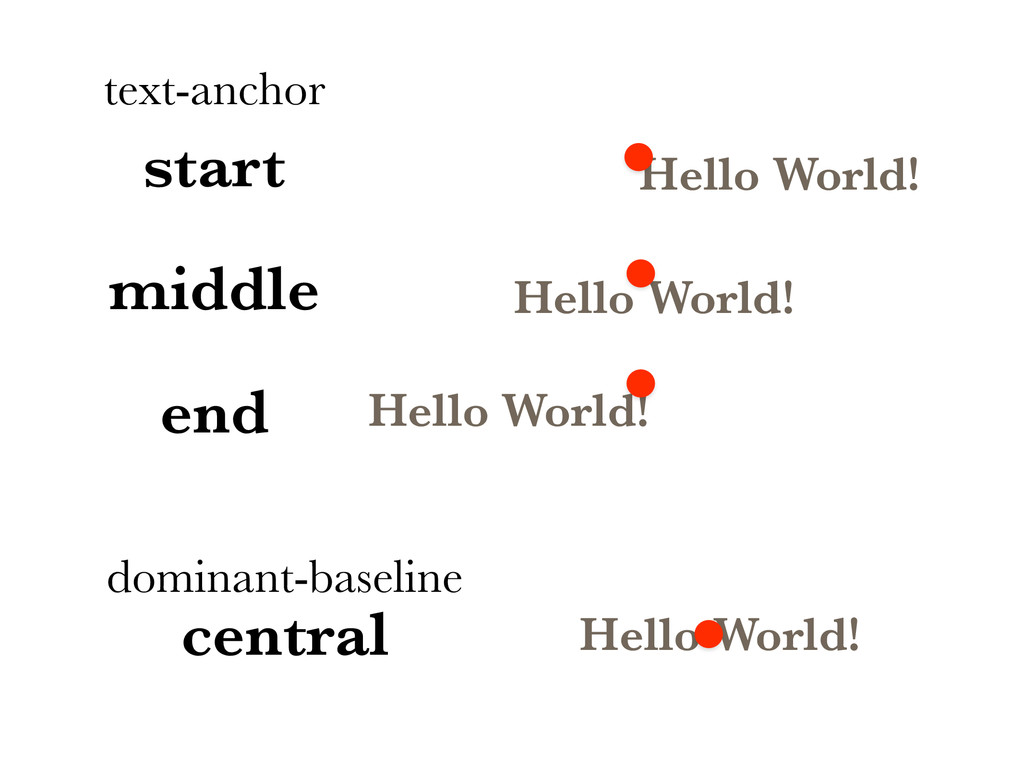
Hello World! Hello World! Hello World! start middle end Hello
World! dominant-baseline text-anchor central
rotate=“ 30 60 90 120 150 180 210 240 270
300 330 360”
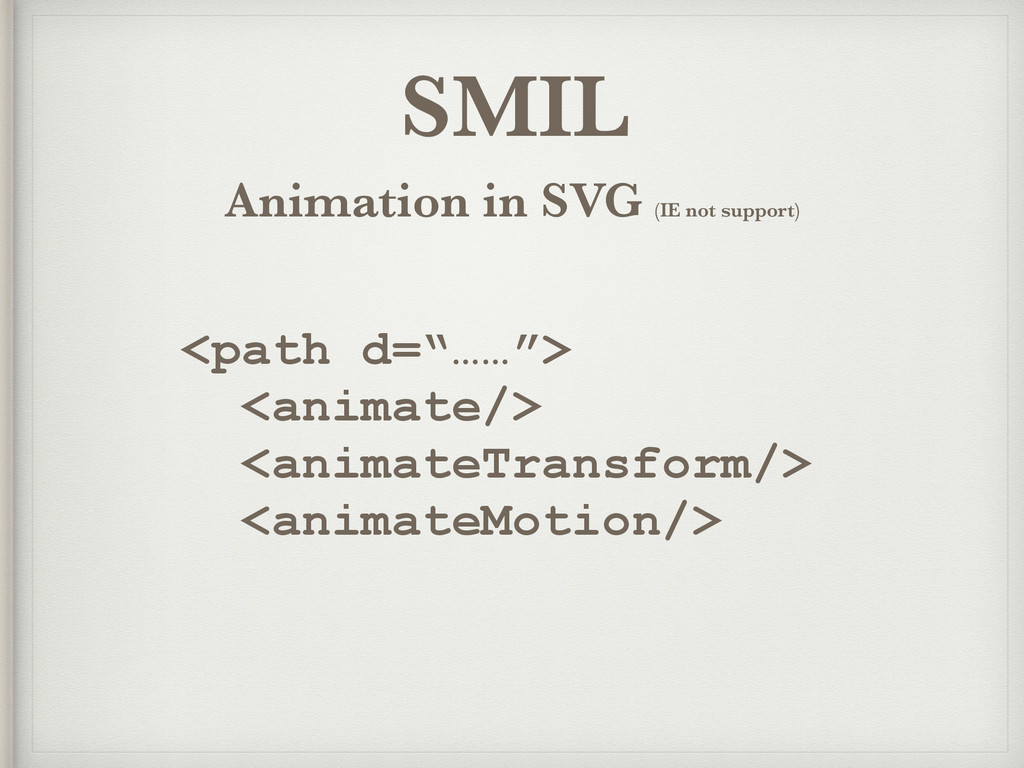
SMIL <path d=“……”> <animate/> <animateTransform/> <animateMotion/> Animation in SVG (IE
not support)
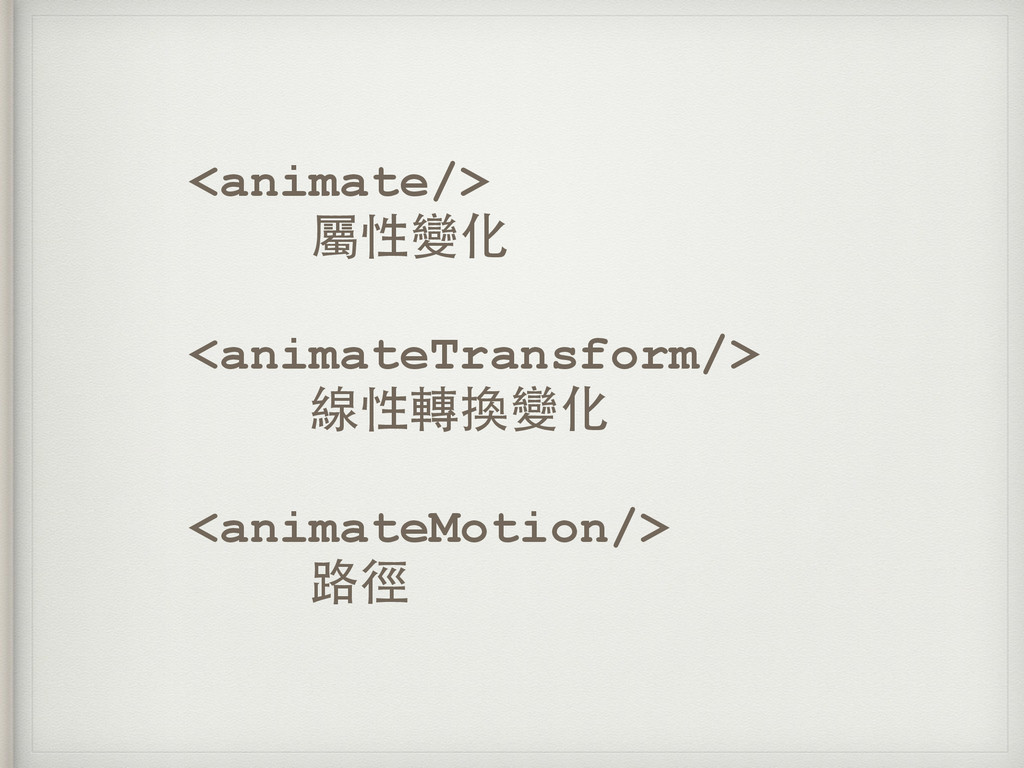
<animate/> 屬性變化 <animateTransform/> 線性轉換變化 <animateMotion/> 路徑
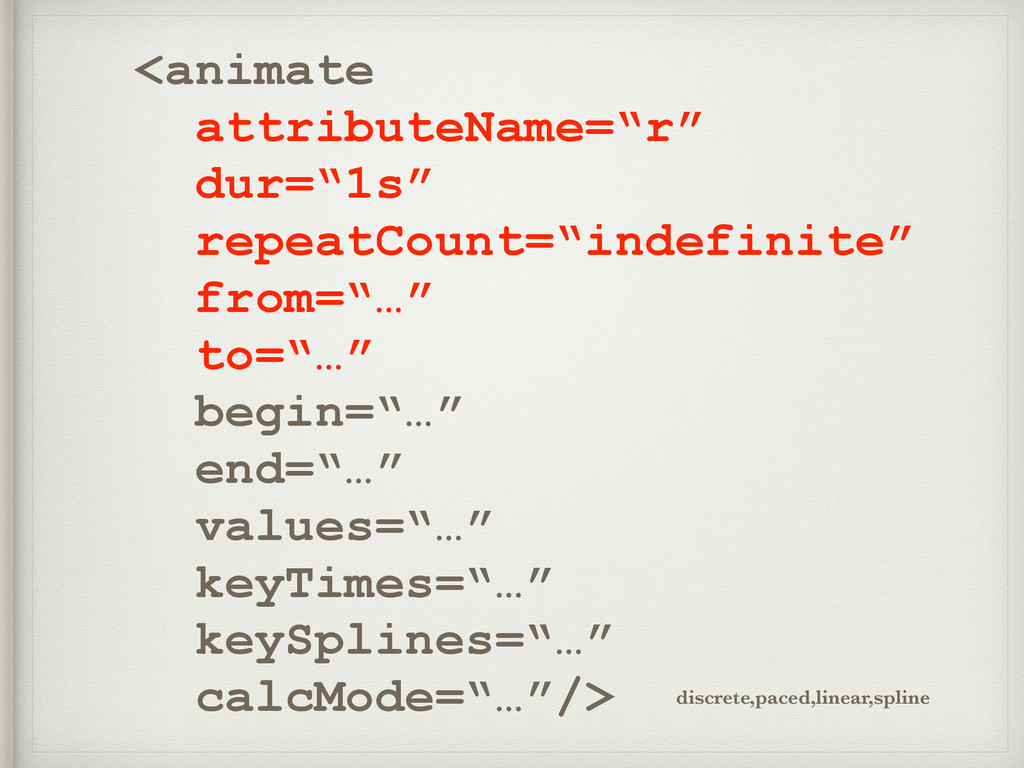
<animate attributeName=“r” dur=“1s” repeatCount=“indefinite” from=“…” to=“…” begin=“…” end=“…” values=“…” keyTimes=“…”
keySplines=“…” calcMode=“…”/> discrete,paced,linear,spline
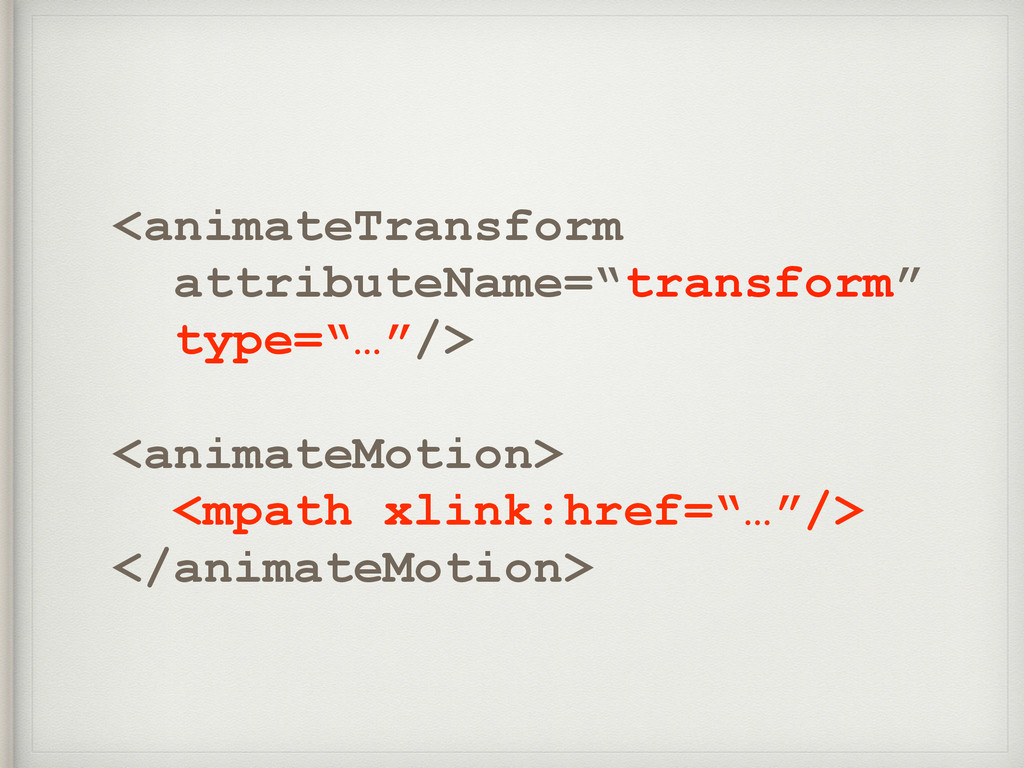
<animateTransform attributeName=“transform” type=“…”/> <animateMotion> <mpath xlink:href=“…”/> </animateMotion>
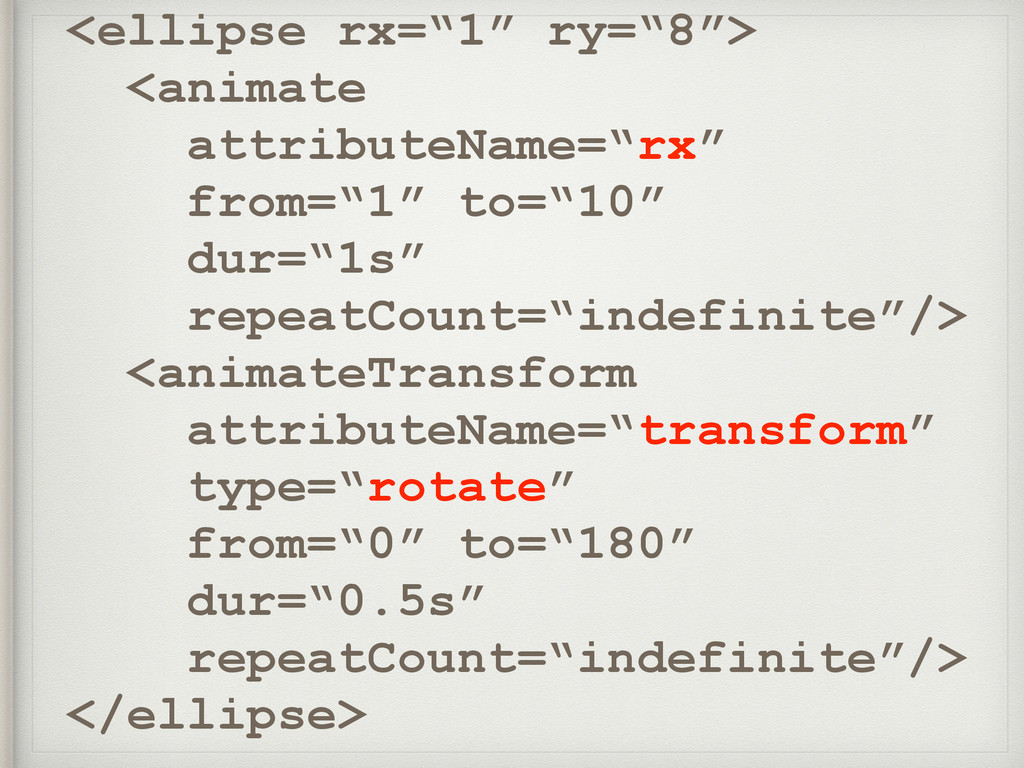
<ellipse rx=“1” ry=“8”> <animate attributeName=“rx” from=“1” to=“10” dur=“1s” repeatCount=“indefinite”/>
<animateTransform attributeName=“transform” type=“rotate” from=“0” to=“180” dur=“0.5s” repeatCount=“indefinite”/> </ellipse>
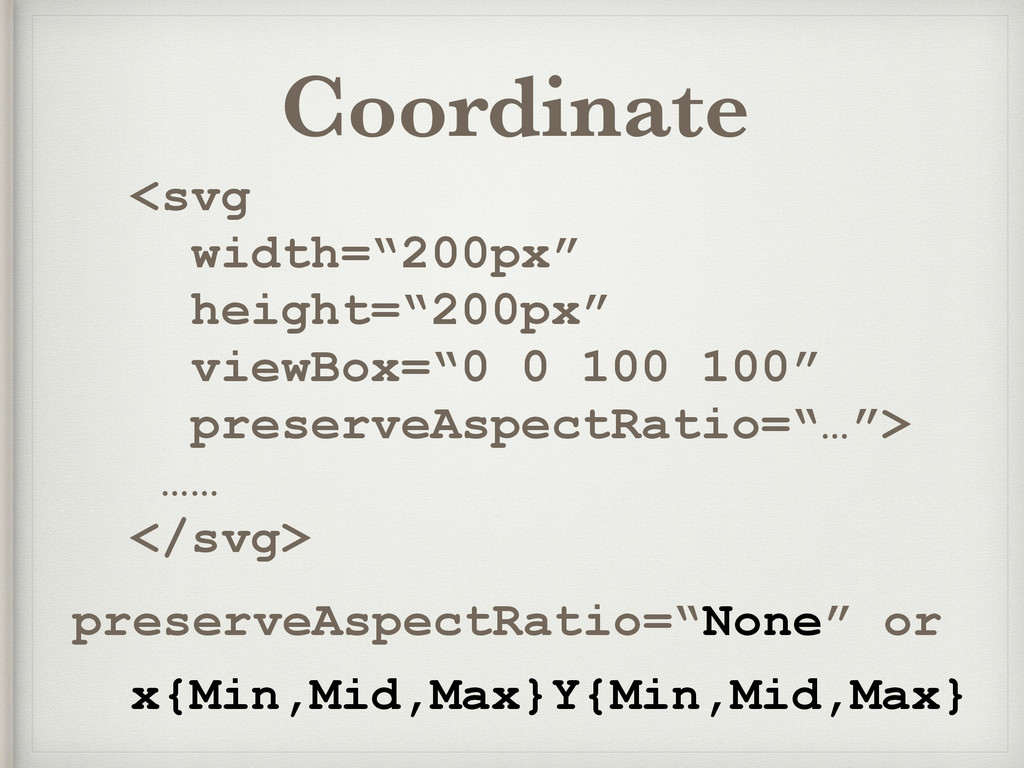
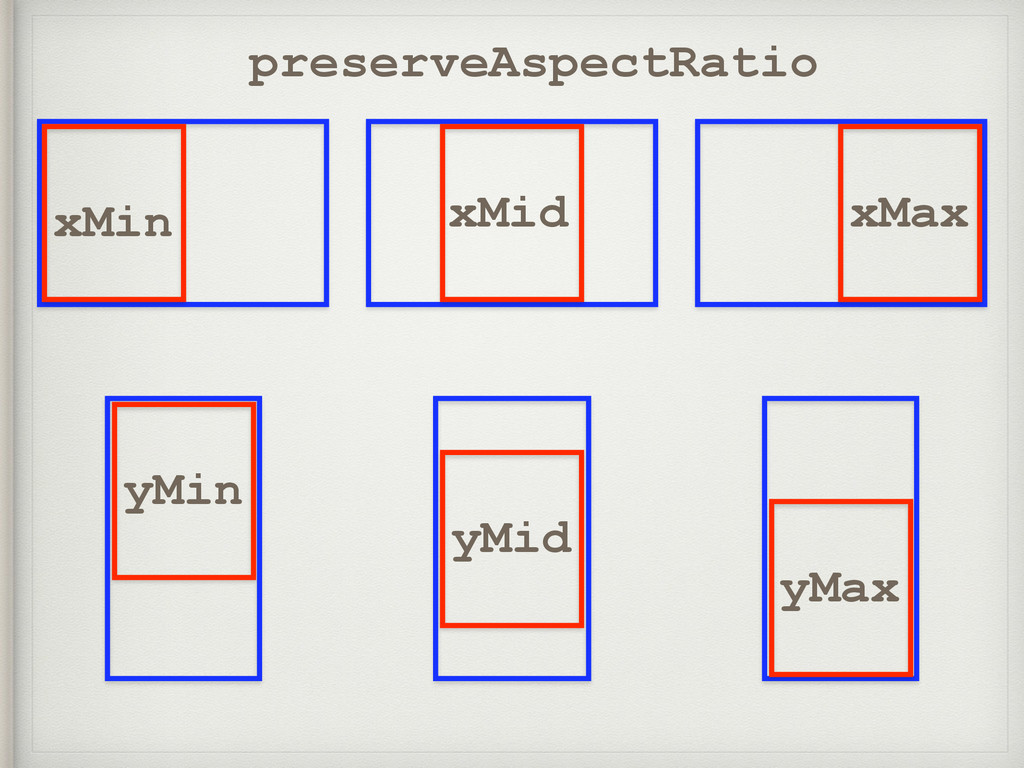
Coordinate <svg width=“200px” height=“200px” viewBox=“0 0 100 100” preserveAspectRatio=“…”> ……
</svg> preserveAspectRatio=“None” or x{Min,Mid,Max}Y{Min,Mid,Max}
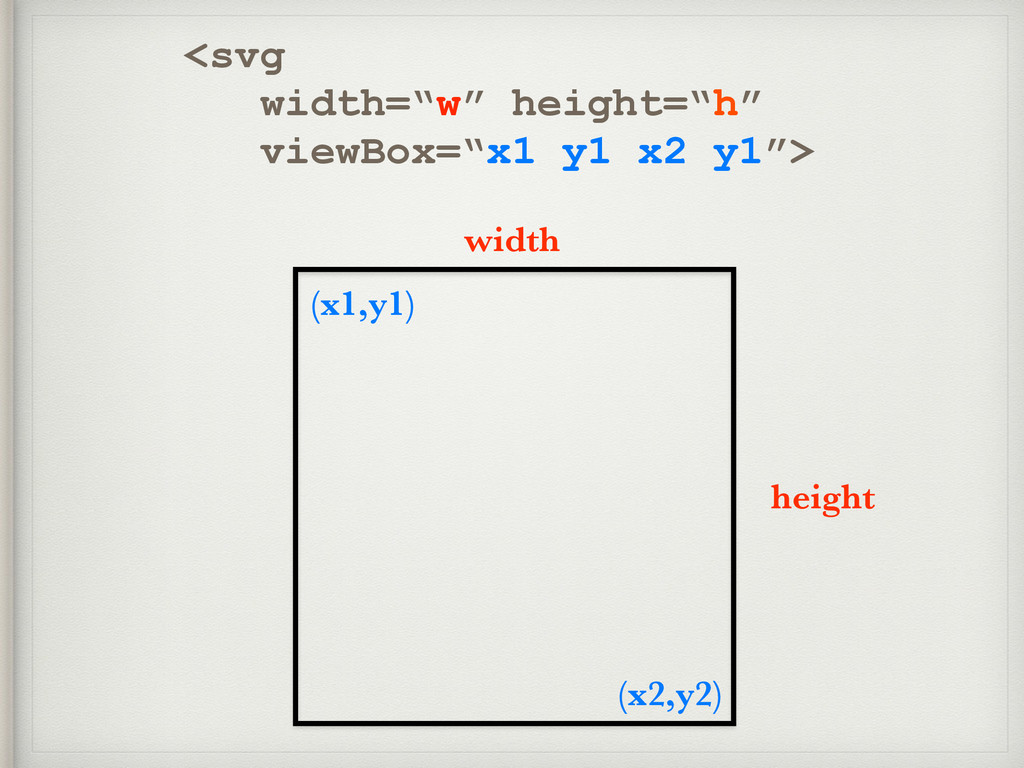
width height (x1,y1) (x2,y2) <svg width=“w” height=“h” viewBox=“x1 y1 x2
y1”>
None
preserveAspectRatio xMin xMid xMax yMin yMid yMax
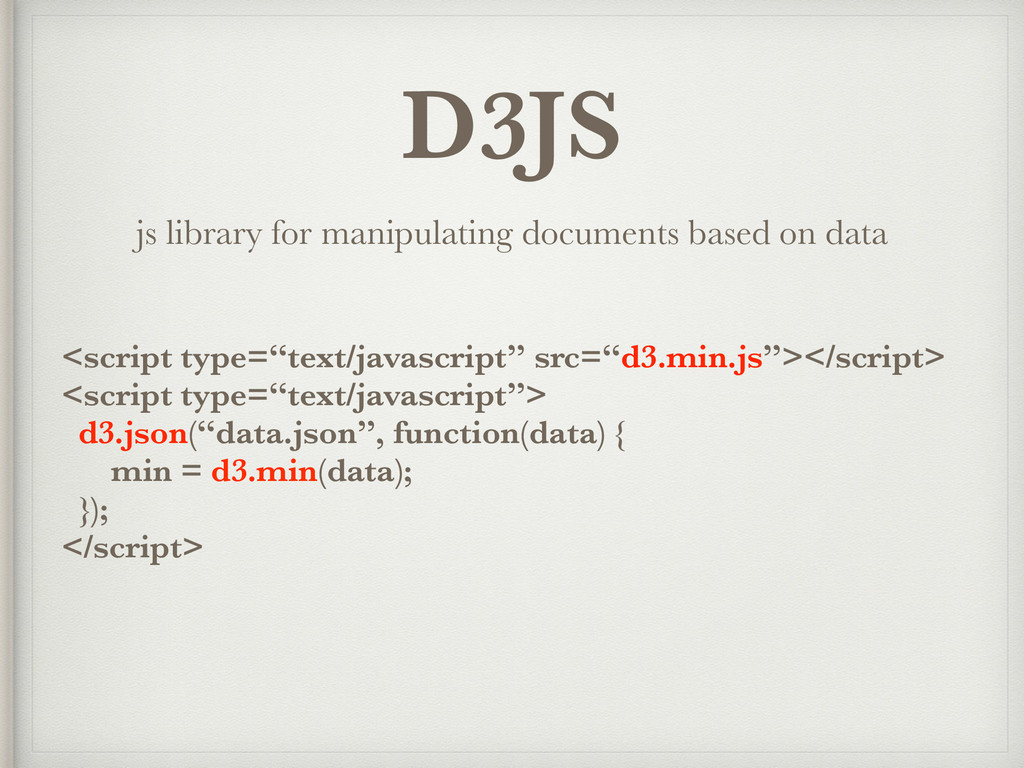
D3JS js library for manipulating documents based on data <script
type=“text/javascript” src=“d3.min.js”></script> <script type=“text/javascript”> d3.json(“data.json”, function(data) { min = d3.min(data); }); </script>
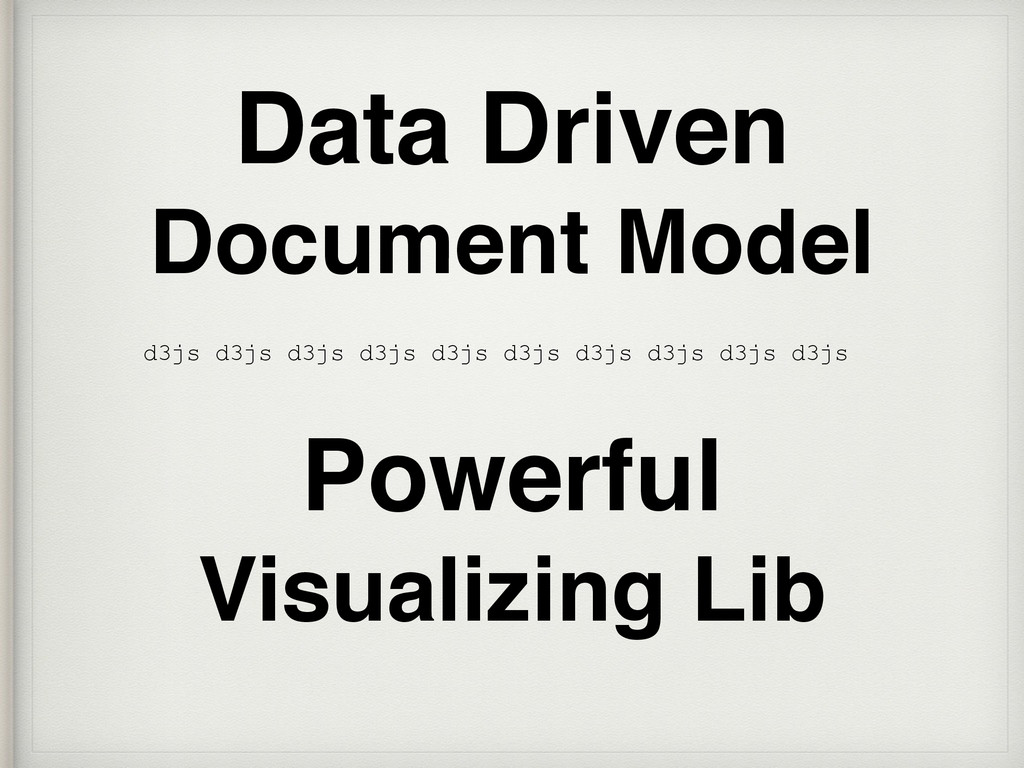
Data Driven Document Model Powerful Visualizing Lib d3js d3js d3js
d3js d3js d3js d3js d3js d3js d3js
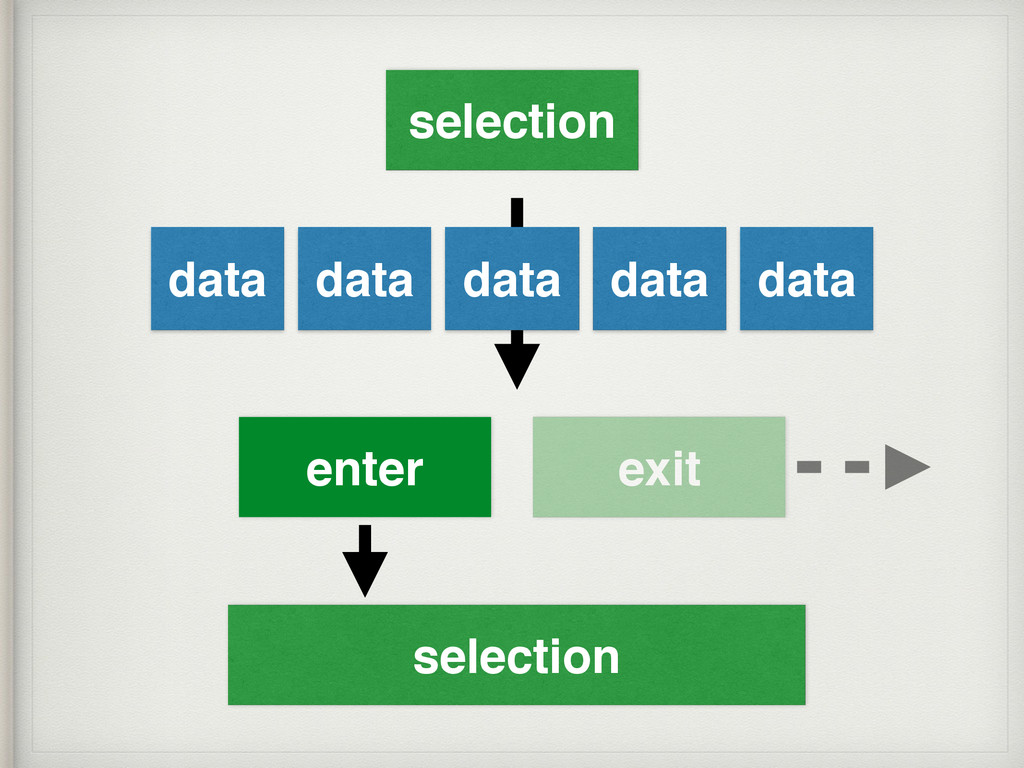
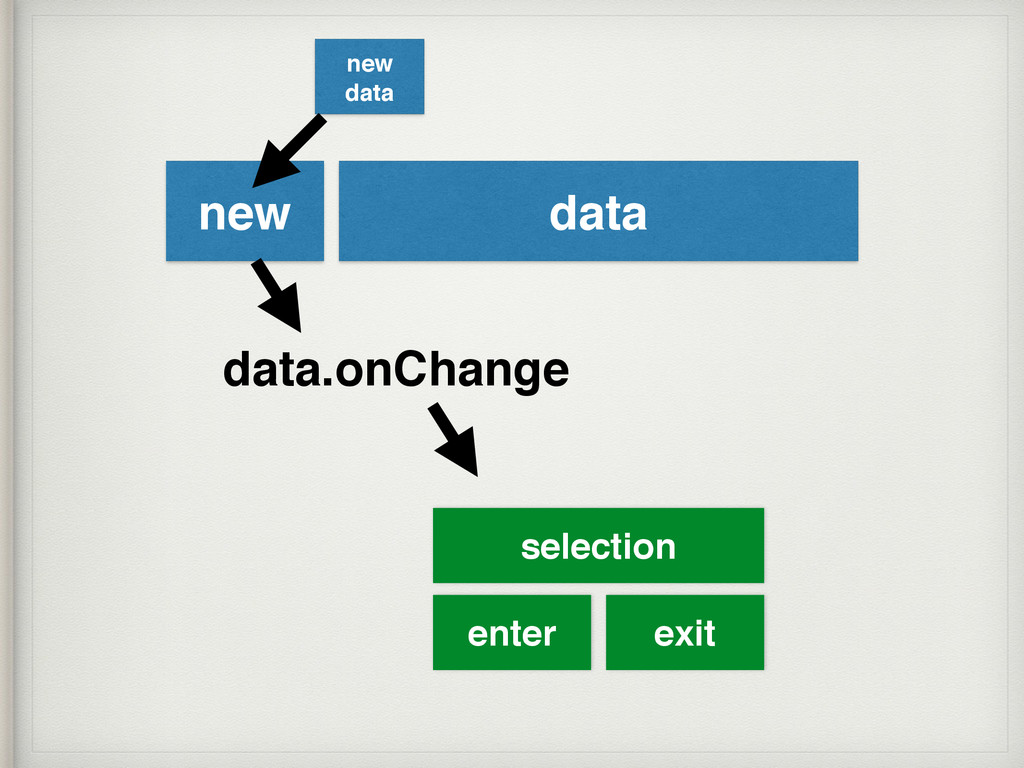
data data data data data selection enter exit selection
data data data data selection enter exit selection d3.selectAll(“div”) .data(data)
.enter().append(“div”) .exit().remove() d3.selectAll(“div”)
new data data new data.onChange enter exit selection
Topic 1 - Selections
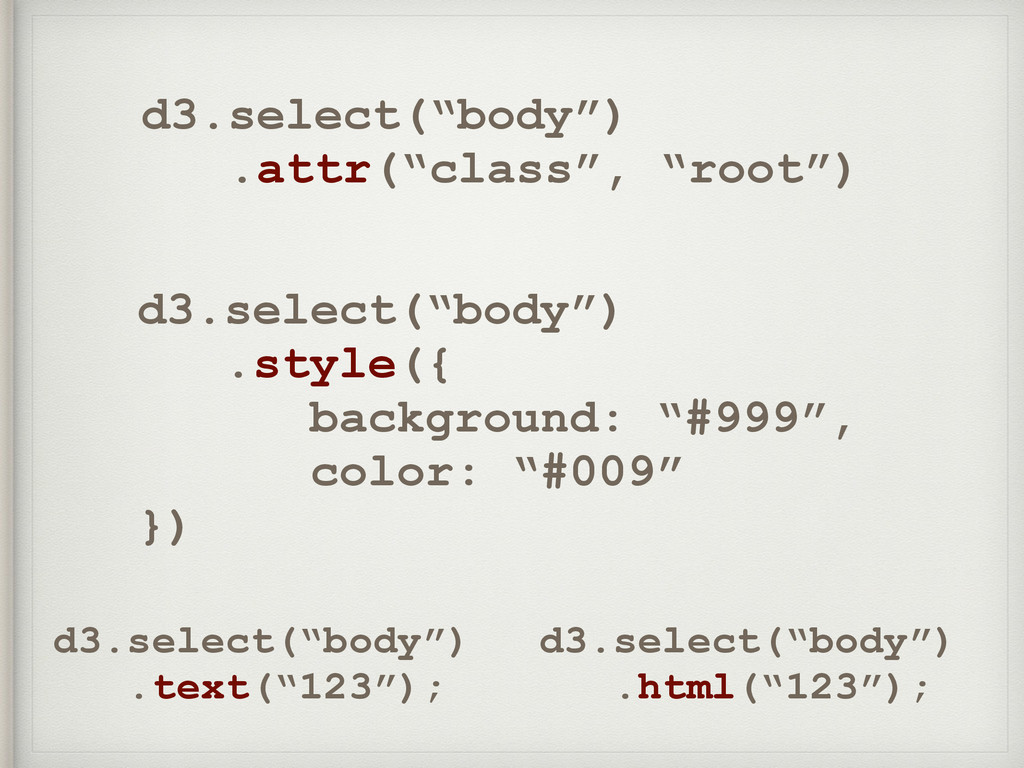
d3.select(“body”) .attr(“class”, “root”) d3.select(“body”) .style({ background: “#999”, color: “#009” })
d3.select(“body”) .text(“123”); d3.select(“body”) .html(“123”);
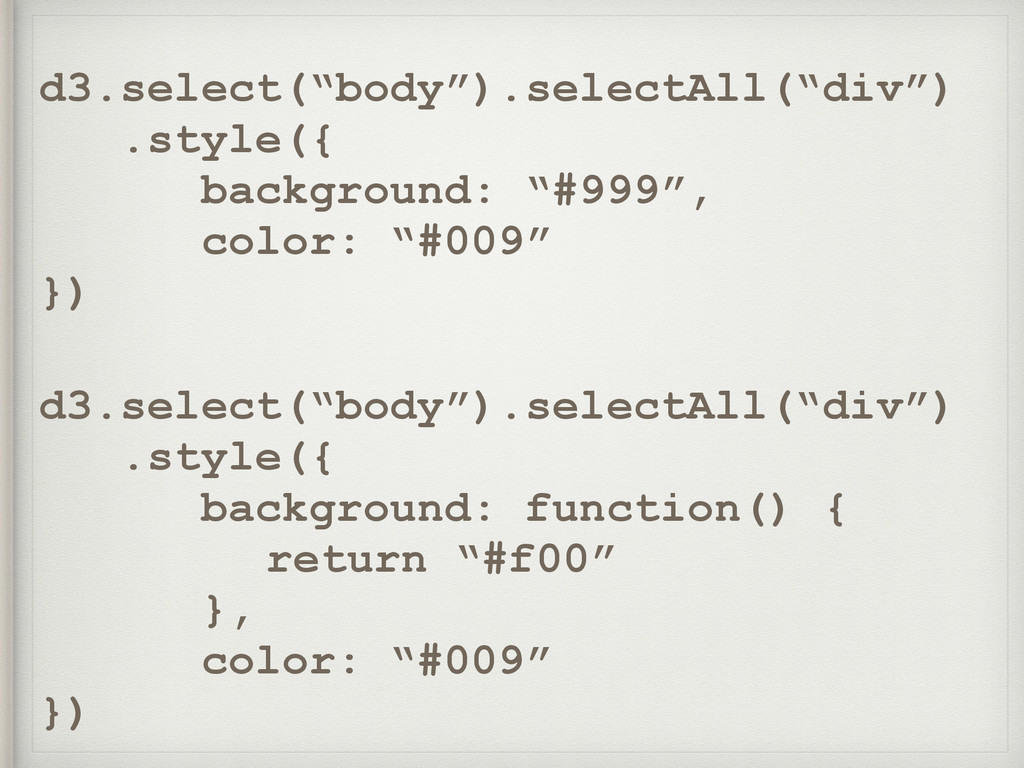
d3.select(“body”).selectAll(“div”) .style({ background: “#999”, color: “#009” }) d3.select(“body”).selectAll(“div”) .style({ background:
function() { return “#f00” }, color: “#009” })
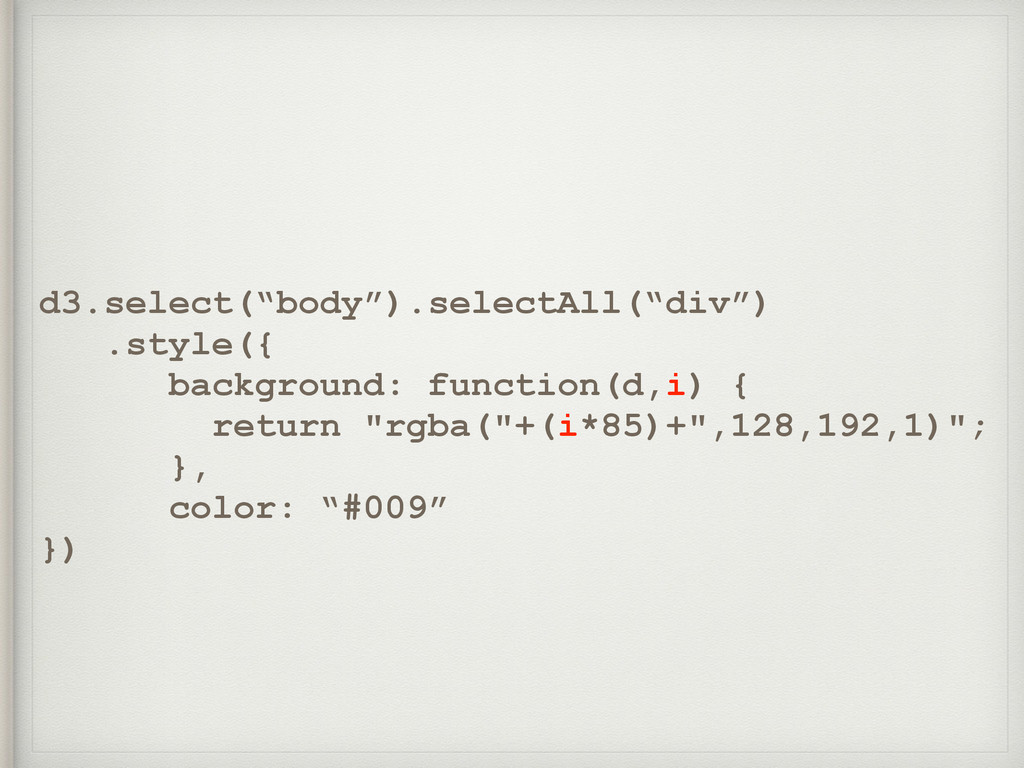
d3.select(“body”).selectAll(“div”) .style({ background: function(d,i) { return "rgba("+(i*85)+",128,192,1)"; }, color: “#009”
})
d3.select(“body”).selectAll(“div”) .data([“#f00”,”#f90”,”#ff0”]) .style({ background: function(d,i){ return d; }, color: “#009”
})
v = d3.select(“body”).selectAll(“div”) .data([“#f00”,”#f90”,”#ff0”]) v.exit().remove(); v.enter().append(“div”); d3.select(“body”).selectAll(“div”) .style({ background: function(d,i){
return d; }, color: “#009” }) .text(function(d) { return d; });
Topic 2 - Utilities
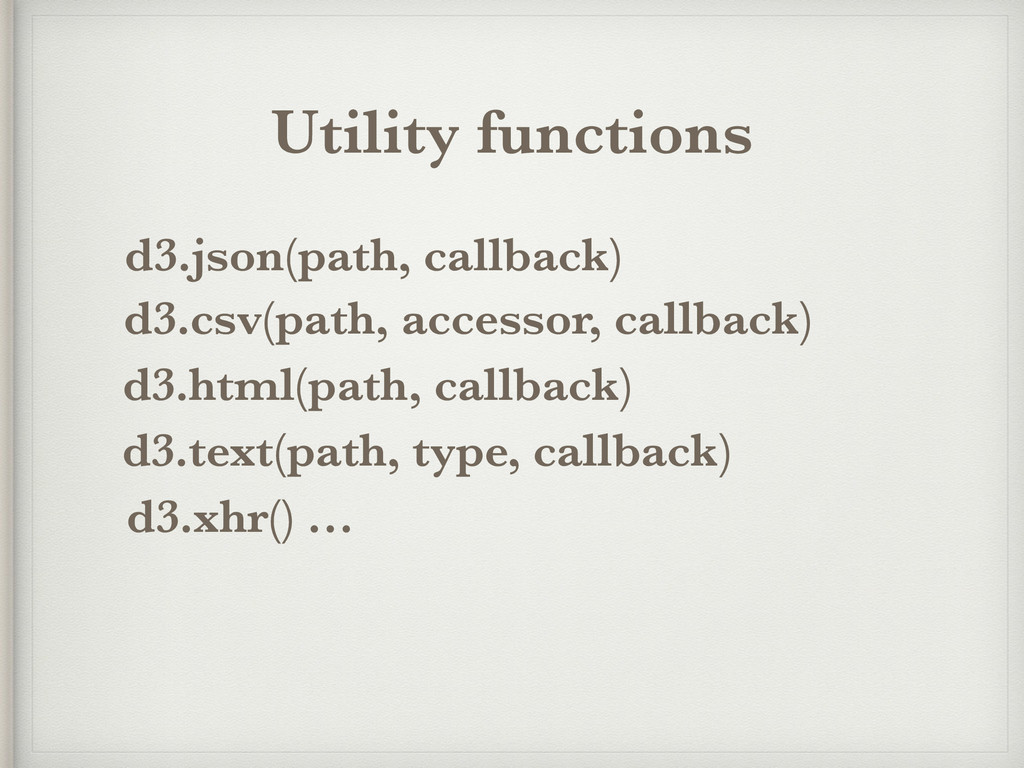
Utility functions d3.json(path, callback) d3.csv(path, accessor, callback) d3.html(path, callback) d3.text(path,
type, callback) d3.xhr() …
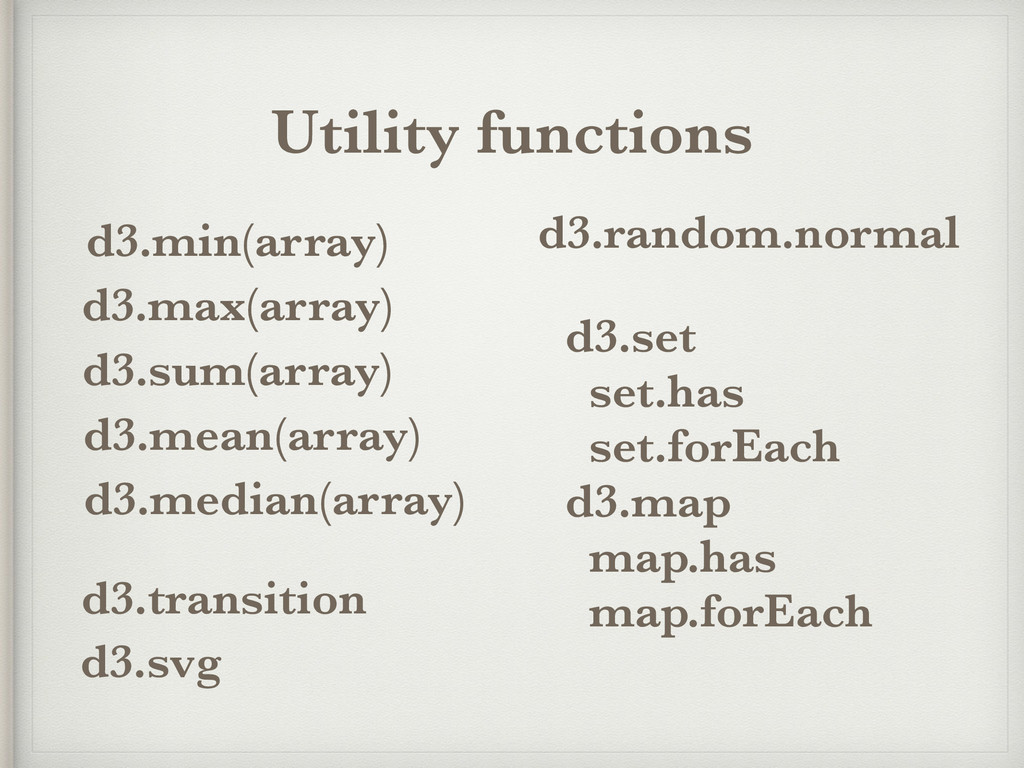
Utility functions d3.min(array) d3.max(array) d3.sum(array) d3.mean(array) d3.median(array) d3.random.normal d3.set set.has
set.forEach d3.map map.has map.forEach d3.transition d3.svg
Scale functions d3.scale.linear().domain(array).range(array) radius = d3.scale.linear() .domain([d3.min(data), d3.max(data)]) .range([“#f00”,”#00f”]) ticks
= radius.ticks(20); d3.scale.pow().exponent(3).domain(array).range(array) d3.scale.log().domain(array).range(array)
Scale functions d3.scale.linear() .domain([0,100]) .range([“#000”,”#f00”]) d3.scale.category10() d3.scale.category20() d3.scale.category20b() d3.scale.category20c()
Topic 3 - Layout
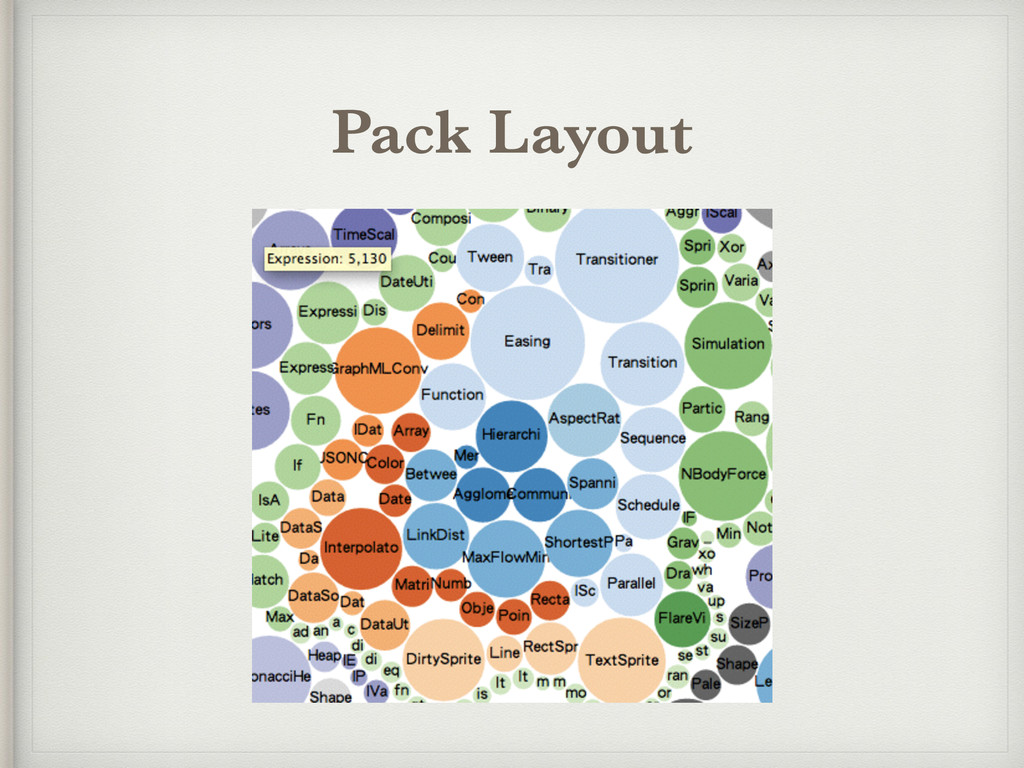
Pack Layout
Pack Layout nodes = d3.layout.pack().size([w,h]) .nodes(data) structure of data: {
value: ?, children: [ ] } { value: ?, children: [ ], parent, depth, x, y, r }
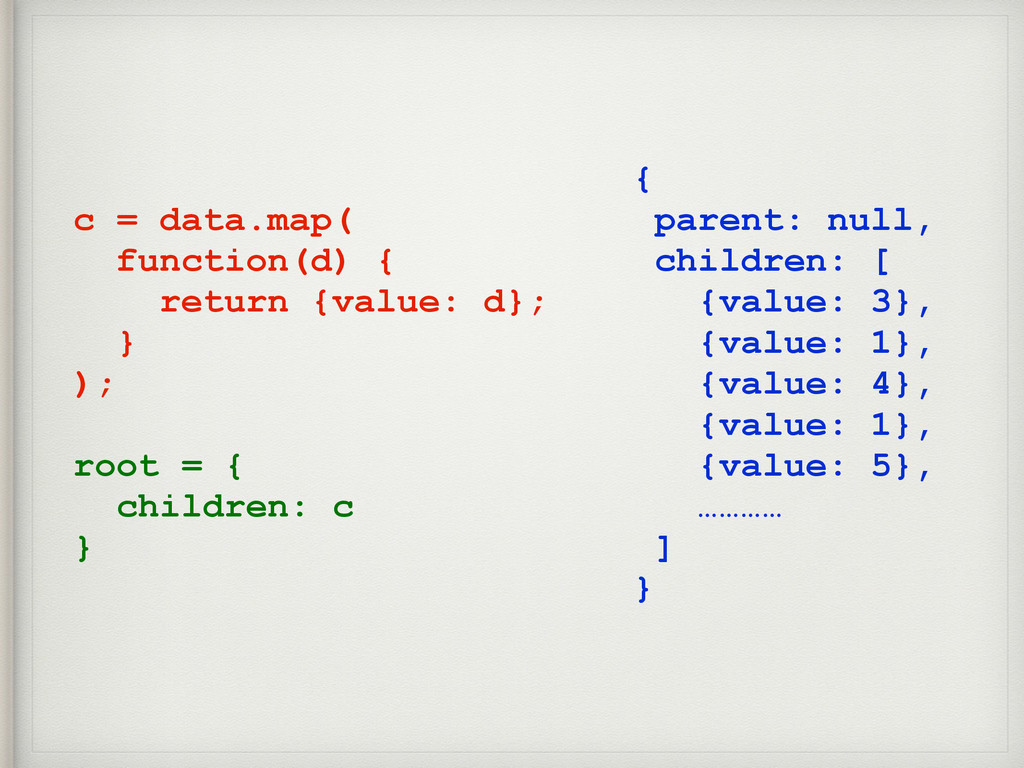
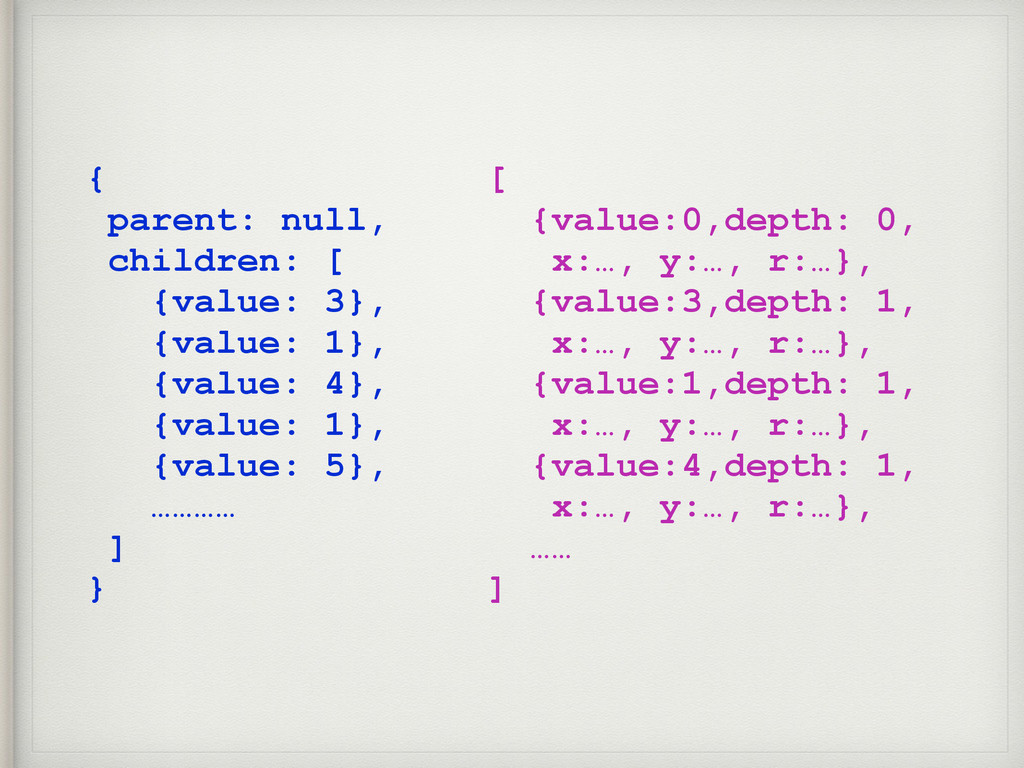
{ parent: null, children: [ {value: 3}, {value: 1}, {value:
4}, {value: 1}, {value: 5}, ………… ] } c = data.map( function(d) { return {value: d}; } ); root = { children: c }
{ parent: null, children: [ {value: 3}, {value: 1}, {value:
4}, {value: 1}, {value: 5}, ………… ] } [ {value:0,depth: 0, x:…, y:…, r:…}, {value:3,depth: 1, x:…, y:…, r:…}, {value:1,depth: 1, x:…, y:…, r:…}, {value:4,depth: 1, x:…, y:…, r:…}, …… ]
Pack Layout d3.layout.pack() .sort(function(a,b) {…}) .padding(5) .size([w,h]) .nodes(data) d3.layout.pack().links(nodes) {
source: <node>, target: <node> }
Partition Layout d3.layout.partition() .sort(function(a,b) {…}) .size([w,h]) .nodes(data) d3.layout.partition().links(data) { value:
?, children: [], parent, depth, x, y, r, dx, dy }
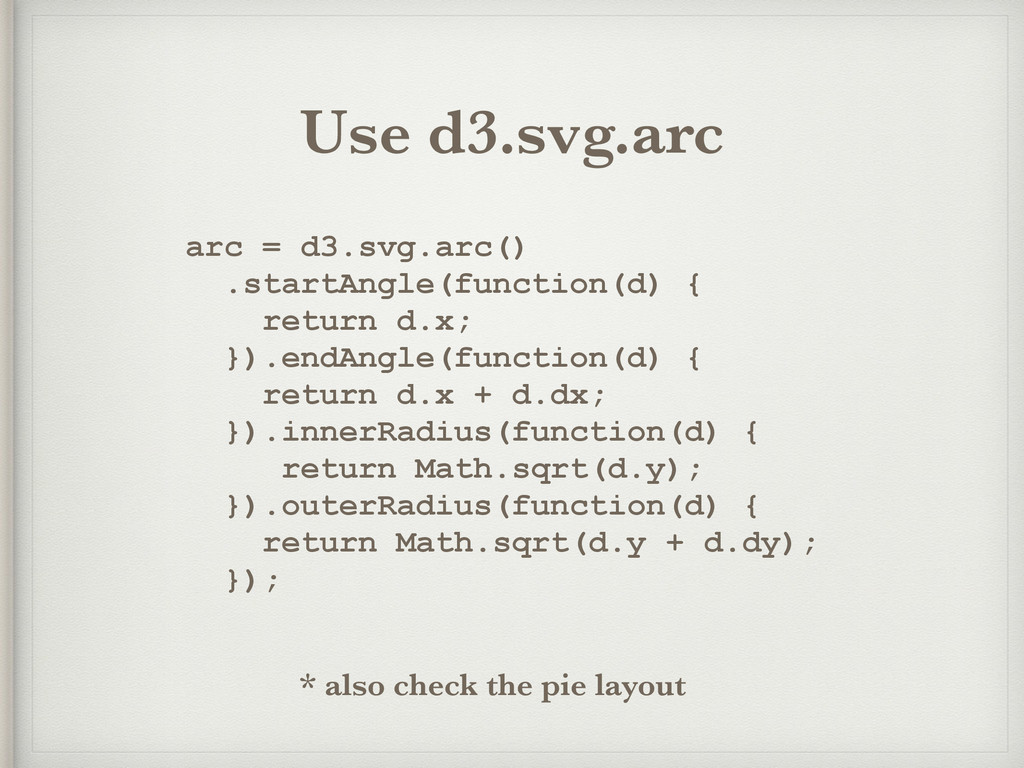
arc = d3.svg.arc() .startAngle(function(d) { return d.x; }).endAngle(function(d) { return
d.x + d.dx; }).innerRadius(function(d) { return Math.sqrt(d.y); }).outerRadius(function(d) { return Math.sqrt(d.y + d.dy); }); Use d3.svg.arc * also check the pie layout
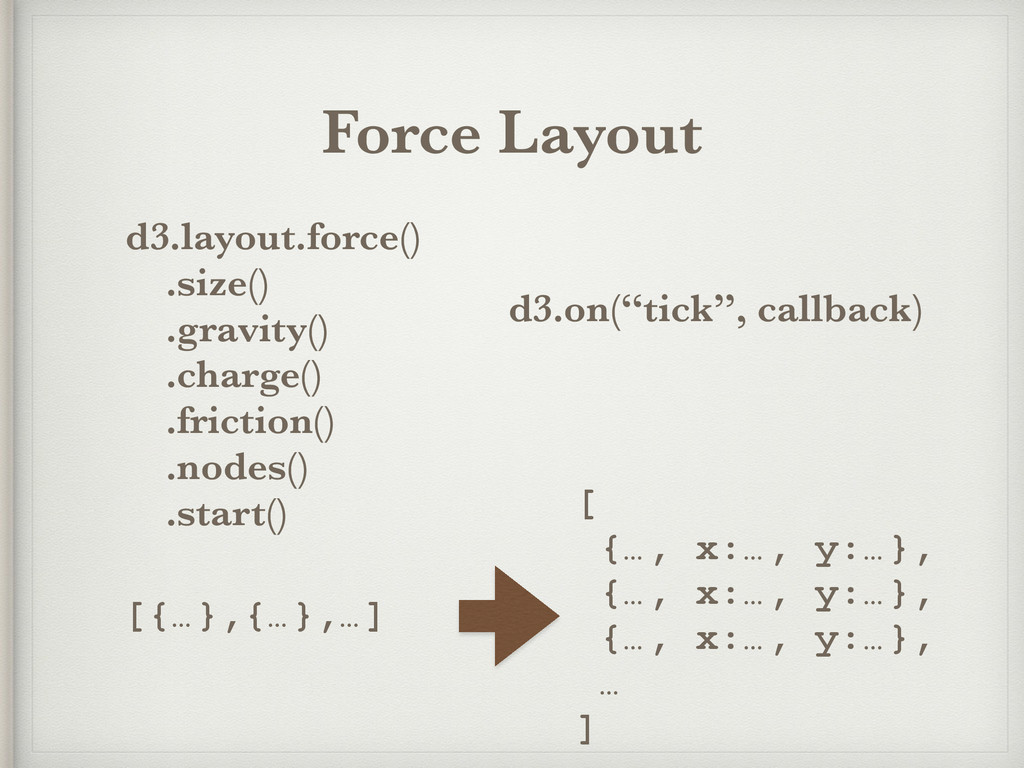
Force Layout d3.layout.force() .size() .gravity() .charge() .friction() .nodes() .start() d3.on(“tick”,
callback) [{…},{…},…] [ {…, x:…, y:…}, {…, x:…, y:…}, {…, x:…, y:…}, … ]
data = [1,2,3,4].map(function(d) { return {v:d}; }); force = d3.layout.force().nodes(data);
force.on(“tick”, function() { d3.selectAll(“…”).attr({ x: function(d) { return d.x; }, y: function(d) { return d.y; }, … }); force.start();
Cluster Layout d3.layout.cluster() .sort(function(a,b) {…}) .size([w,h]) .nodes(data) d3.layout.cluster().links(data) { value:
?, children: [], parent, depth, x, y }
![d3.select(“body”).selectAll(“div”) .data([“#f00”,”#f90”,”#ff0”]) .style({ background: function(d,i){ return d; }, color: “#009”](https://files.speakerdeck.com/presentations/fa20bc0b6a30435383d3110a31e80c78/slide_56.jpg)
![v = d3.select(“body”).selectAll(“div”) .data([“#f00”,”#f90”,”#ff0”]) v.exit().remove(); v.enter().append(“div”); d3.select(“body”).selectAll(“div”) .style({ background: function(d,i){](https://files.speakerdeck.com/presentations/fa20bc0b6a30435383d3110a31e80c78/slide_57.jpg)
![Scale functions d3.scale.linear().domain(array).range(array) radius = d3.scale.linear() .domain([d3.min(data), d3.max(data)]) .range([“#f00”,”#00f”]) ticks](https://files.speakerdeck.com/presentations/fa20bc0b6a30435383d3110a31e80c78/slide_61.jpg)
![Scale functions d3.scale.linear() .domain([0,100]) .range([“#000”,”#f00”]) d3.scale.category10() d3.scale.category20() d3.scale.category20b() d3.scale.category20c()](https://files.speakerdeck.com/presentations/fa20bc0b6a30435383d3110a31e80c78/slide_62.jpg)
![Pack Layout nodes = d3.layout.pack().size([w,h]) .nodes(data) structure of data: {](https://files.speakerdeck.com/presentations/fa20bc0b6a30435383d3110a31e80c78/slide_65.jpg)
![Pack Layout d3.layout.pack() .sort(function(a,b) {…}) .padding(5) .size([w,h]) .nodes(data) d3.layout.pack().links(nodes) {](https://files.speakerdeck.com/presentations/fa20bc0b6a30435383d3110a31e80c78/slide_68.jpg)
![Partition Layout d3.layout.partition() .sort(function(a,b) {…}) .size([w,h]) .nodes(data) d3.layout.partition().links(data) { value:](https://files.speakerdeck.com/presentations/fa20bc0b6a30435383d3110a31e80c78/slide_69.jpg)
![data = [1,2,3,4].map(function(d) { return {v:d}; }); force = d3.layout.force().nodes(data);](https://files.speakerdeck.com/presentations/fa20bc0b6a30435383d3110a31e80c78/slide_72.jpg)
![Cluster Layout d3.layout.cluster() .sort(function(a,b) {…}) .size([w,h]) .nodes(data) d3.layout.cluster().links(data) { value:](https://files.speakerdeck.com/presentations/fa20bc0b6a30435383d3110a31e80c78/slide_73.jpg)