Iowa Project Lead The Way: Implications for Research, Policy, & Practice
Presented at the Center for Excellence in Science and Mathematics Education (CESME) Brown Bag Seminar at Iowa State University in Ames, Iowa on October 5, 2011.
PRACTICE Tom Schenk, Jr., Iowa Department of Education David Rethwisch, University of Iowa Soko Starobin, Iowa State University Melissa Chapman Haynes, PDA, Inc. & Consultant Frankie Santos Laanan, Iowa State University Presented at CESMEE Brown Bag Seminar October 5, 2011
been a focus for the U.S. higher education in the past decades. Project Lead The Way (PLTW) Aims to provides middle school and high school students with a seamless path to college and career success in STEM-related fields. Aims to expand the proportion of students who persist in STEM fields. 2
for secondary students. Problem-based/Project-based Learning (PBL) approach to increase engagement & performance. Provides “dual-credit” for students in either CTE or A&S areas depending upon performance. 3
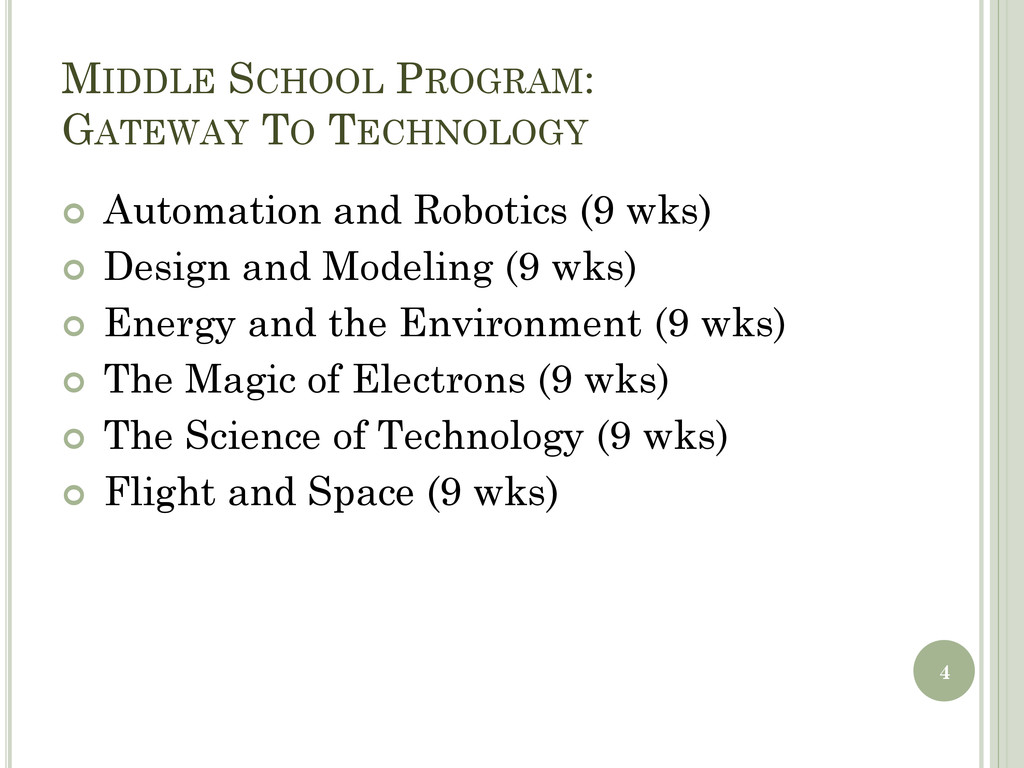
(9 wks) Design and Modeling (9 wks) Energy and the Environment (9 wks) The Magic of Electrons (9 wks) The Science of Technology (9 wks) Flight and Space (9 wks) 4
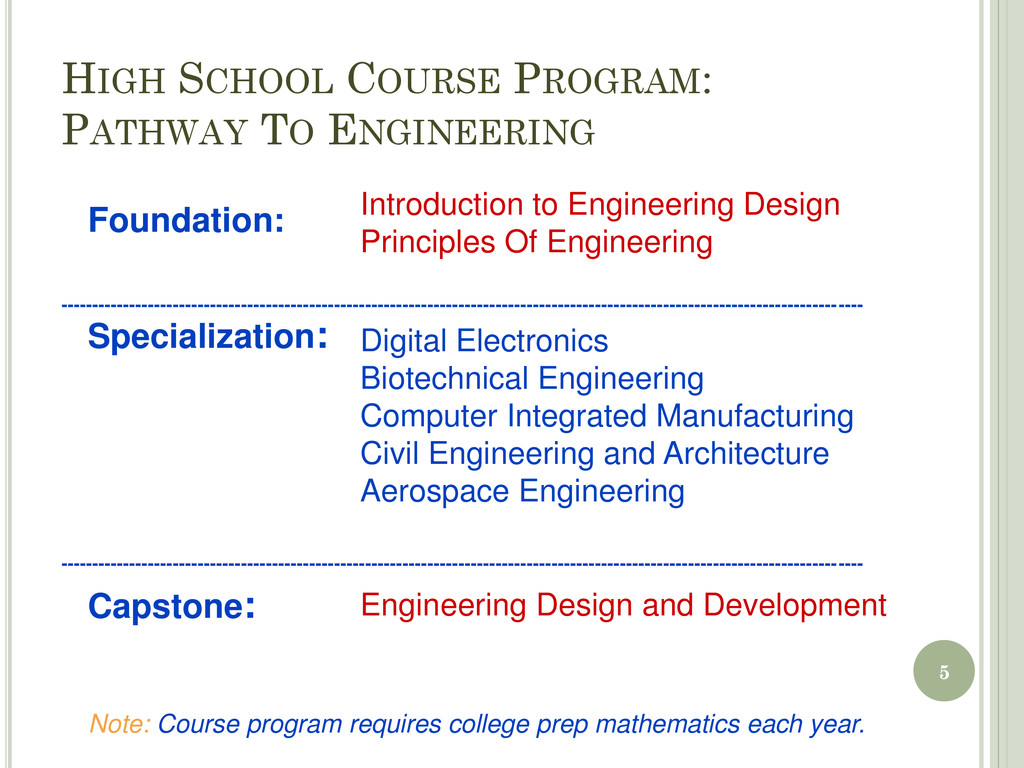
Specialization: --------------------------------------------------------------------------------------------------------------------------------- Capstone: Digital Electronics Biotechnical Engineering Computer Integrated Manufacturing Civil Engineering and Architecture Aerospace Engineering Introduction to Engineering Design Principles Of Engineering Engineering Design and Development Note: Course program requires college prep mathematics each year.
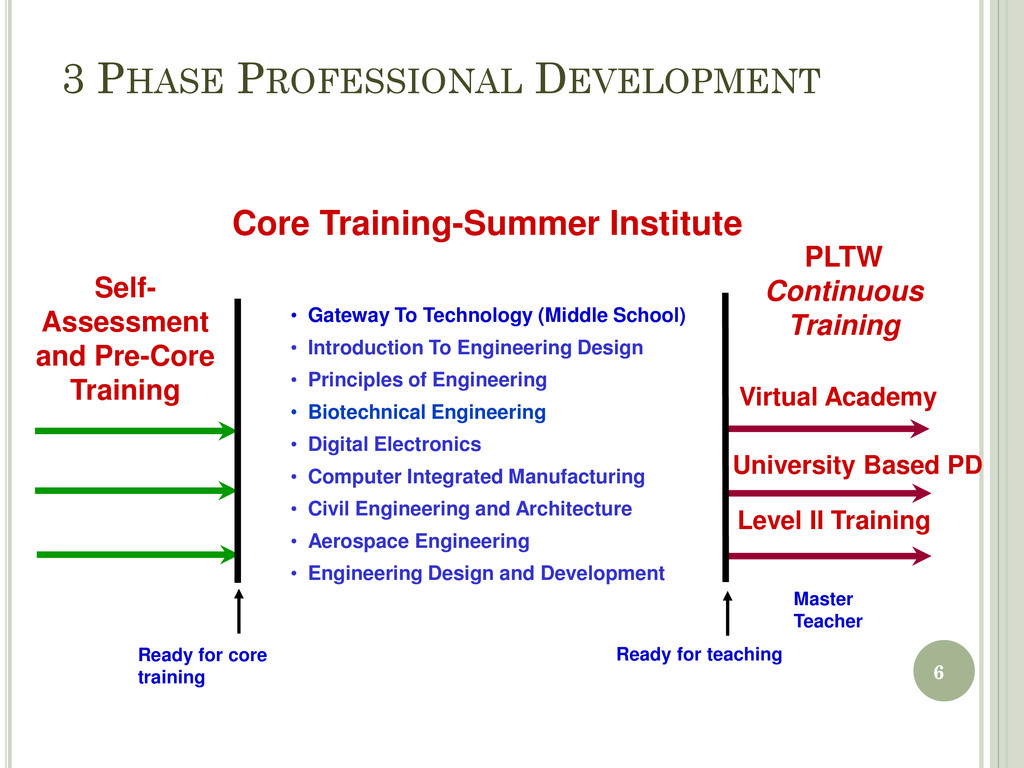
for teaching • Gateway To Technology (Middle School) • Introduction To Engineering Design • Principles of Engineering • Biotechnical Engineering • Digital Electronics • Computer Integrated Manufacturing • Civil Engineering and Architecture • Aerospace Engineering • Engineering Design and Development Core Training-Summer Institute Self- Assessment and Pre-Core Training PLTW Continuous Training Master Teacher Virtual Academy University Based PD Level II Training
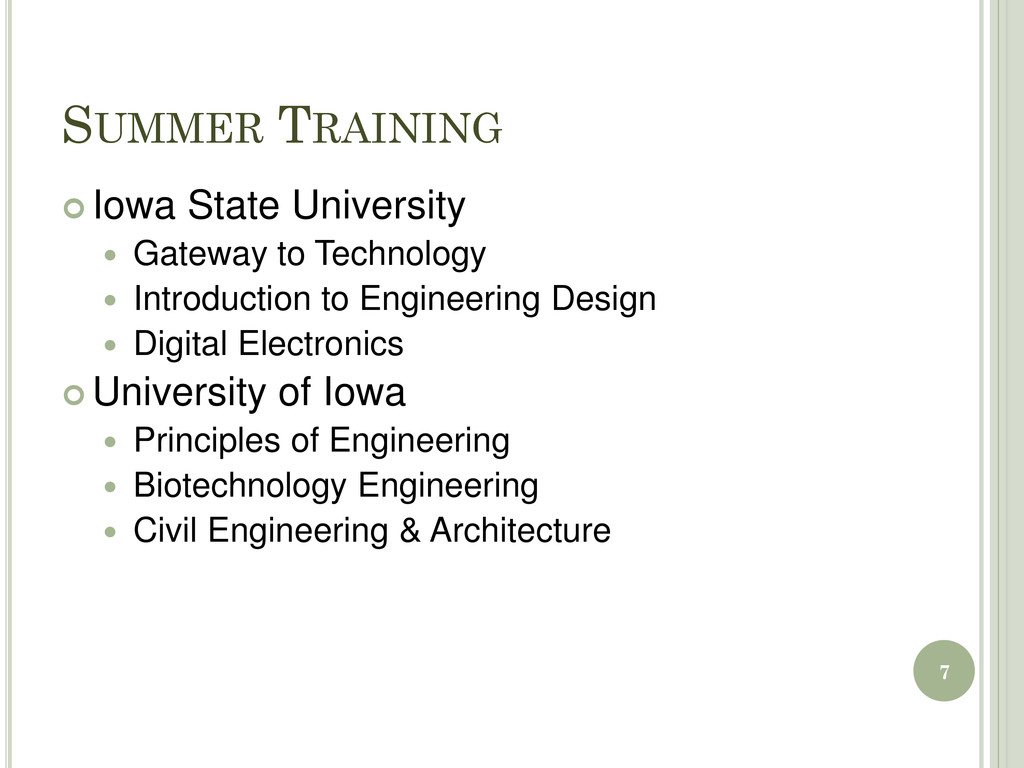
Introduction to Engineering Design Digital Electronics University of Iowa Principles of Engineering Biotechnology Engineering Civil Engineering & Architecture 7
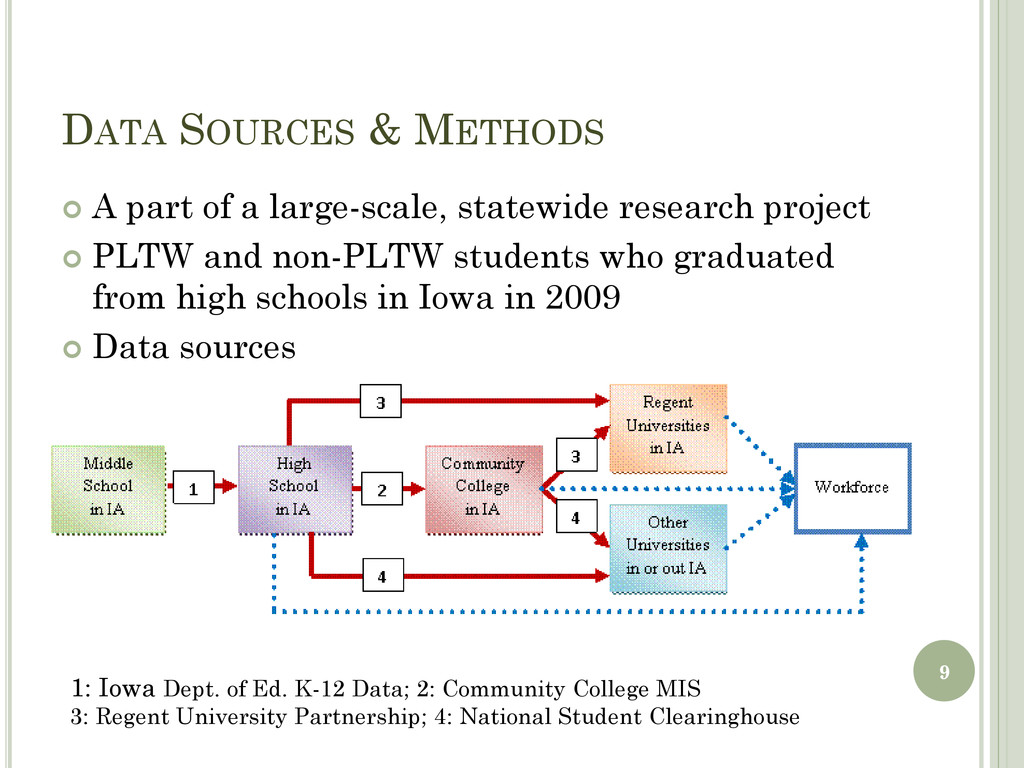
statewide research project PLTW and non-PLTW students who graduated from high schools in Iowa in 2009 Data sources 1: Iowa Dept. of Ed. K-12 Data; 2: Community College MIS 3: Regent University Partnership; 4: National Student Clearinghouse 9
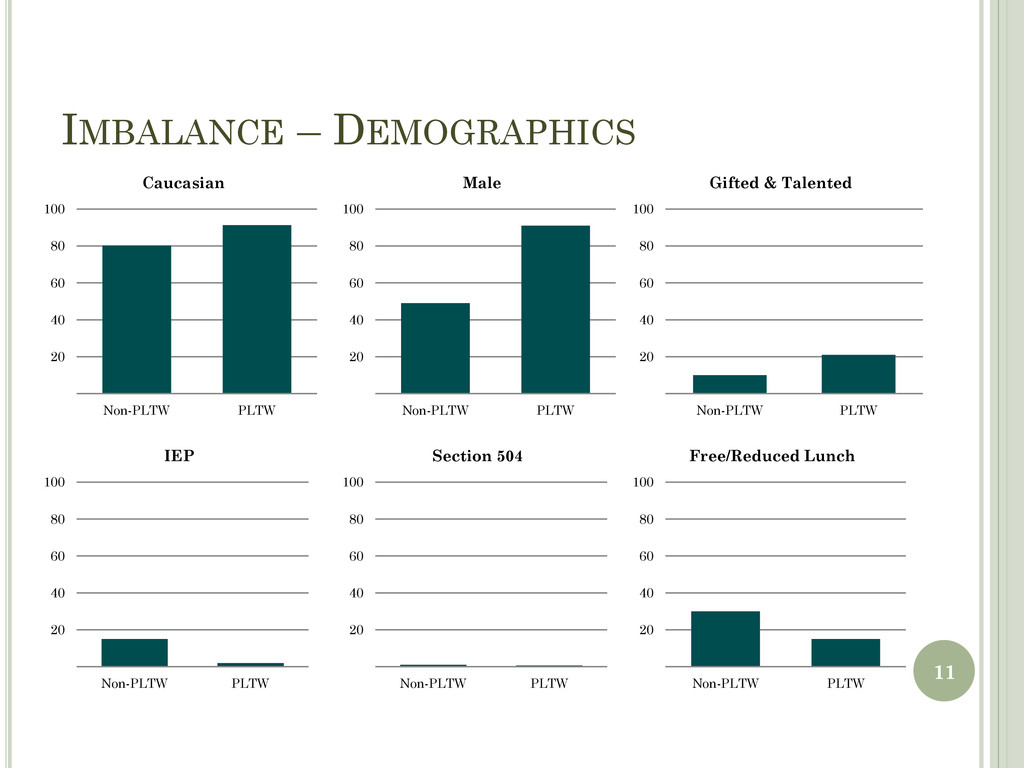
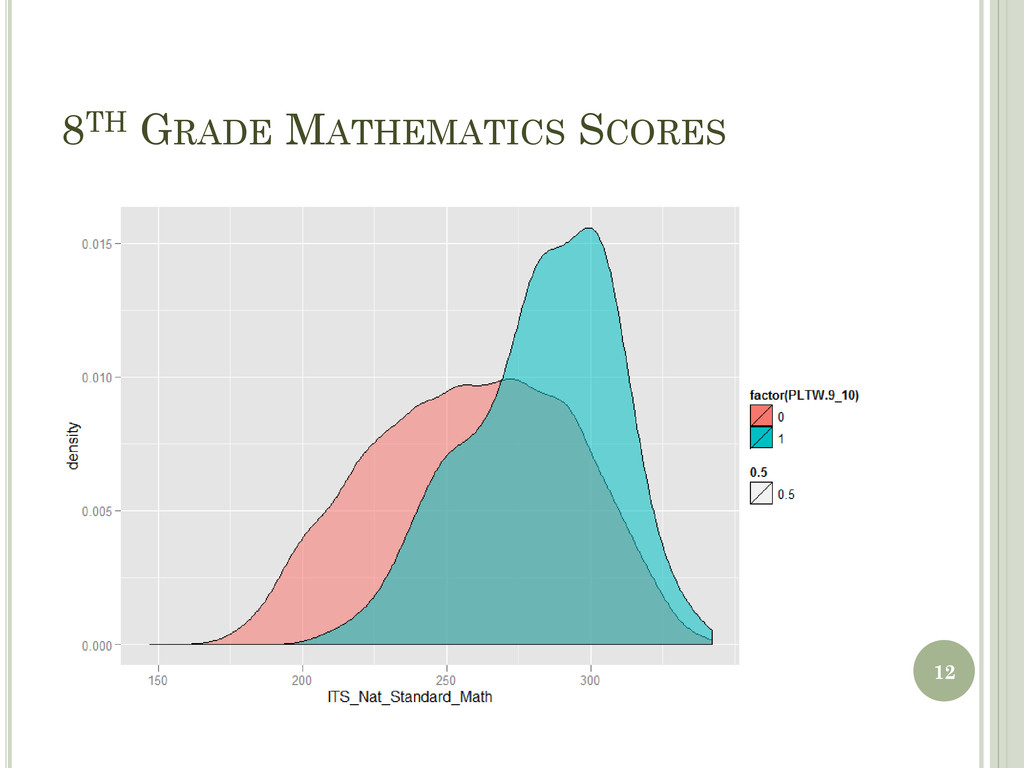
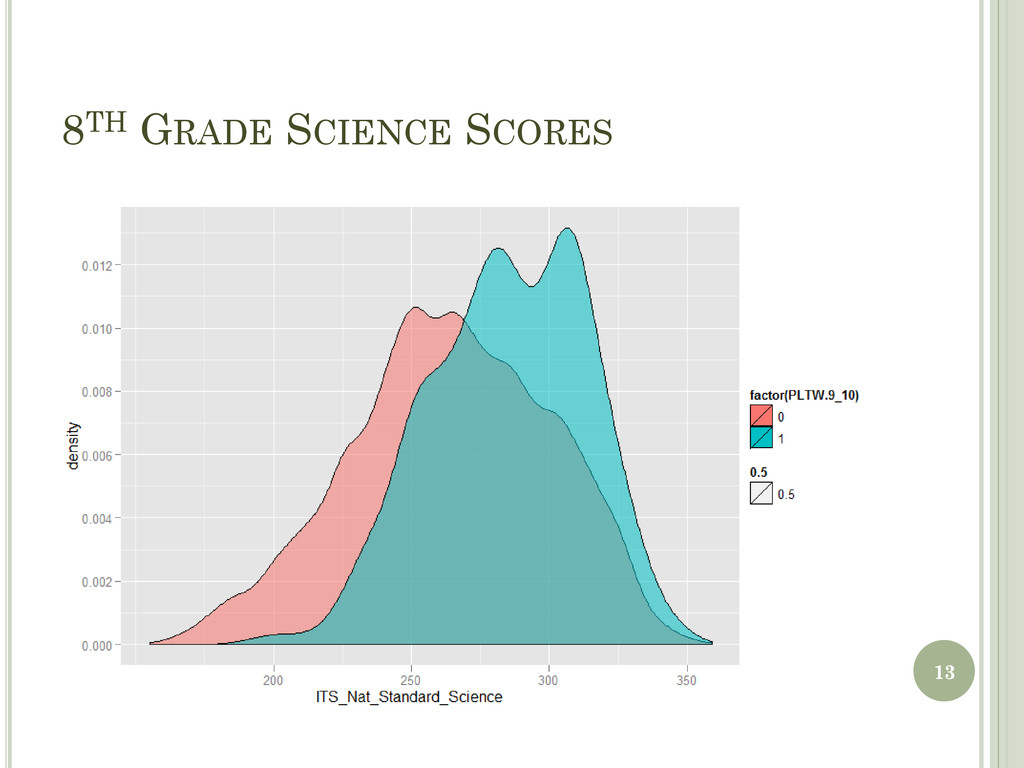
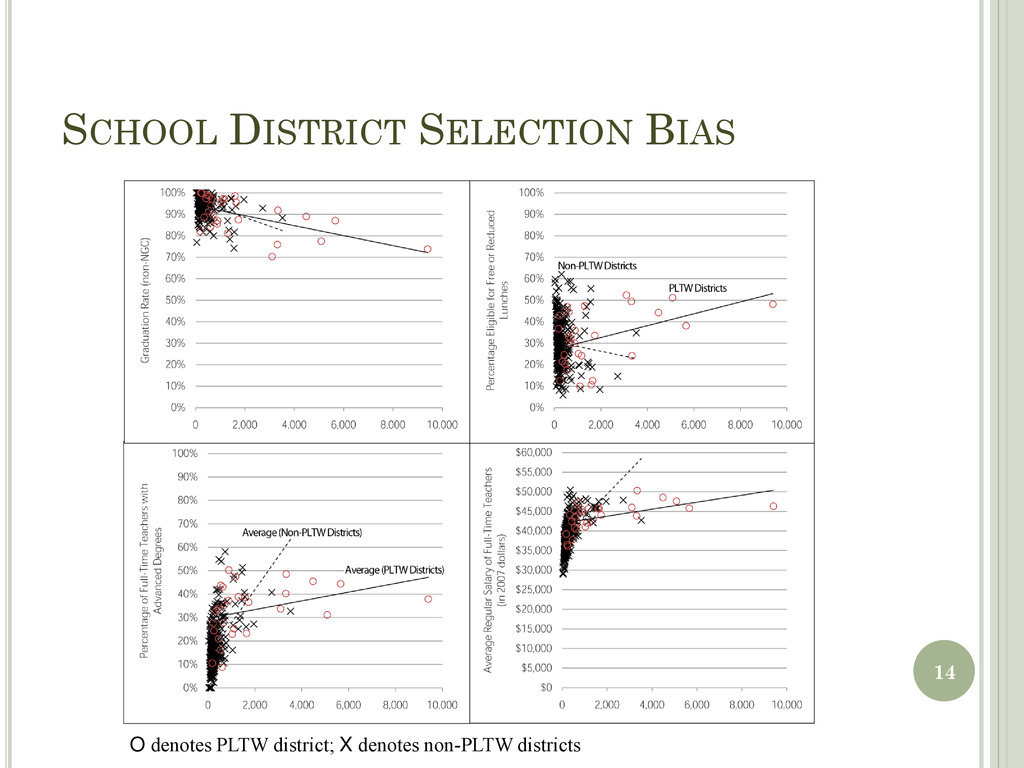
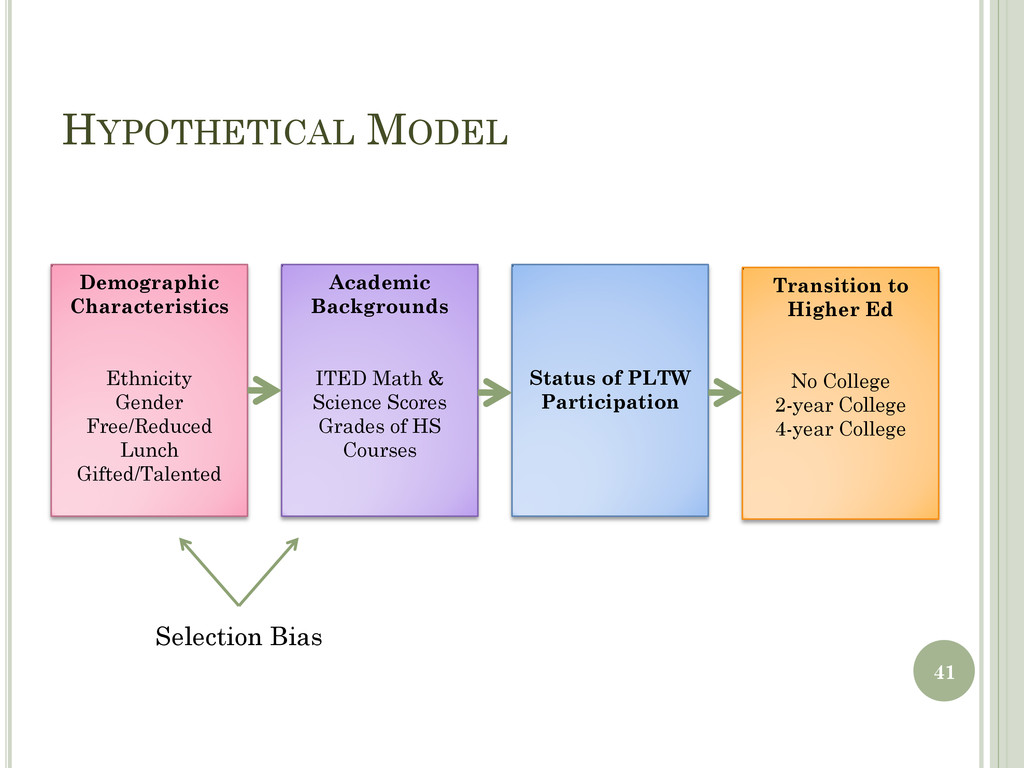
Backgrounds ITED Math & Science Scores Grades of HS Courses Status of PLTW Participation Transition to Higher Ed No College 2-year College 4-year College 10 Selection Bias
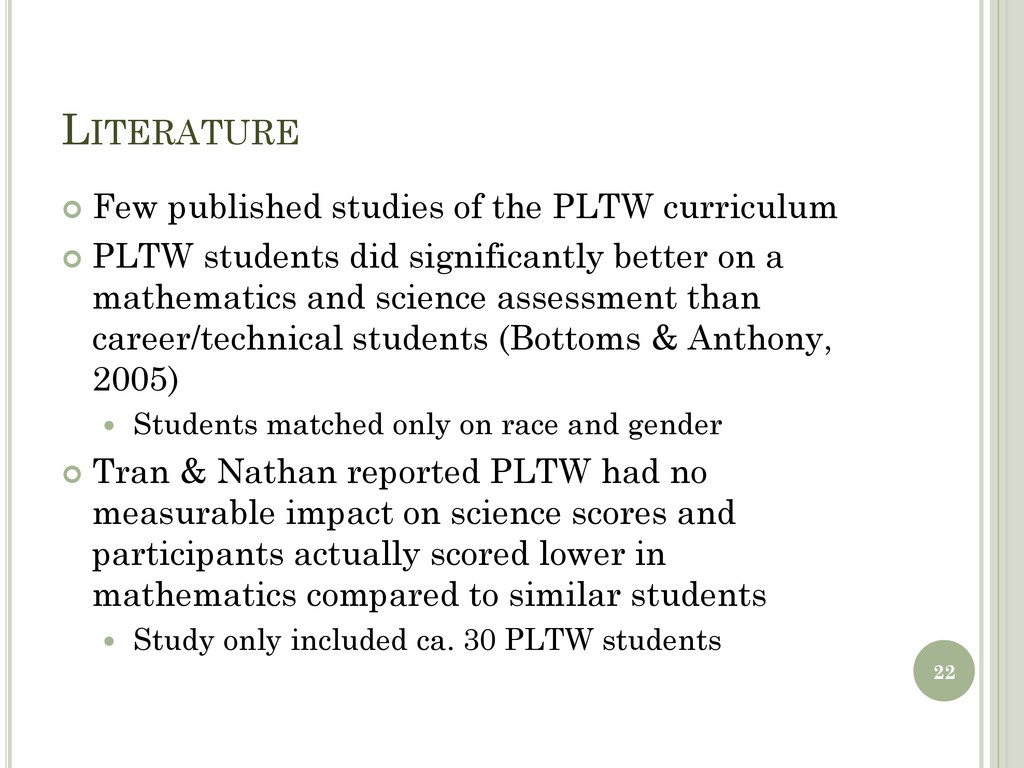
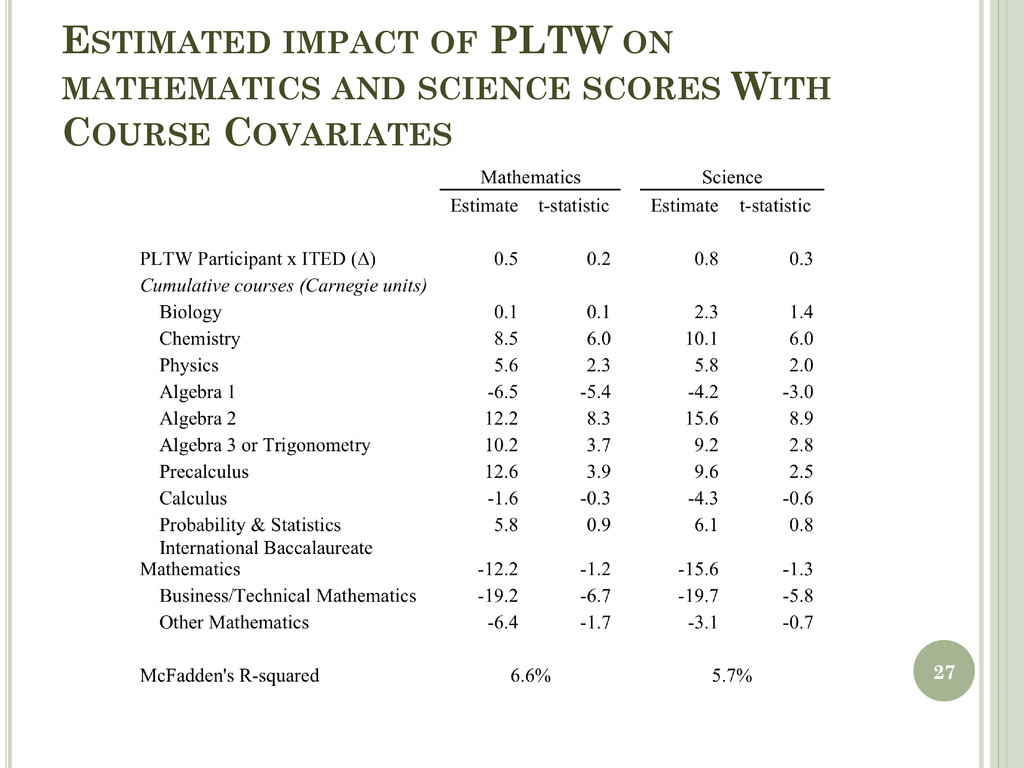
PLTW students did significantly better on a mathematics and science assessment than career/technical students (Bottoms & Anthony, 2005) Students matched only on race and gender Tran & Nathan reported PLTW had no measurable impact on science scores and participants actually scored lower in mathematics compared to similar students Study only included ca. 30 PLTW students 22
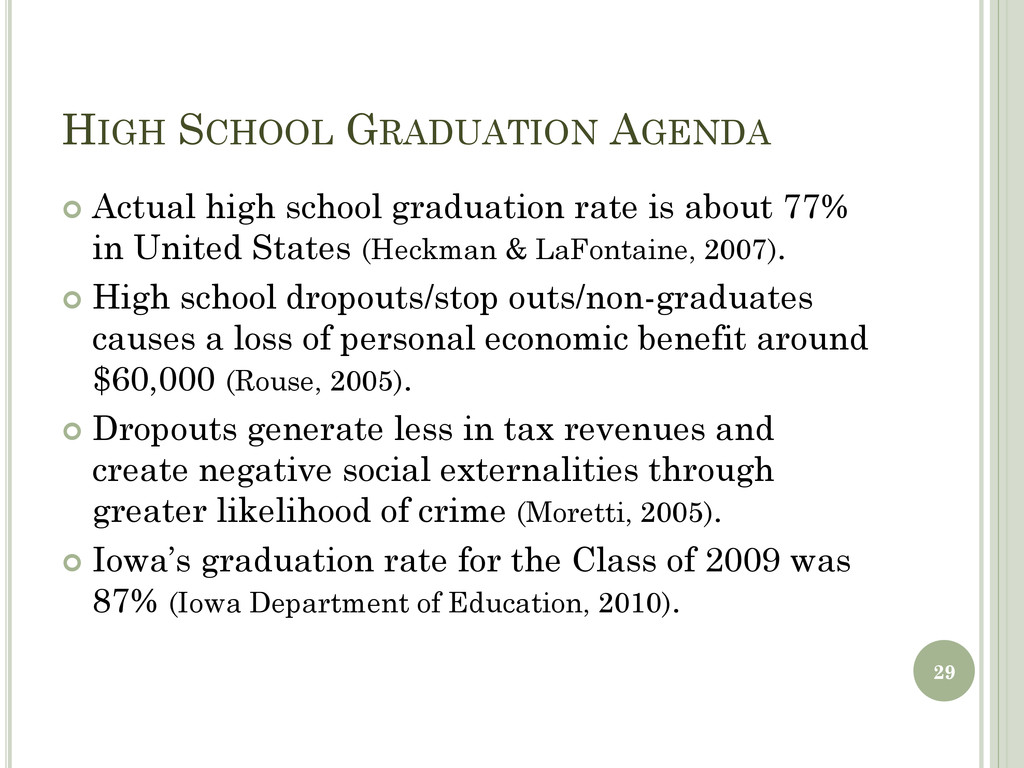
is about 77% in United States (Heckman & LaFontaine, 2007). High school dropouts/stop outs/non-graduates causes a loss of personal economic benefit around $60,000 (Rouse, 2005). Dropouts generate less in tax revenues and create negative social externalities through greater likelihood of crime (Moretti, 2005). Iowa’s graduation rate for the Class of 2009 was 87% (Iowa Department of Education, 2010). 29
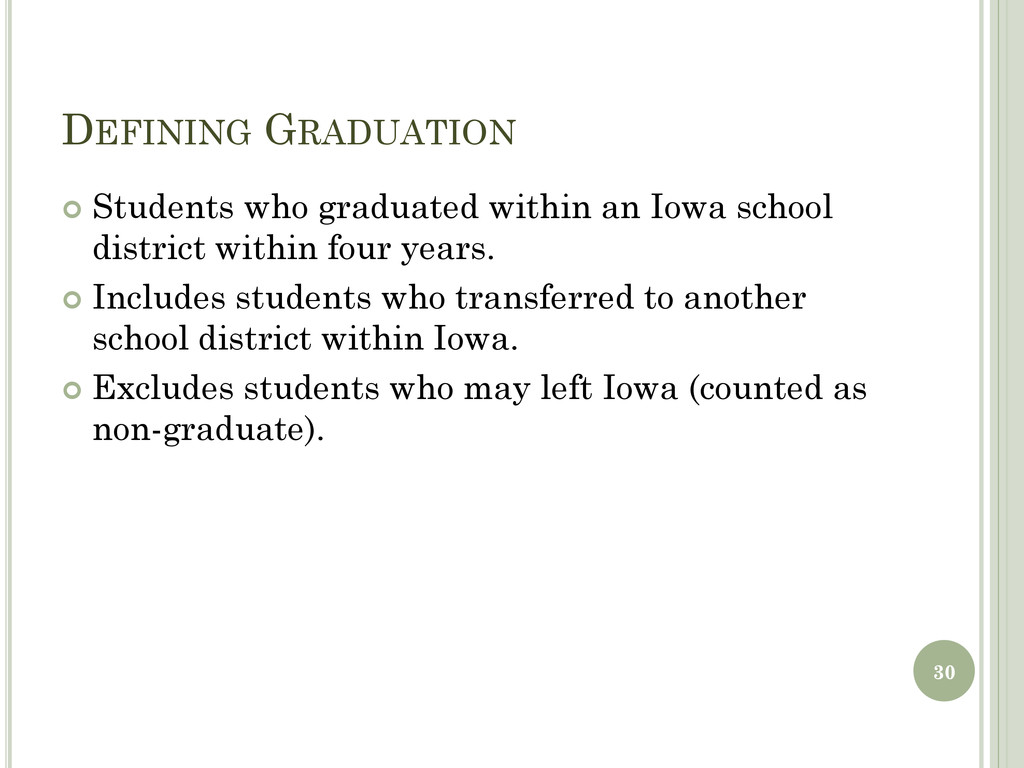
district within four years. Includes students who transferred to another school district within Iowa. Excludes students who may left Iowa (counted as non-graduate). 30
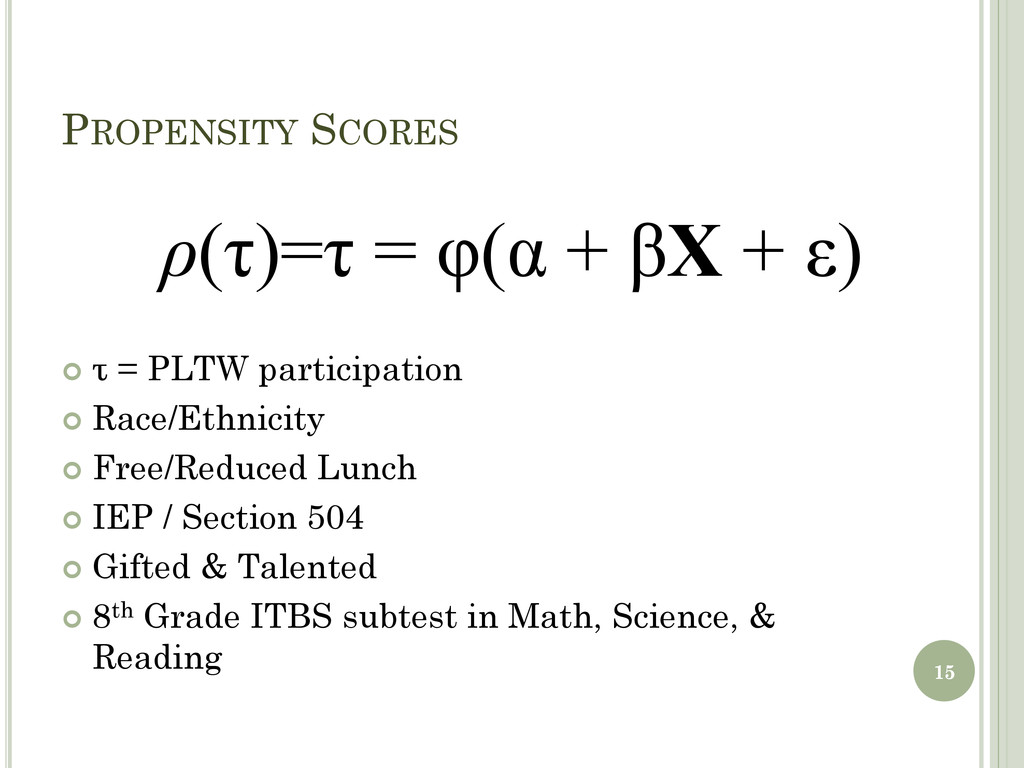
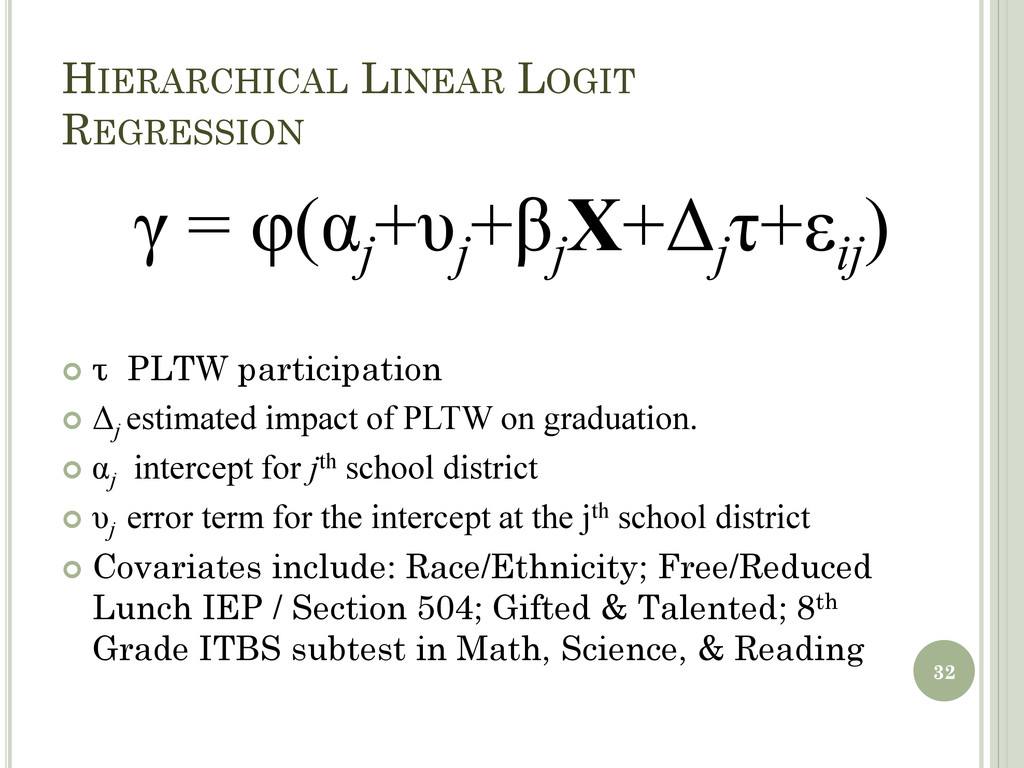
X+Δj τ+εij ) τ PLTW participation Δj estimated impact of PLTW on graduation. αj intercept for jth school district υj error term for the intercept at the jth school district Covariates include: Race/Ethnicity; Free/Reduced Lunch IEP / Section 504; Gifted & Talented; 8th Grade ITBS subtest in Math, Science, & Reading
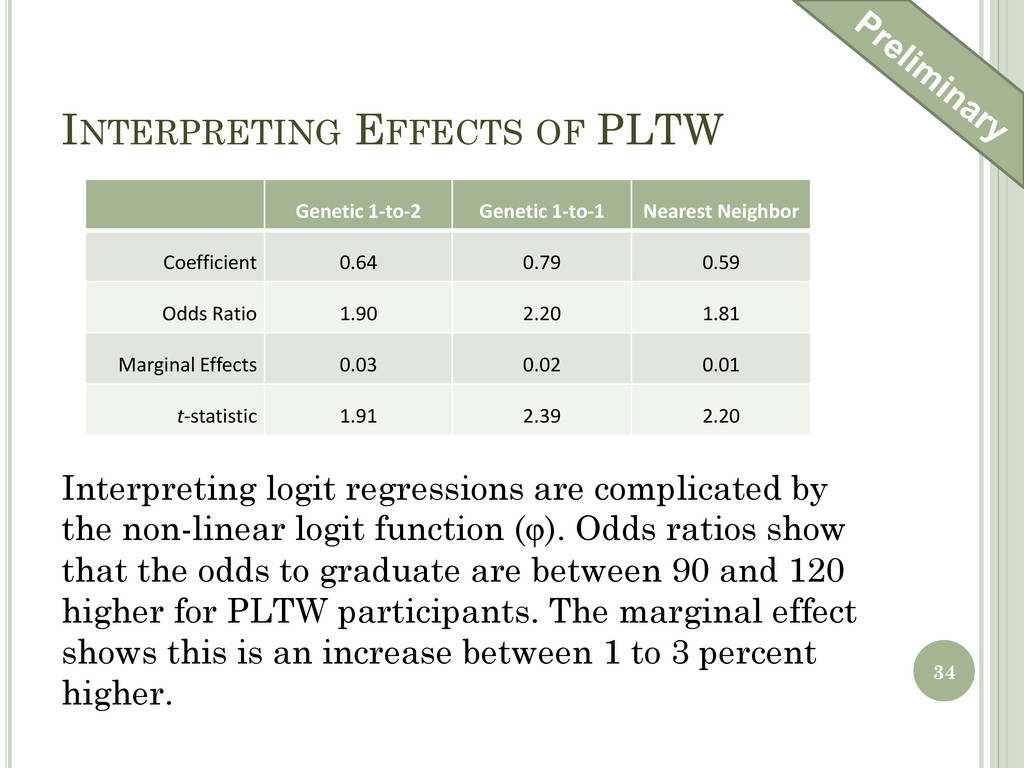
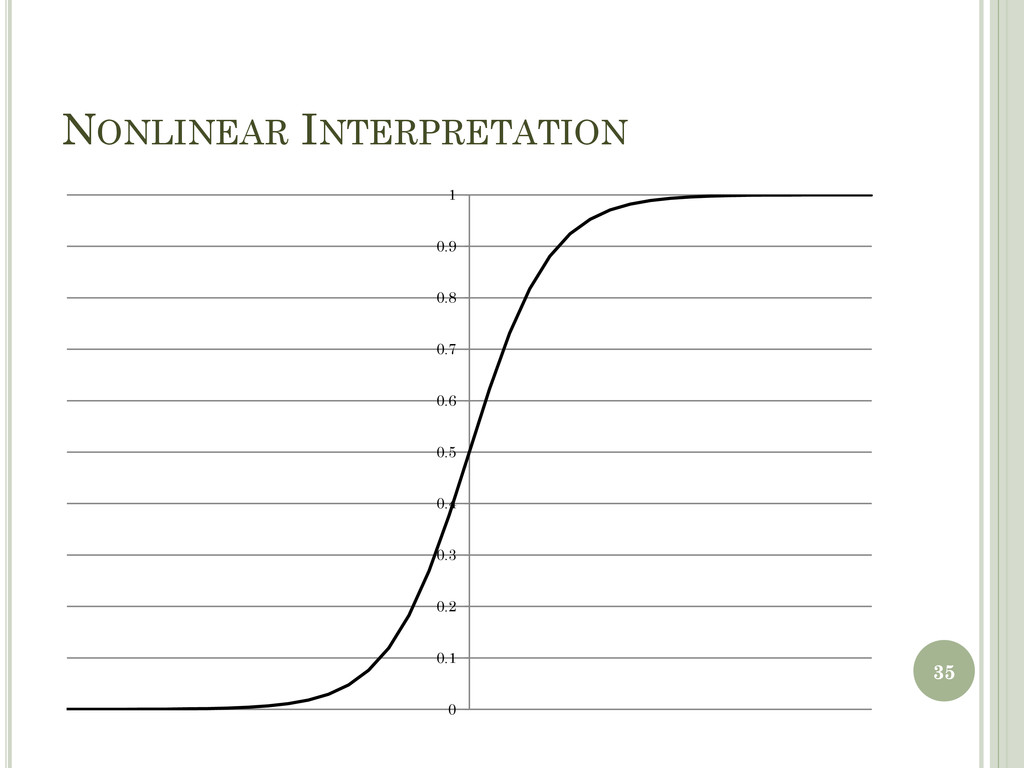
Neighbor Coefficient 0.64 0.79 0.59 Odds Ratio 1.90 2.20 1.81 Marginal Effects 0.03 0.02 0.01 t-statistic 1.91 2.39 2.20 Interpreting logit regressions are complicated by the non-linear logit function (φ). Odds ratios show that the odds to graduate are between 90 and 120 higher for PLTW participants. The marginal effect shows this is an increase between 1 to 3 percent higher.
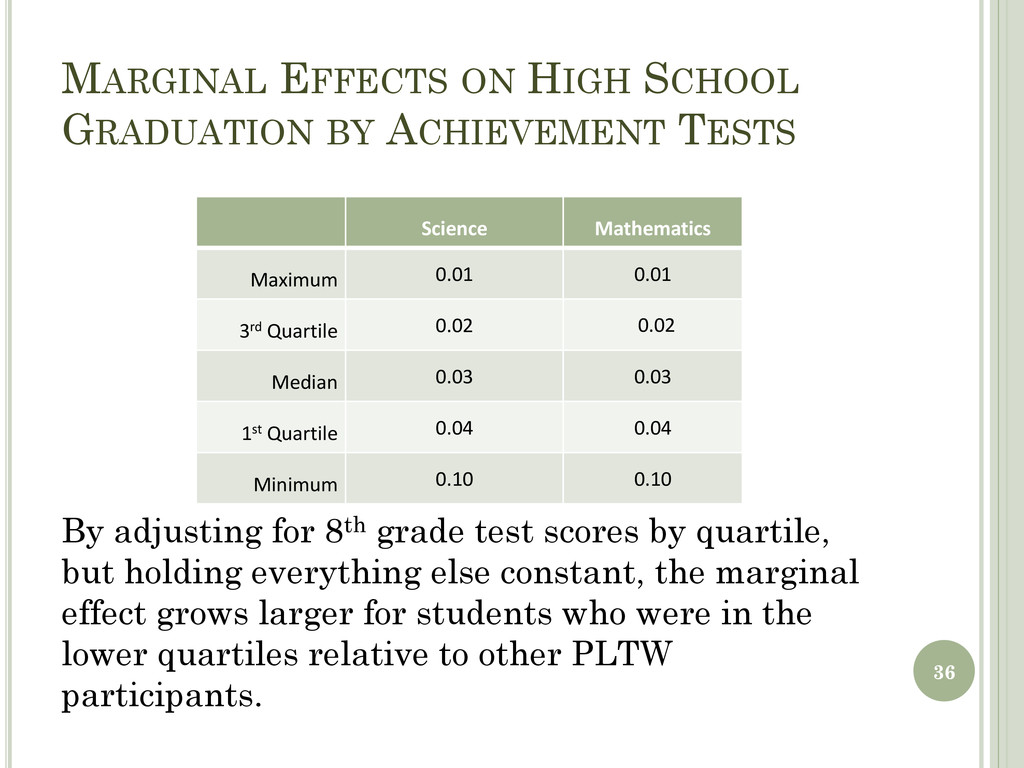
Science Mathematics Maximum 0.01 0.01 3rd Quartile 0.02 0.02 Median 0.03 0.03 1st Quartile 0.04 0.04 Minimum 0.10 0.10 By adjusting for 8th grade test scores by quartile, but holding everything else constant, the marginal effect grows larger for students who were in the lower quartiles relative to other PLTW participants.
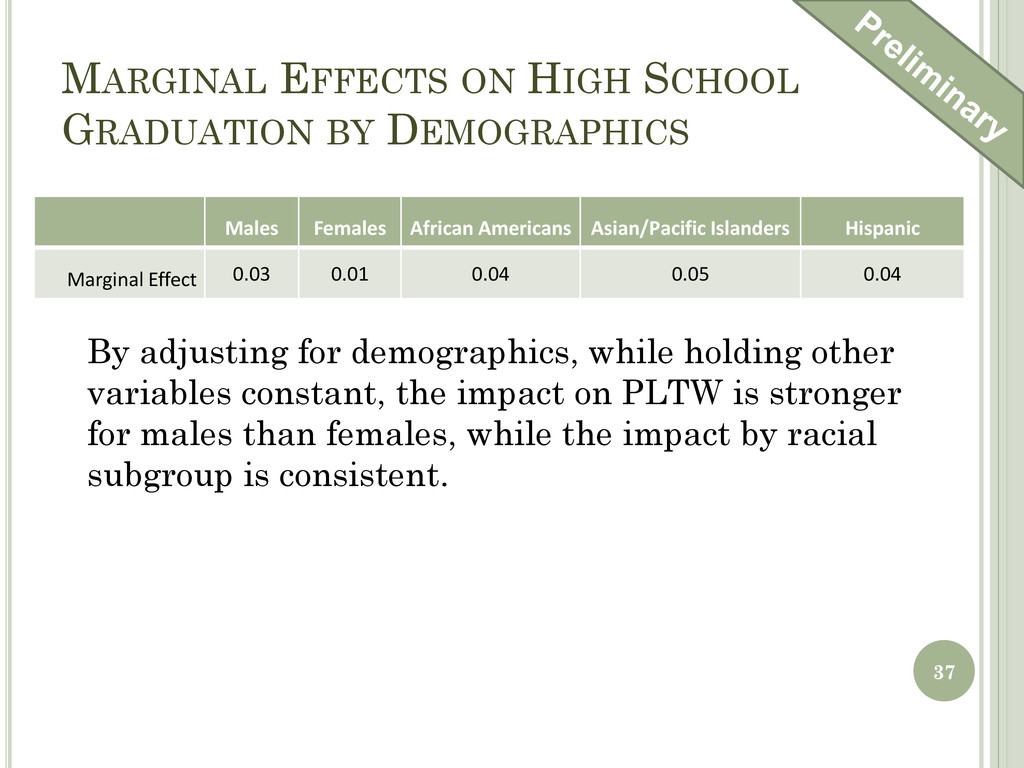
Females African Americans Asian/Pacific Islanders Hispanic Marginal Effect 0.03 0.01 0.04 0.05 0.04 By adjusting for demographics, while holding other variables constant, the impact on PLTW is stronger for males than females, while the impact by racial subgroup is consistent.
regard to maintain the global leadership and competitiveness in science and technology. In order to maintain the leadership and competitiveness, we must grow a strong, talented and innovative science and technology workforce. Expanding the pool of engineers and scientists has been a focus for the U.S. higher education in the past decades. Specifically, the critical role of community college education in STEM fields has been recognized in the past several years. 38
student background and precollege characteristics structural and organization characteristics of the institution institutional environment interactions with socializing agents quality of student effort 39
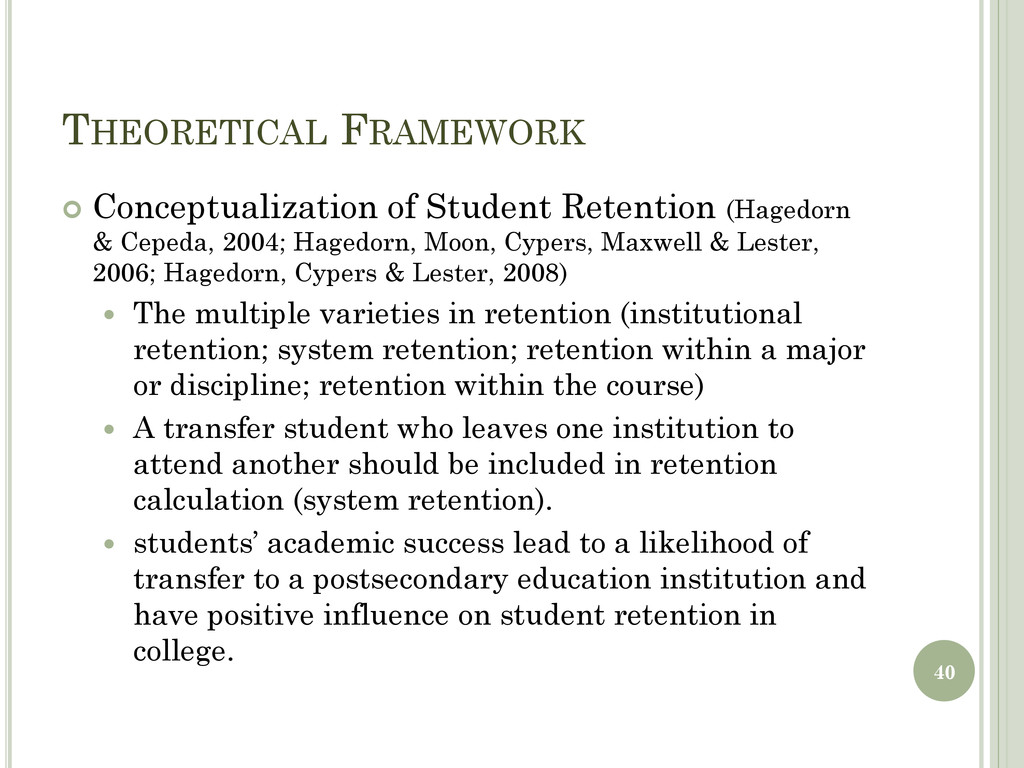
2004; Hagedorn, Moon, Cypers, Maxwell & Lester, 2006; Hagedorn, Cypers & Lester, 2008) The multiple varieties in retention (institutional retention; system retention; retention within a major or discipline; retention within the course) A transfer student who leaves one institution to attend another should be included in retention calculation (system retention). students’ academic success lead to a likelihood of transfer to a postsecondary education institution and have positive influence on student retention in college. 40
Backgrounds ITED Math & Science Scores Grades of HS Courses Status of PLTW Participation Transition to Higher Ed No College 2-year College 4-year College 41 Selection Bias
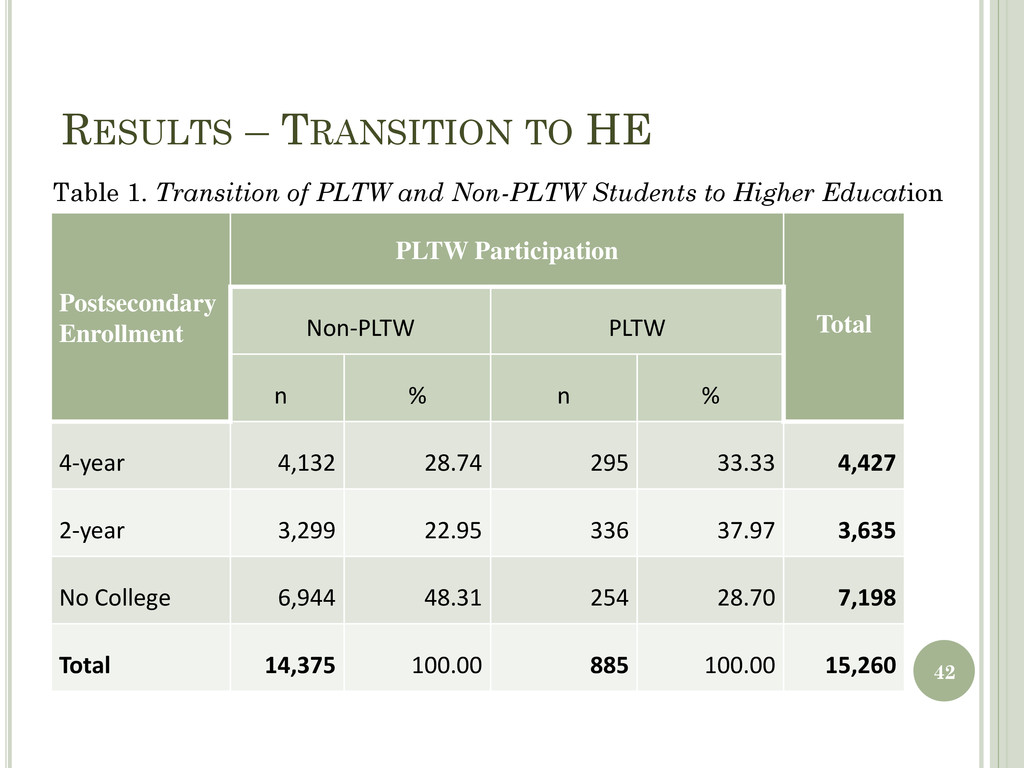
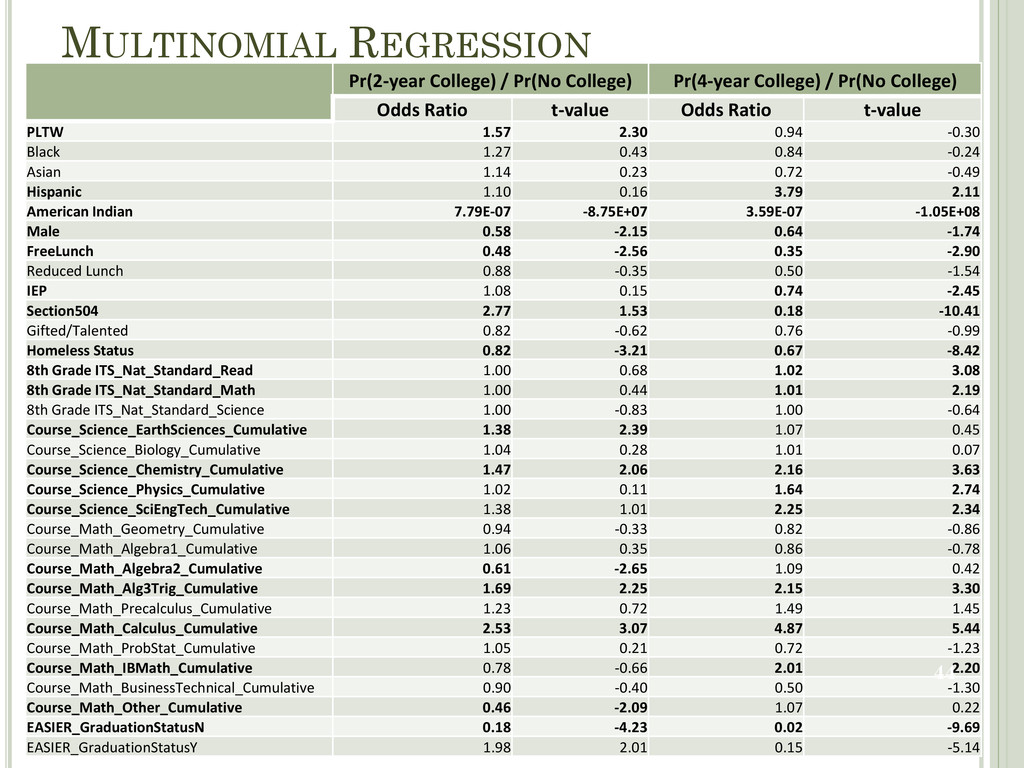
Non-PLTW PLTW n % n % 4-year 4,132 28.74 295 33.33 4,427 2-year 3,299 22.95 336 37.97 3,635 No College 6,944 48.31 254 28.70 7,198 Total 14,375 100.00 885 100.00 15,260 Table 1. Transition of PLTW and Non-PLTW Students to Higher Education 42
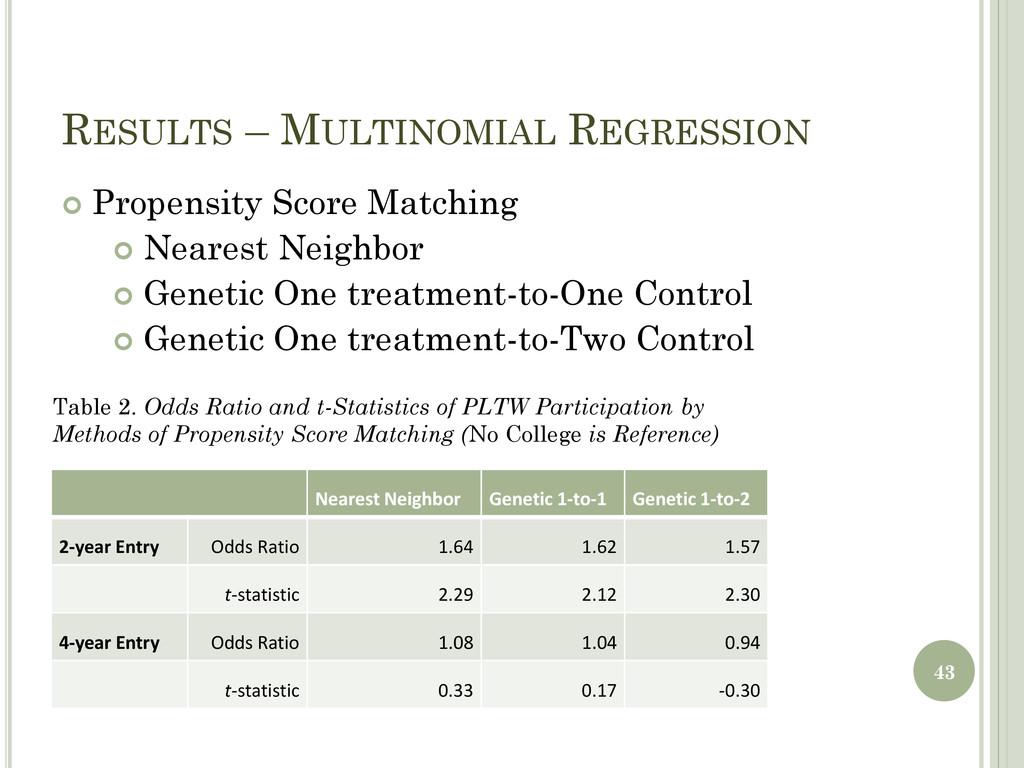
2-year Entry Odds Ratio 1.64 1.62 1.57 t-statistic 2.29 2.12 2.30 4-year Entry Odds Ratio 1.08 1.04 0.94 t-statistic 0.33 0.17 -0.30 Propensity Score Matching Nearest Neighbor Genetic One treatment-to-One Control Genetic One treatment-to-Two Control Table 2. Odds Ratio and t-Statistics of PLTW Participation by Methods of Propensity Score Matching (No College is Reference) 43
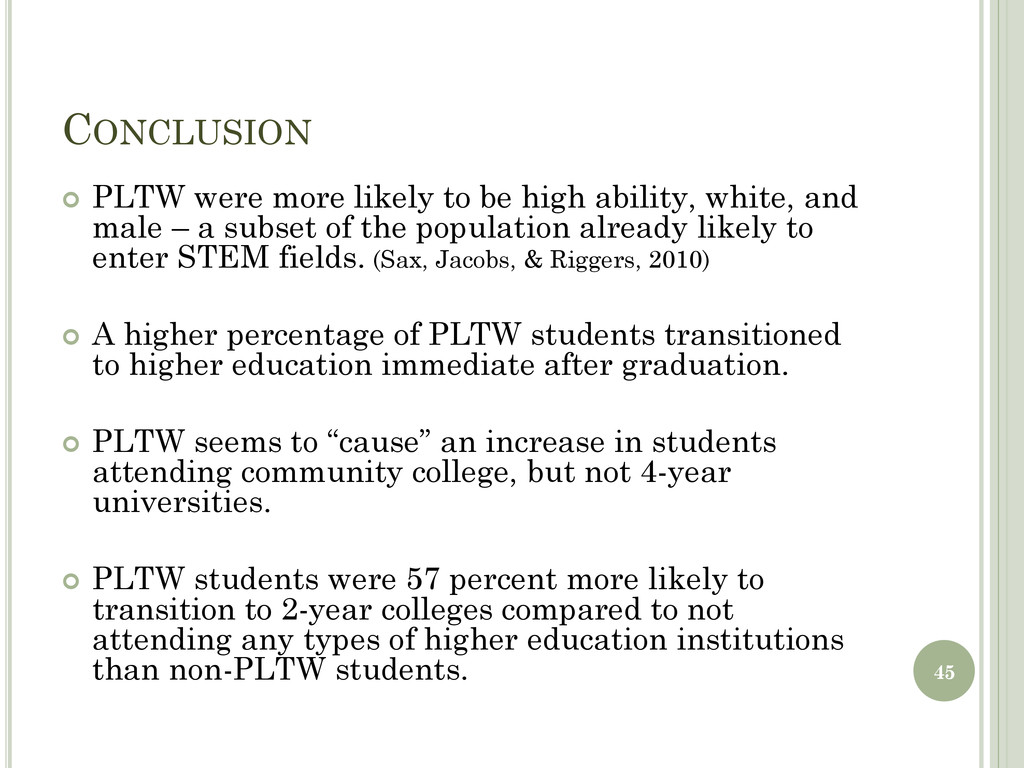
white, and male – a subset of the population already likely to enter STEM fields. (Sax, Jacobs, & Riggers, 2010) A higher percentage of PLTW students transitioned to higher education immediate after graduation. PLTW seems to “cause” an increase in students attending community college, but not 4-year universities. PLTW students were 57 percent more likely to transition to 2-year colleges compared to not attending any types of higher education institutions than non-PLTW students. 45
2-year to 4-year institutions. Examine the effectiveness of PBL, which includes the element of professional development for teachers. Examine students’ choice of major at 2-year institutions (STEM or non-STEM, or selected STEM disciplines: multinominal outcomes). Examine the influence of educational credentials (e.g., AA, AAS, etc.) obtained at 2-year institutions on transfer and majoring in STEM. 46
![MATCHED TREATMENT AND CONTROL GROUP [GENETIC 1-2 MATCHING] Variable Weighted](https://files.speakerdeck.com/presentations/4fca69413c382a027f00d6b4/slide_20.jpg)
![HIGH SCHOOL GRADUATION: CLASS OF 2009 [MATCHED] Control PLTW Participants](https://files.speakerdeck.com/presentations/4fca69413c382a027f00d6b4/slide_30.jpg)
![[SPACE FOR IMPLICATIONS] Implications for PLTW. Implications for](https://files.speakerdeck.com/presentations/4fca69413c382a027f00d6b4/slide_46.jpg)