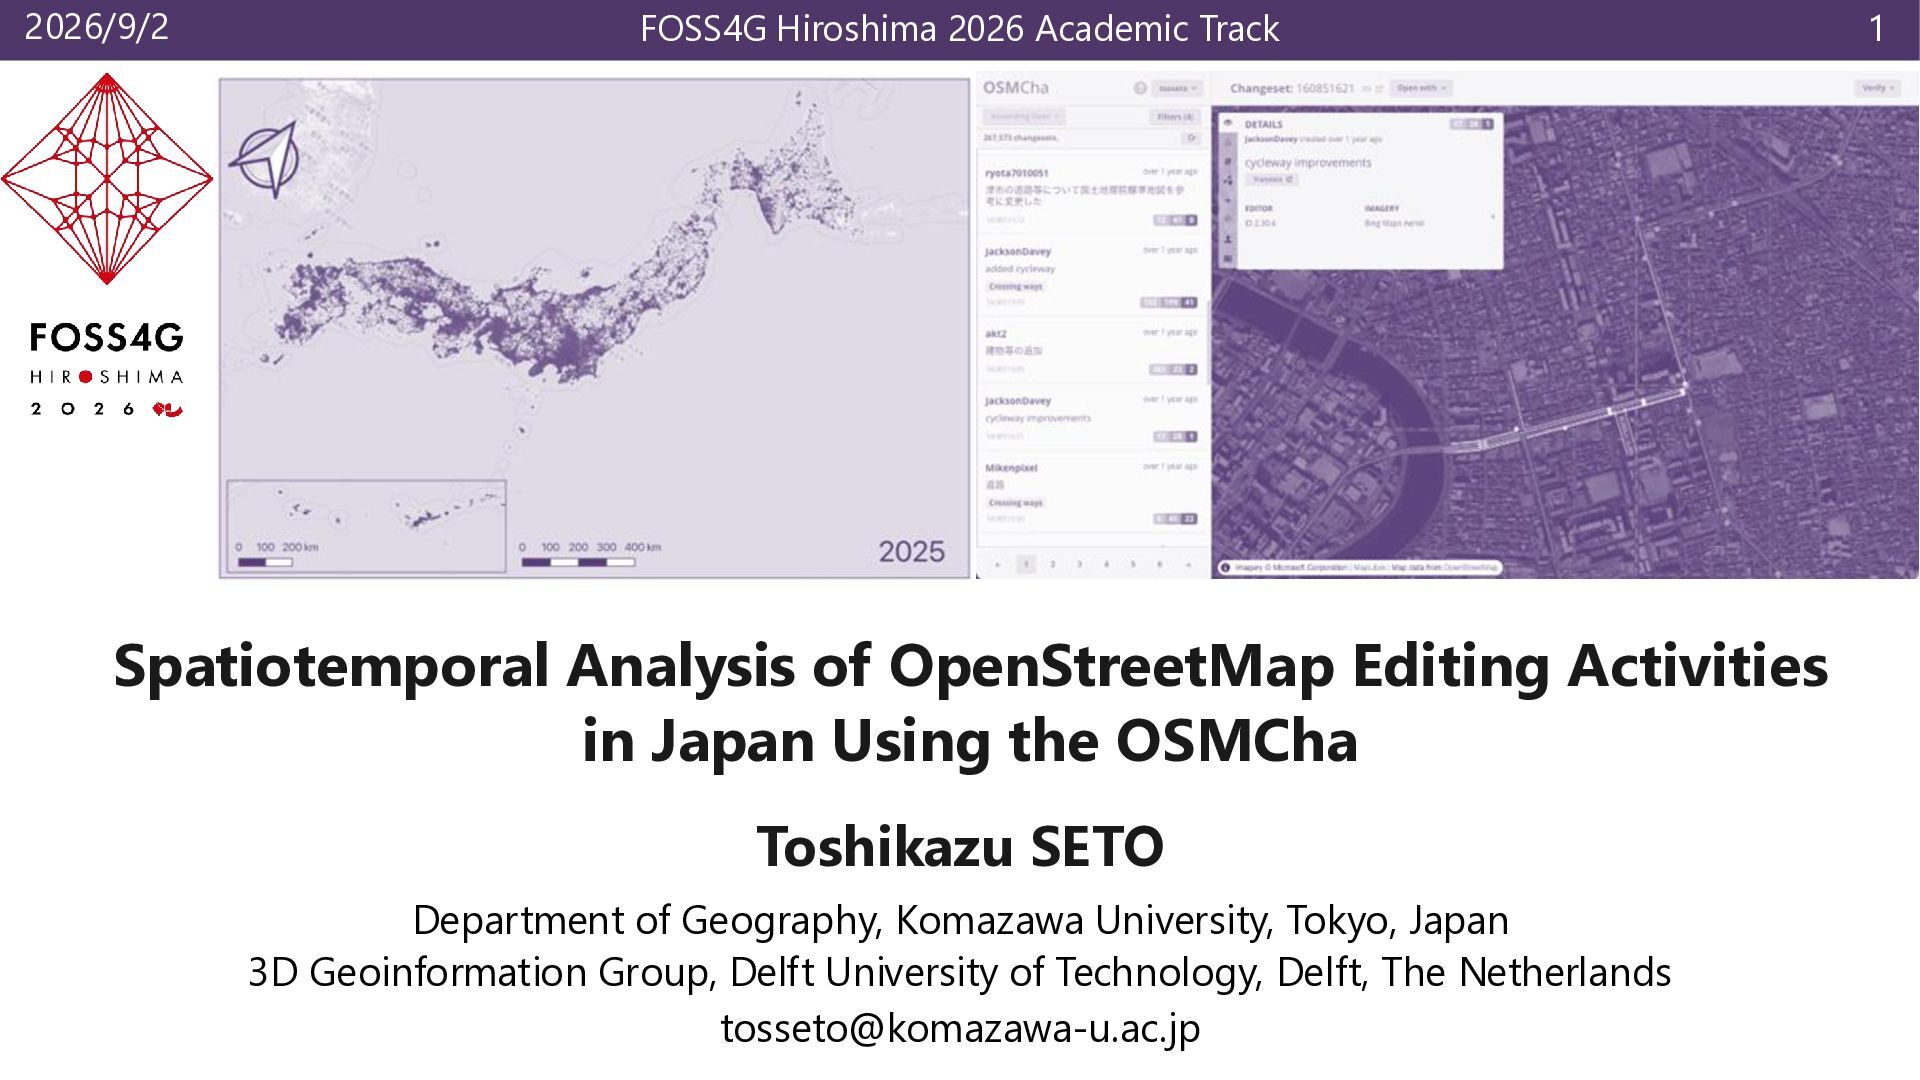
Editing Activities in Japan Using the OSMCha Toshikazu SETO Department of Geography, Komazawa University, Tokyo, Japan 3D Geoinformation Group, Delft University of Technology, Delft, The Netherlands [email protected] 1
Methodology and data – OSMCha, 60 detection rules, and the log-collection pipeline 3. Results – activity growth · detection reasons · editors · contributors · spatial 4. Statistical verification – trend, change point and association tests added to the paper's findings 5. Conclusions Slide Available 2
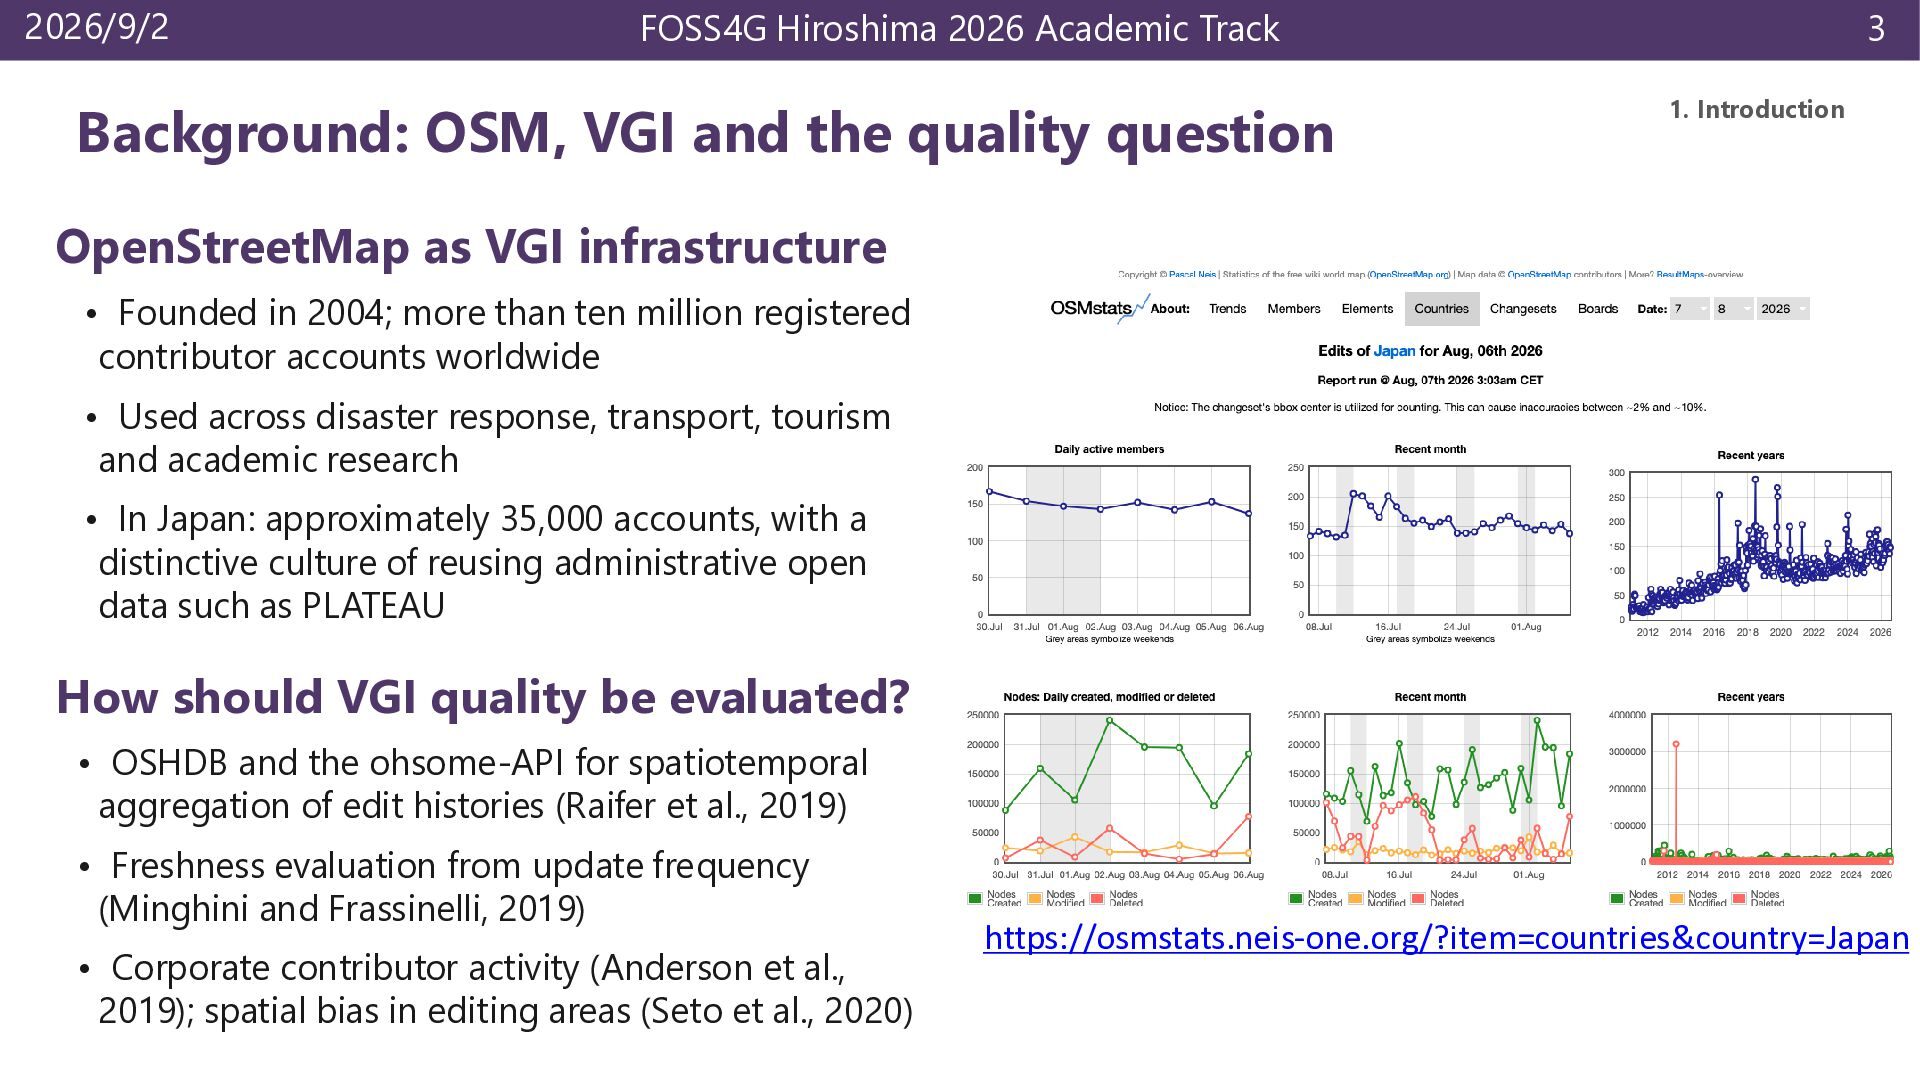
the quality question 3 1. Introduction OpenStreetMap as VGI infrastructure • Founded in 2004; more than ten million registered contributor accounts worldwide • Used across disaster response, transport, tourism and academic research • In Japan: approximately 35,000 accounts, with a distinctive culture of reusing administrative open data such as PLATEAU How should VGI quality be evaluated? • OSHDB and the ohsome-API for spatiotemporal aggregation of edit histories (Raifer et al., 2019) • Freshness evaluation from update frequency (Minghini and Frassinelli, 2019) • Corporate contributor activity (Anderson et al., 2019); spatial bias in editing areas (Seto et al., 2020) https://osmstats.neis-one.org/?item=countries&country=Japan
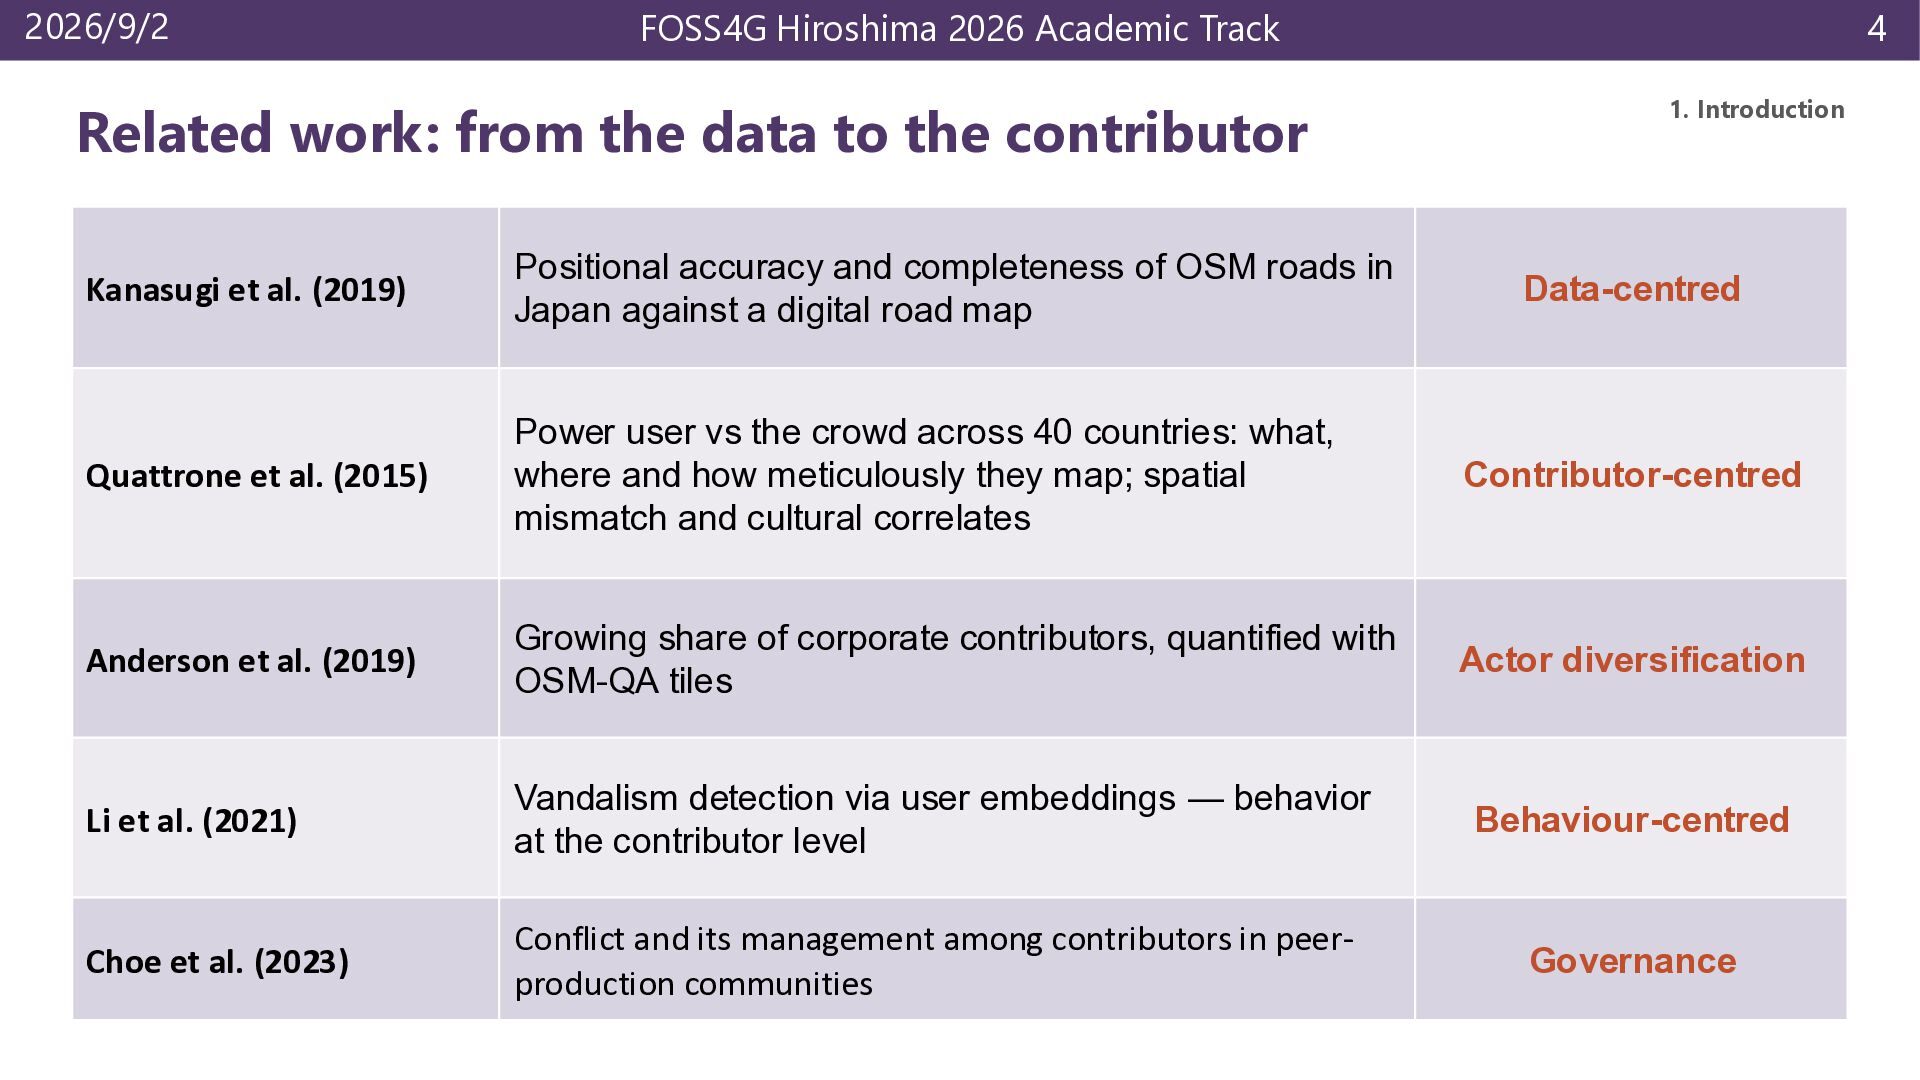
data to the contributor 4 1. Introduction Kanasugi et al. (2019) Positional accuracy and completeness of OSM roads in Japan against a digital road map Quattrone et al. (2015) Power user vs the crowd across 40 countries: what, where and how meticulously they map; spatial mismatch and cultural correlates Contributor-centred Anderson et al. (2019) Growing share of corporate contributors, quantified with OSM-QA tiles Actor diversification Li et al. (2021) Vandalism detection via user embeddings — behavior at the contributor level Behaviour-centred Choe et al. (2023) Conflict and its management among contributors in peerproduction communities Governance Data-centred
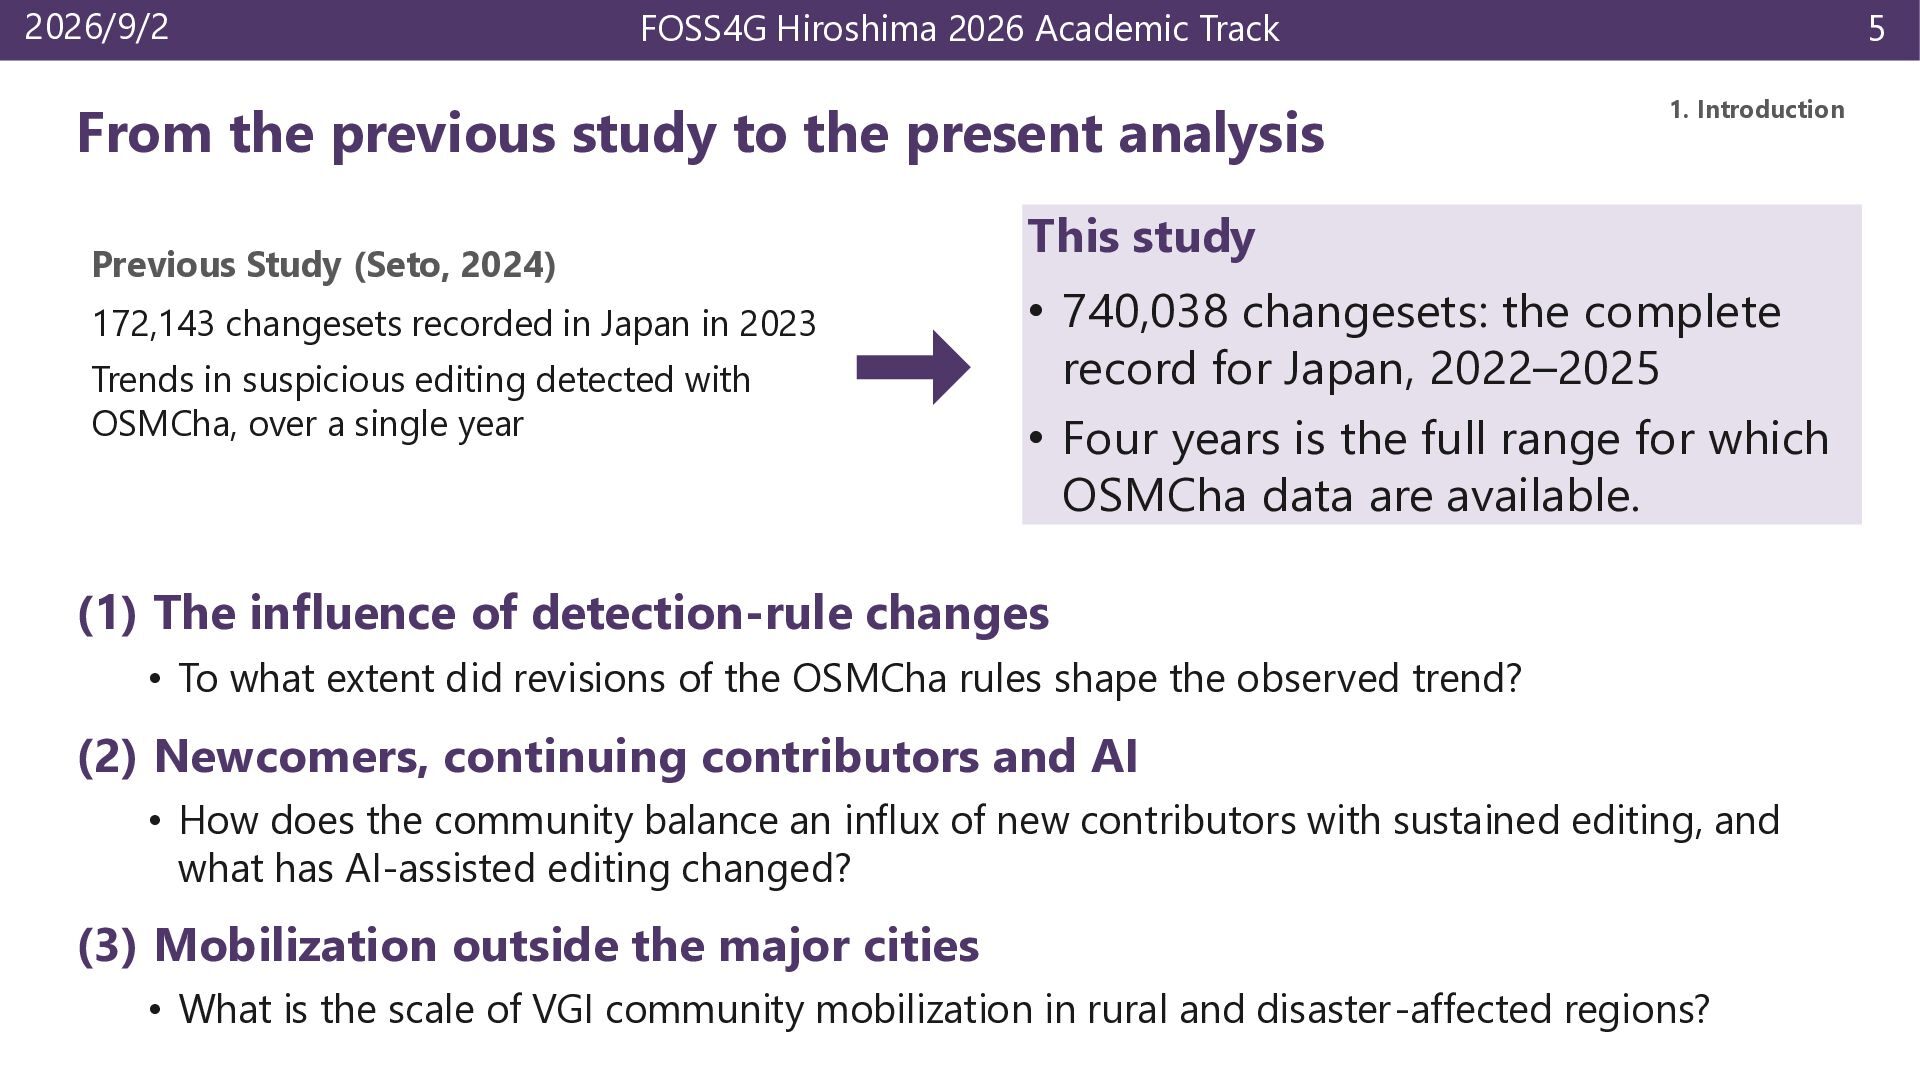
to the present analysis Previous Study (Seto, 2024) 172,143 changesets recorded in Japan in 2023 Trends in suspicious editing detected with OSMCha, over a single year 5 1. Introduction This study • 740,038 changesets: the complete record for Japan, 2022–2025 • Four years is the full range for which OSMCha data are available. (1) The influence of detection-rule changes • To what extent did revisions of the OSMCha rules shape the observed trend? (2) Newcomers, continuing contributors and AI • How does the community balance an influx of new contributors with sustained editing, and what has AI-assisted editing changed? (3) Mobilization outside the major cities • What is the scale of VGI community mobilization in rural and disaster-affected regions?
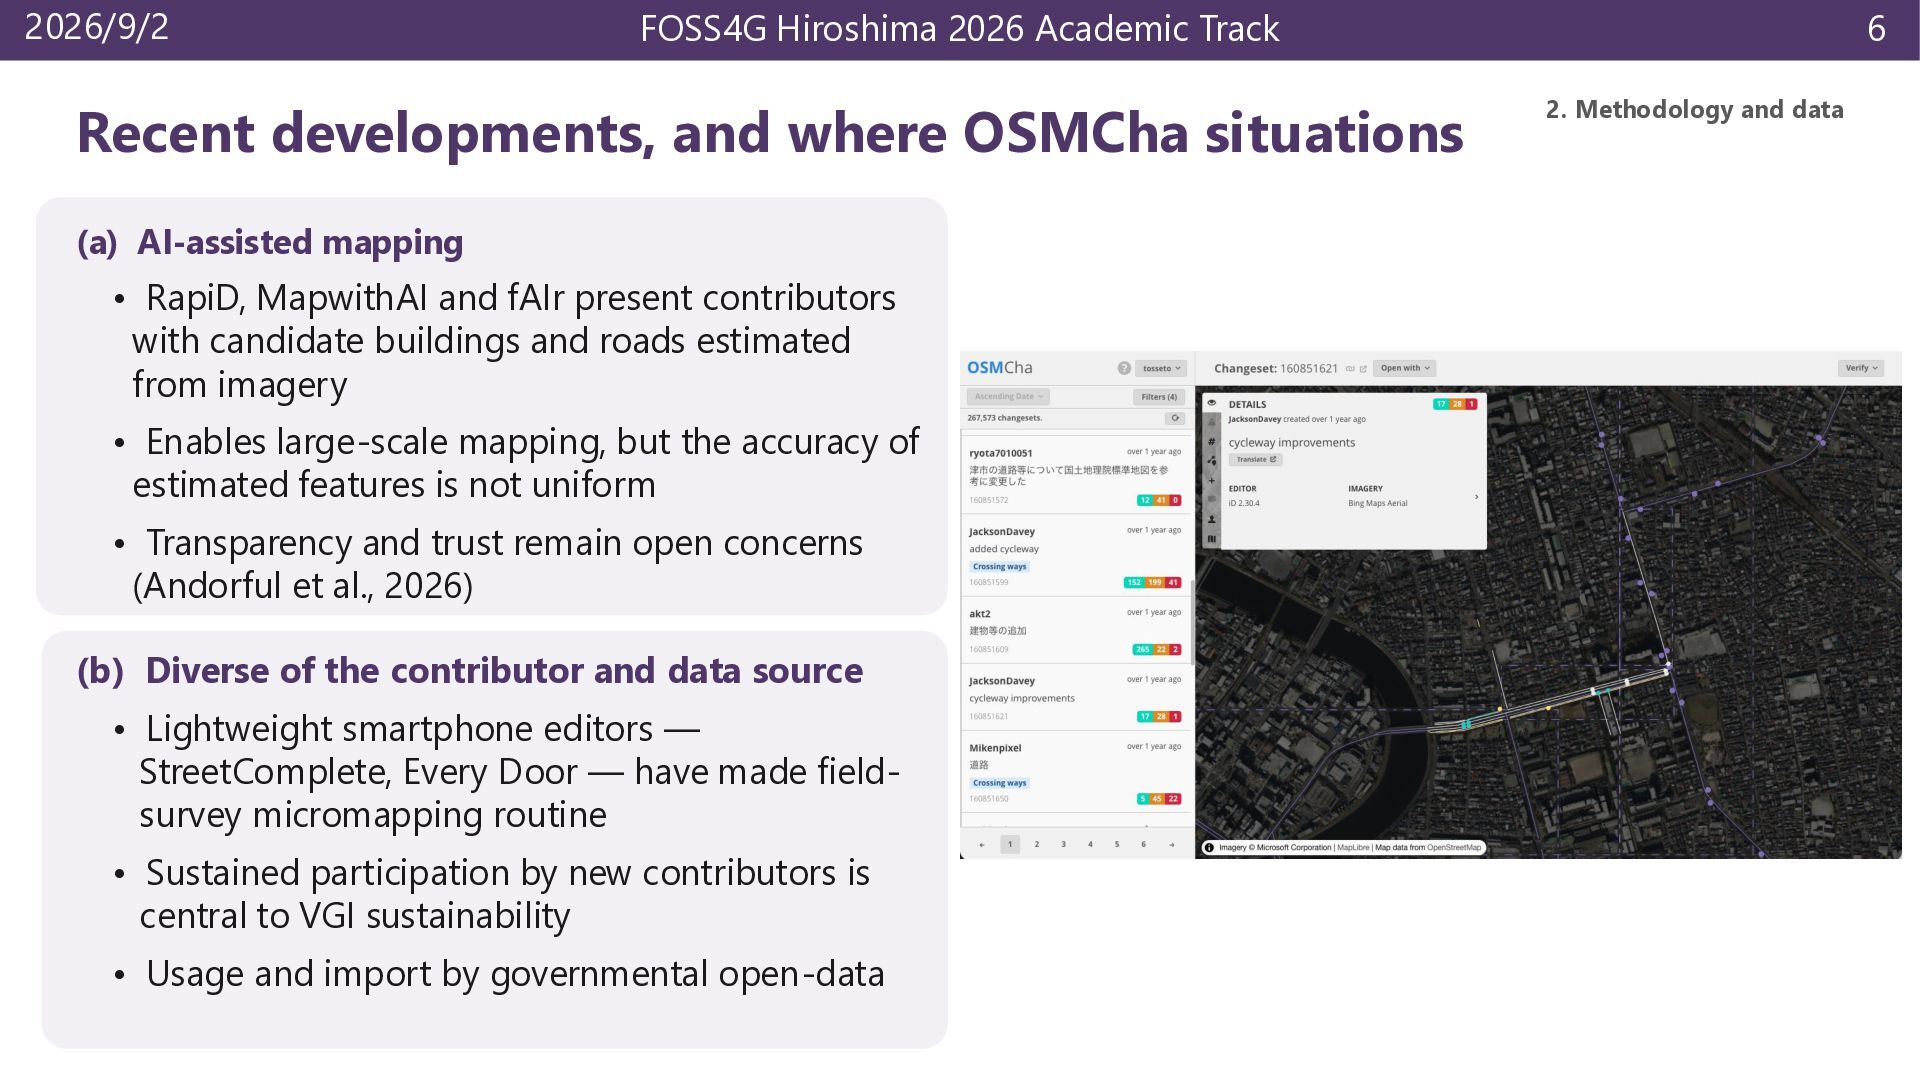
OSMCha situations (a) AI-assisted mapping • RapiD, MapwithAI and fAIr present contributors with candidate buildings and roads estimated from imagery • Enables large-scale mapping, but the accuracy of estimated features is not uniform • Transparency and trust remain open concerns (Andorful et al., 2026) (b) Diverse of the contributor and data source • Lightweight smartphone editors — StreetComplete, Every Door — have made fieldsurvey micromapping routine • Sustained participation by new contributors is central to VGI sustainability • Usage and import by governmental open-data 6 2. Methodology and data
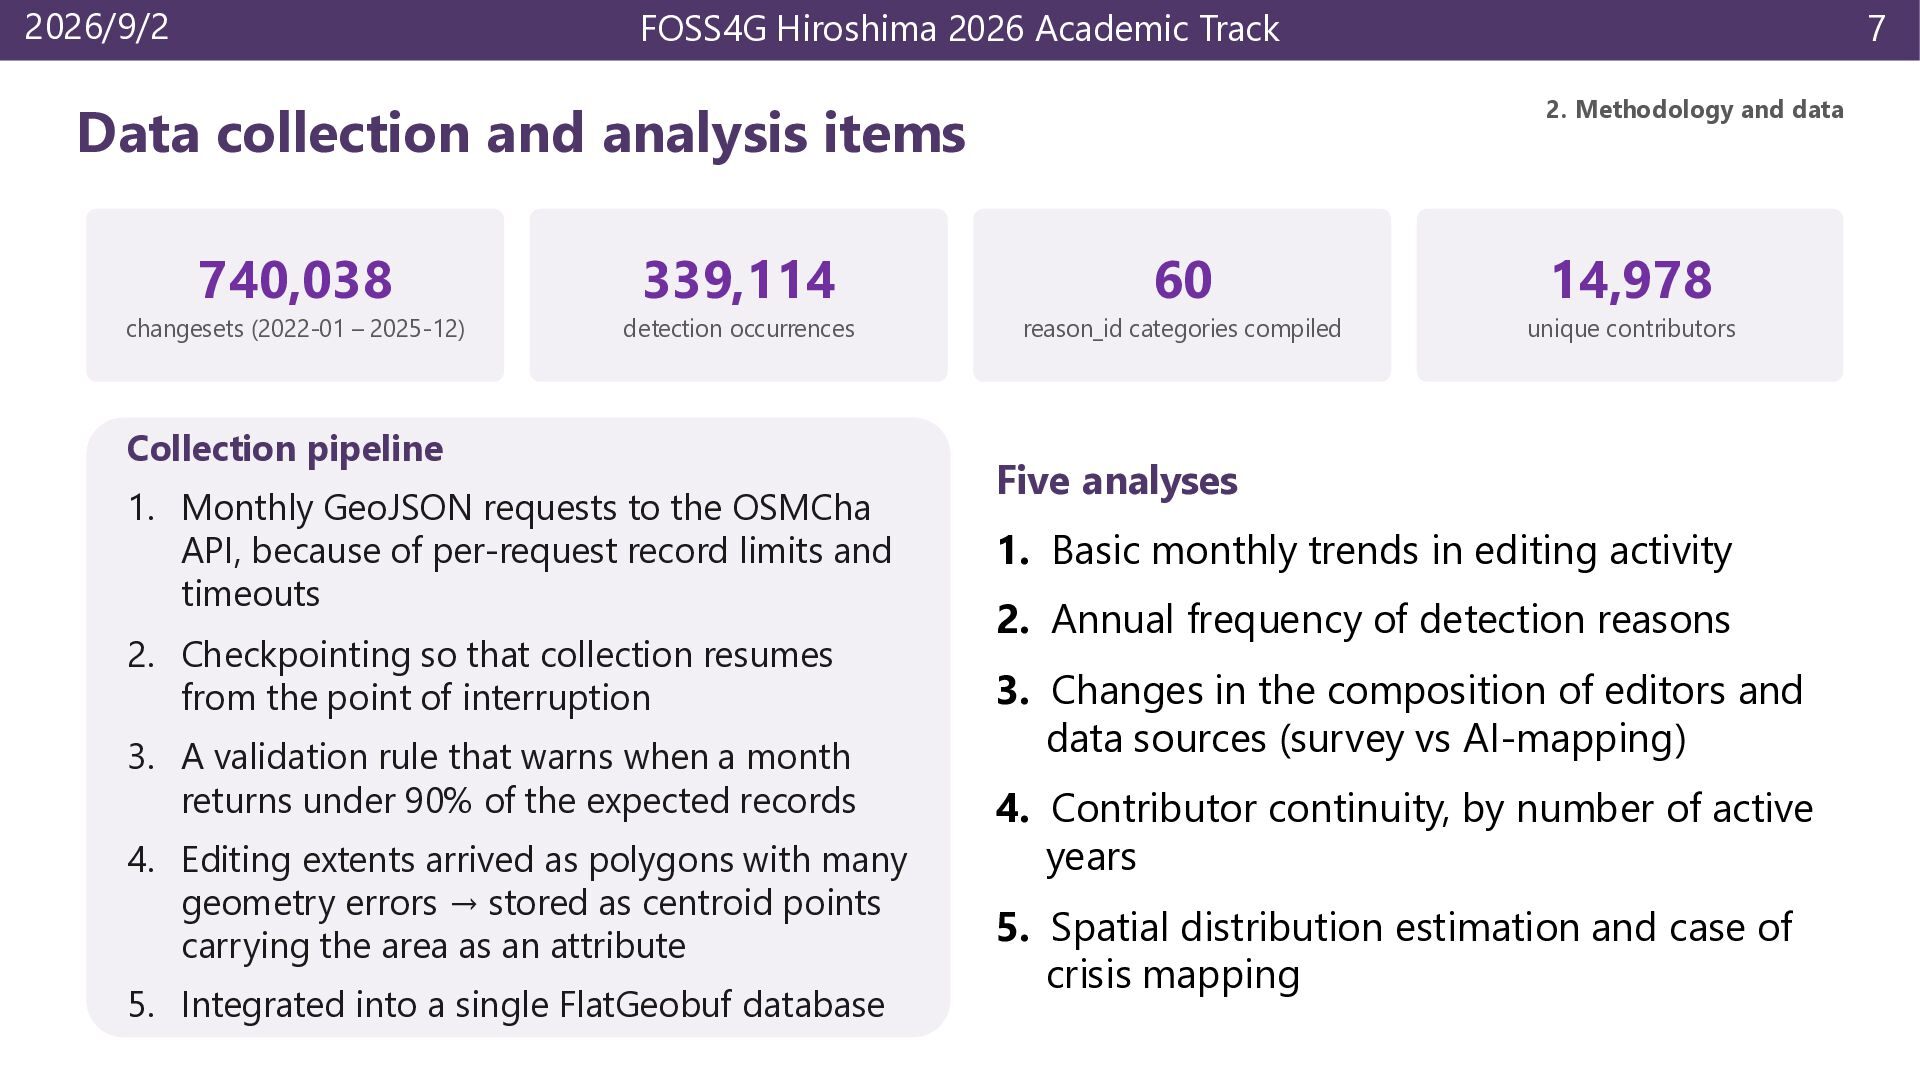
data Data collection and analysis items 740,038 339,114 60 14,978 changesets (2022-01 – 2025-12) detection occurrences reason_id categories compiled unique contributors Collection pipeline 1. Monthly GeoJSON requests to the OSMCha API, because of per-request record limits and timeouts 2. Checkpointing so that collection resumes from the point of interruption 3. A validation rule that warns when a month returns under 90% of the expected records 4. Editing extents arrived as polygons with many geometry errors → stored as centroid points carrying the area as an attribute 5. Integrated into a single FlatGeobuf database Five analyses 1. Basic monthly trends in editing activity 2. Annual frequency of detection reasons 3. Changes in the composition of editors and data sources (survey vs AI-mapping) 4. Contributor continuity, by number of active years 5. Spatial distribution estimation and case of crisis mapping
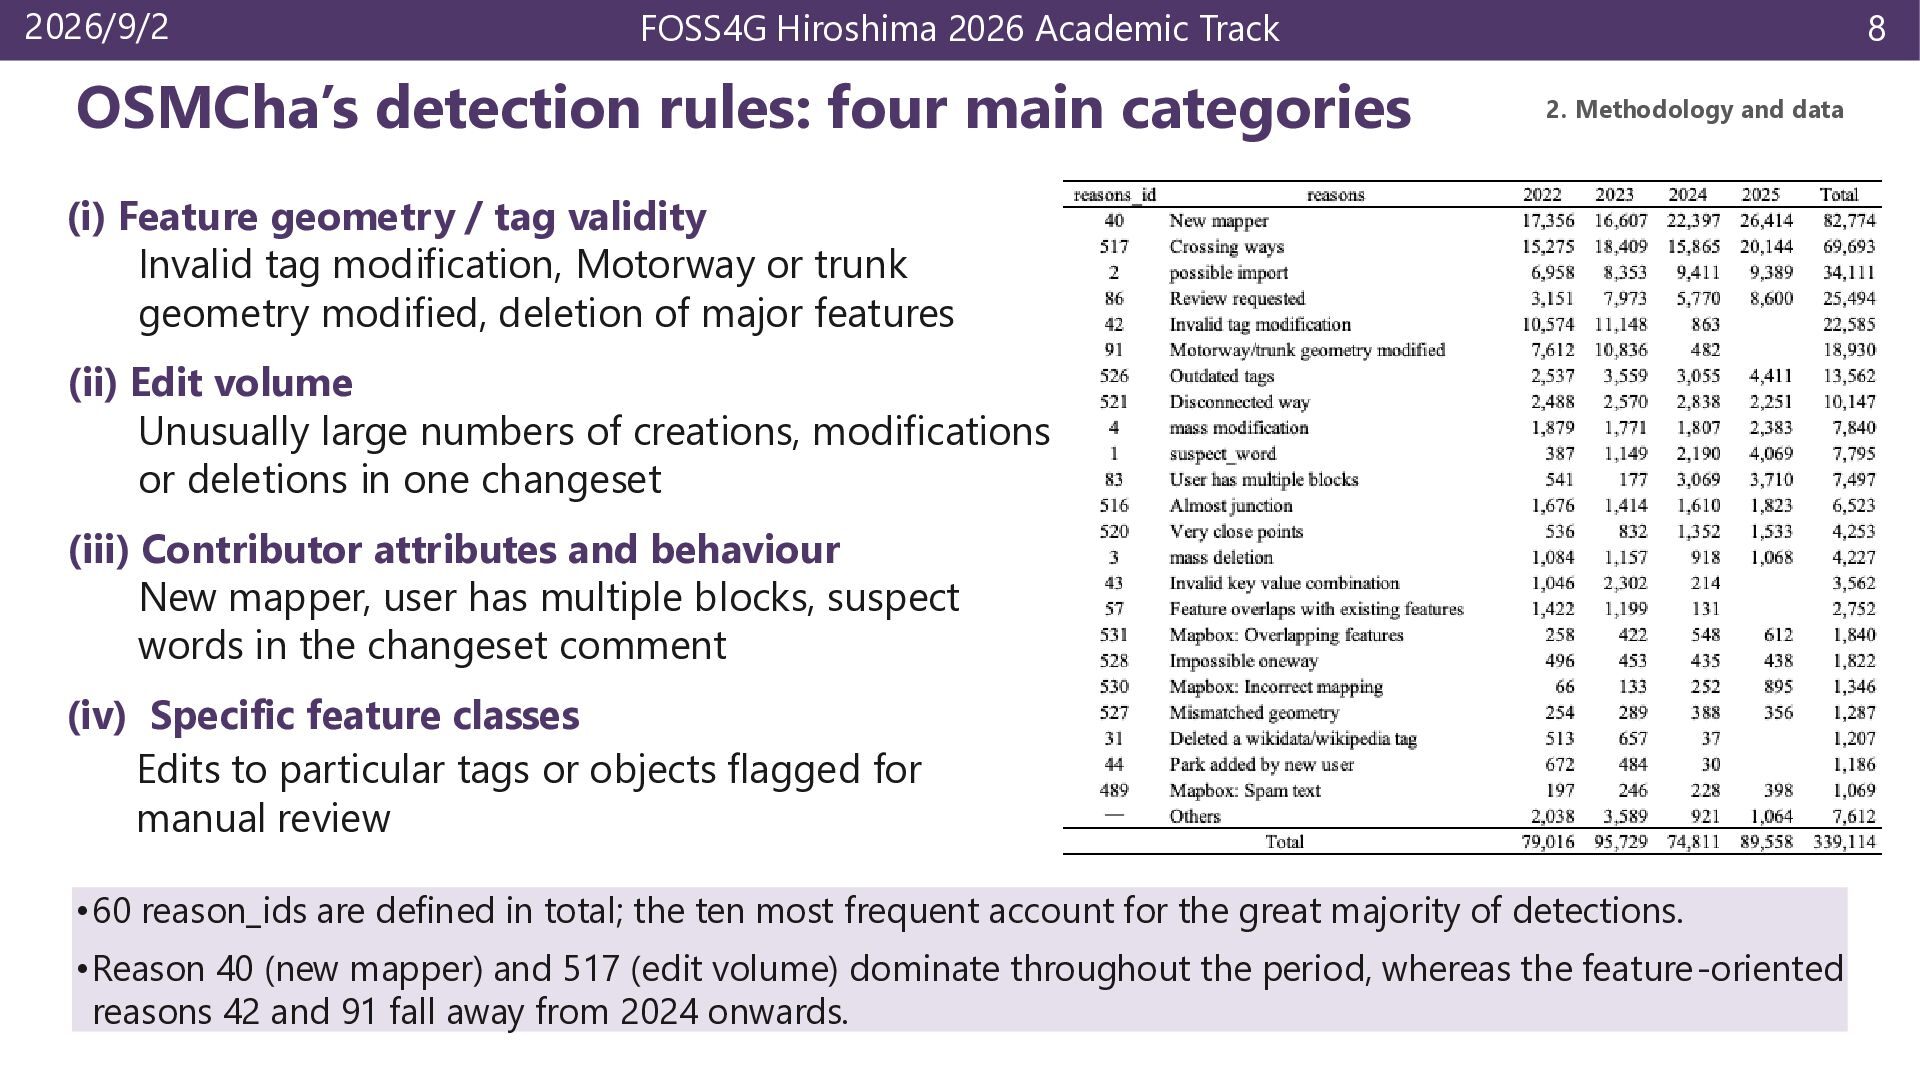
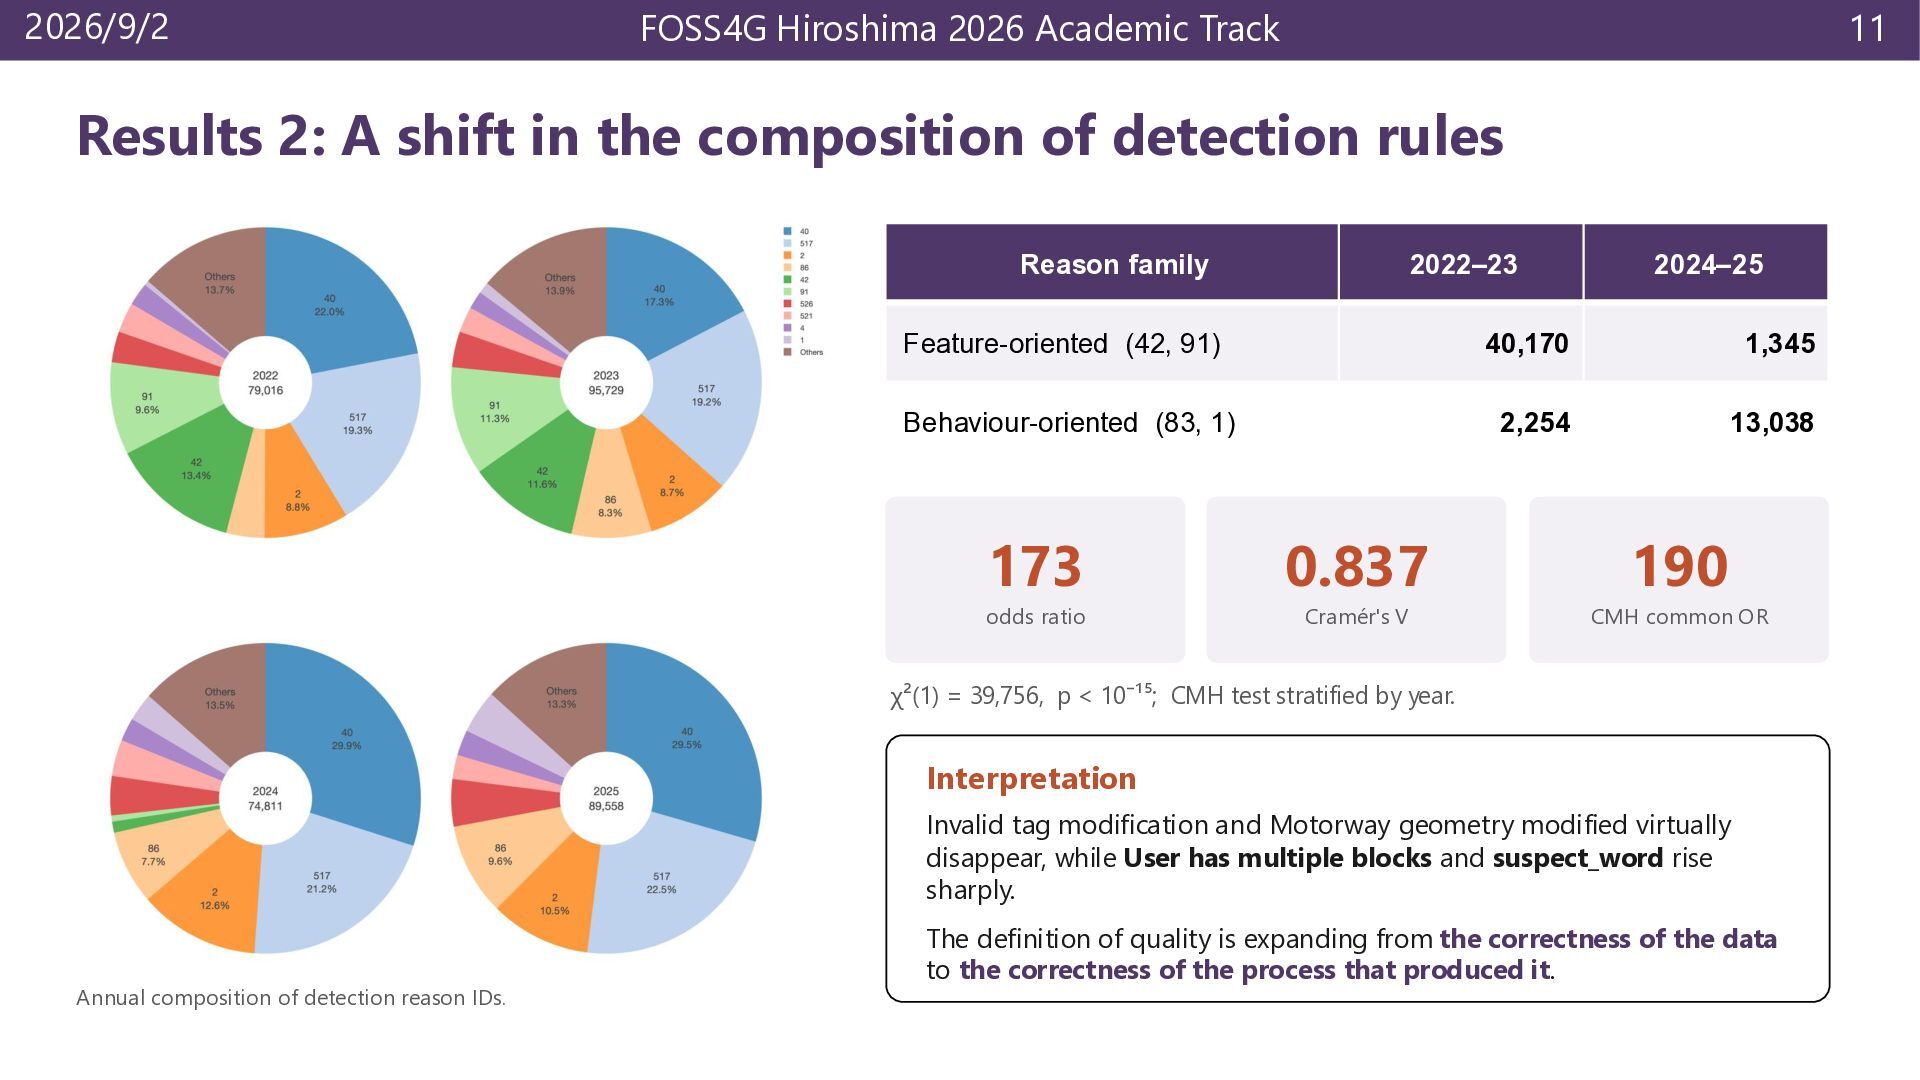
main categories 8 2. Methodology and data (i) Feature geometry / tag validity Invalid tag modification, Motorway or trunk geometry modified, deletion of major features (ii) Edit volume Unusually large numbers of creations, modifications or deletions in one changeset (iii) Contributor attributes and behaviour New mapper, user has multiple blocks, suspect words in the changeset comment (iv) Specific feature classes Edits to particular tags or objects flagged for manual review •60 reason_ids are defined in total; the ten most frequent account for the great majority of detections. •Reason 40 (new mapper) and 517 (edit volume) dominate throughout the period, whereas the feature-oriented reasons 42 and 91 fall away from 2024 onwards.
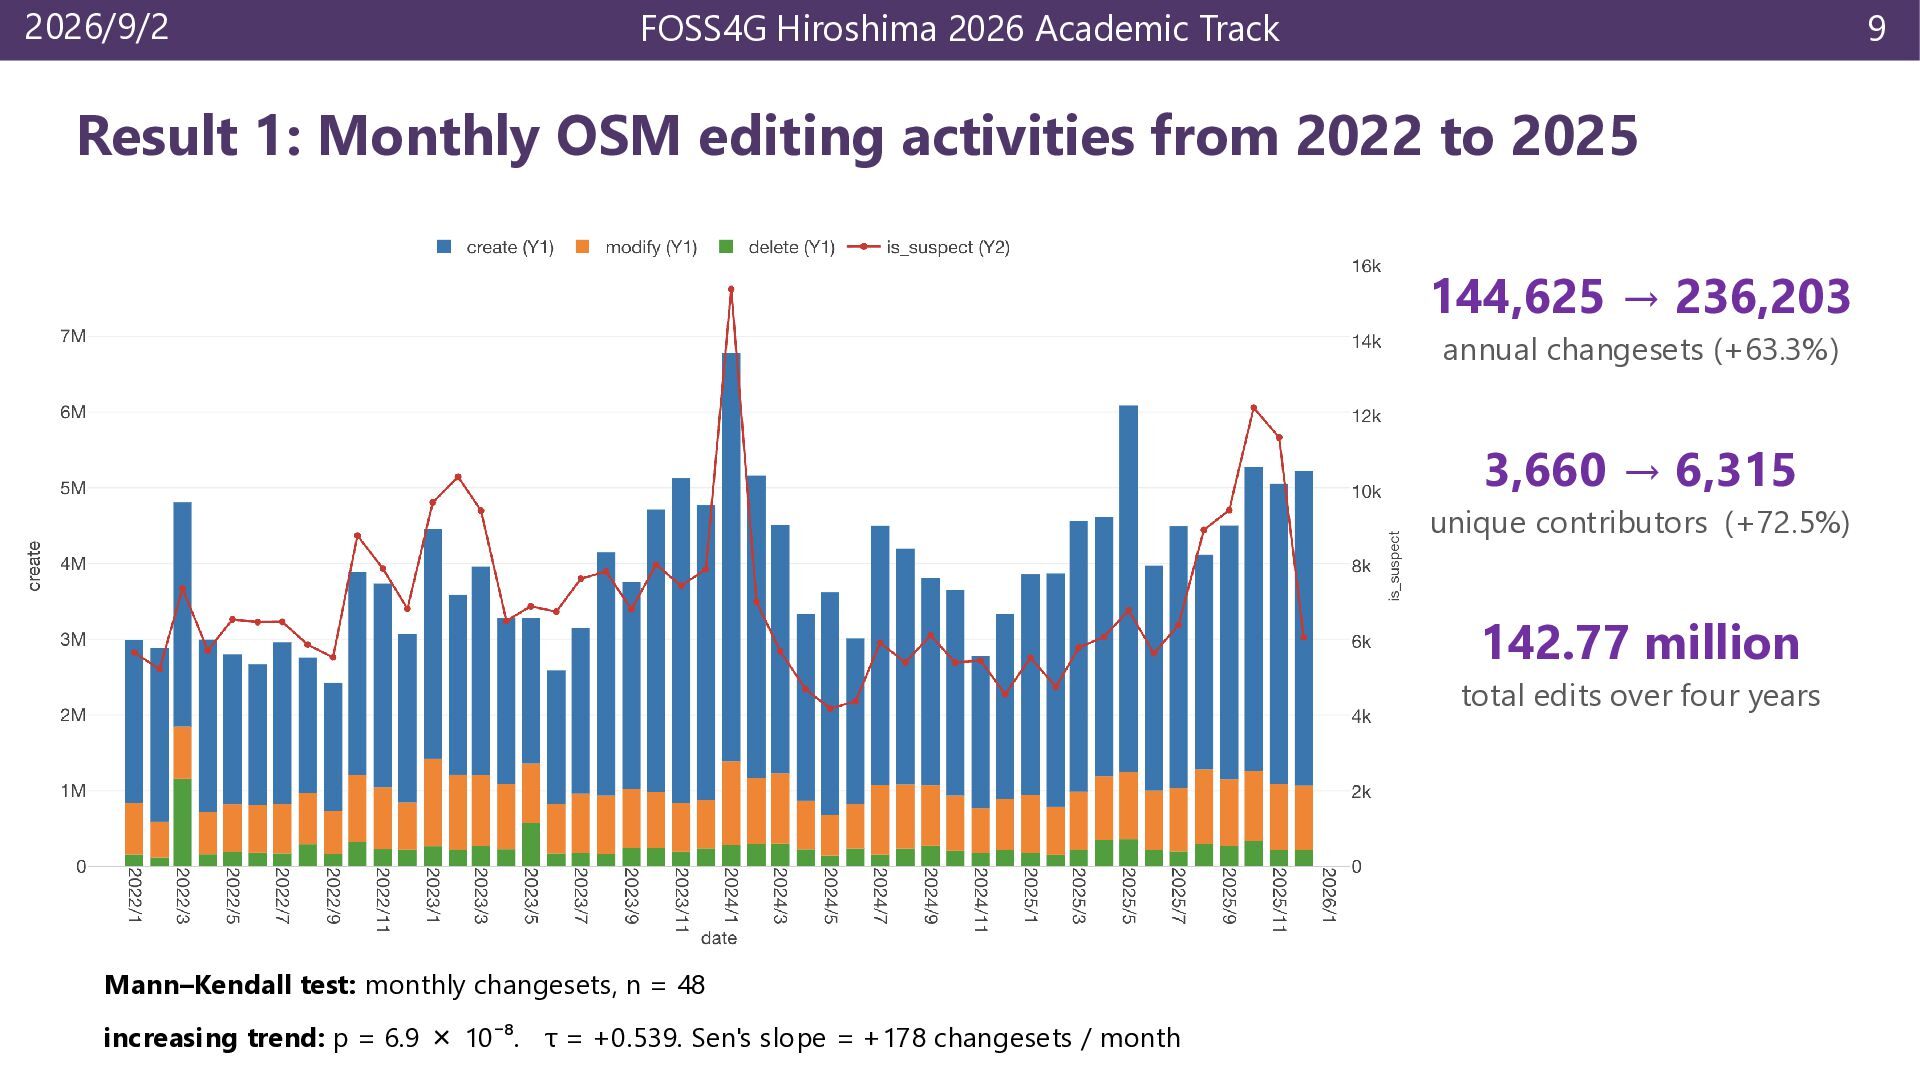
OSM editing activities from 2022 to 2025 144,625 → 236,203 annual changesets (+63.3%) 3,660 → 6,315 unique contributors (+72.5%) 142.77 million total edits over four years Mann–Kendall test: monthly changesets, n = 48 increasing trend: p = 6.9 × 10⁻⁸. τ = +0.539. Sen's slope = +178 changesets / month
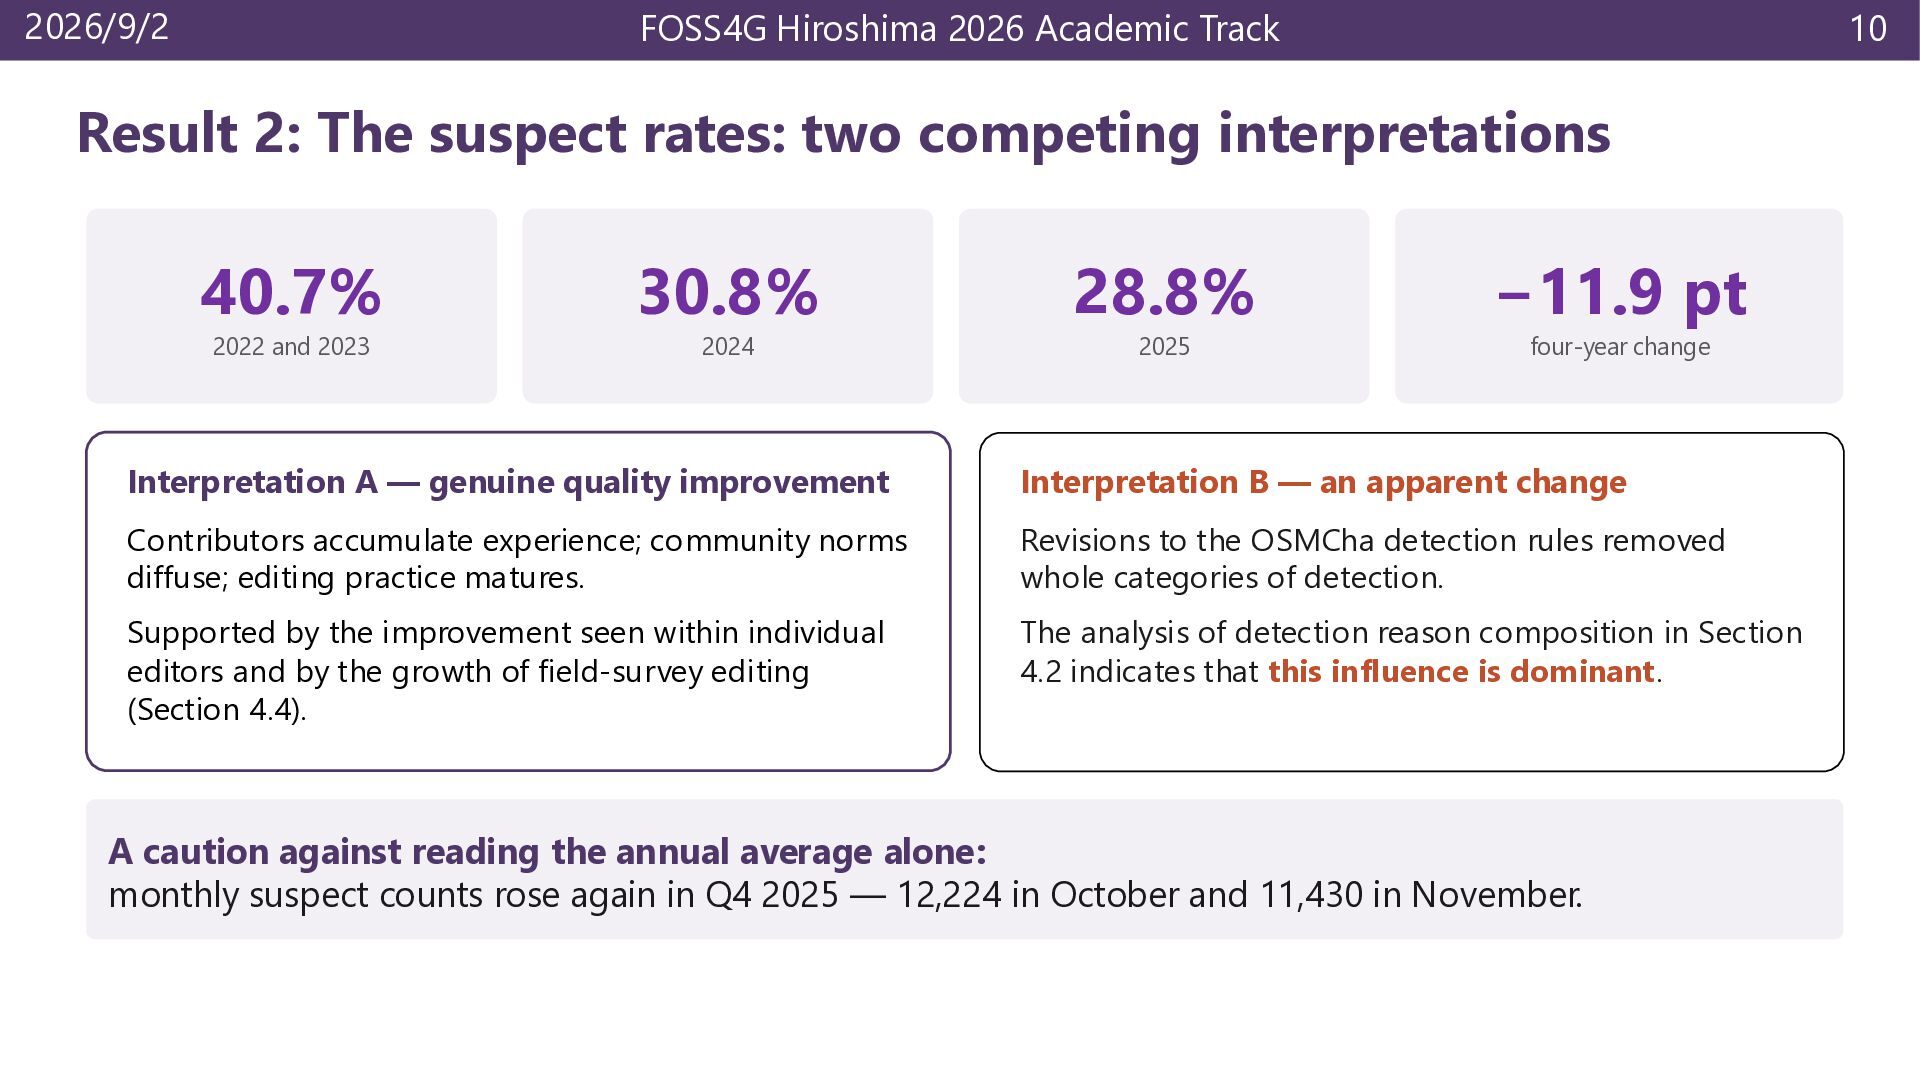
suspect rates: two competing interpretations 40.7% 30.8% 28.8% −11.9 pt 2022 and 2023 2024 2025 four-year change Interpretation A — genuine quality improvement Interpretation B — an apparent change Contributors accumulate experience; community norms diffuse; editing practice matures. Revisions to the OSMCha detection rules removed whole categories of detection. Supported by the improvement seen within individual editors and by the growth of field-survey editing (Section 4.4). The analysis of detection reason composition in Section 4.2 indicates that this influence is dominant. A caution against reading the annual average alone: monthly suspect counts rose again in Q4 2025 — 12,224 in October and 11,430 in November.
shift in the composition of detection rules Reason family 2022–23 2024–25 Feature-oriented (42, 91) 40,170 1,345 Behaviour-oriented (83, 1) 2,254 13,038 173 0.837 190 odds ratio Cramér's V CMH common OR χ²(1) = 39,756, p < 10⁻¹⁵; CMH test stratified by year. Interpretation Invalid tag modification and Motorway geometry modified virtually disappear, while User has multiple blocks and suspect_word rise sharply. Annual composition of detection reason IDs. The definition of quality is expanding from the correctness of the data to the correctness of the process that produced it.
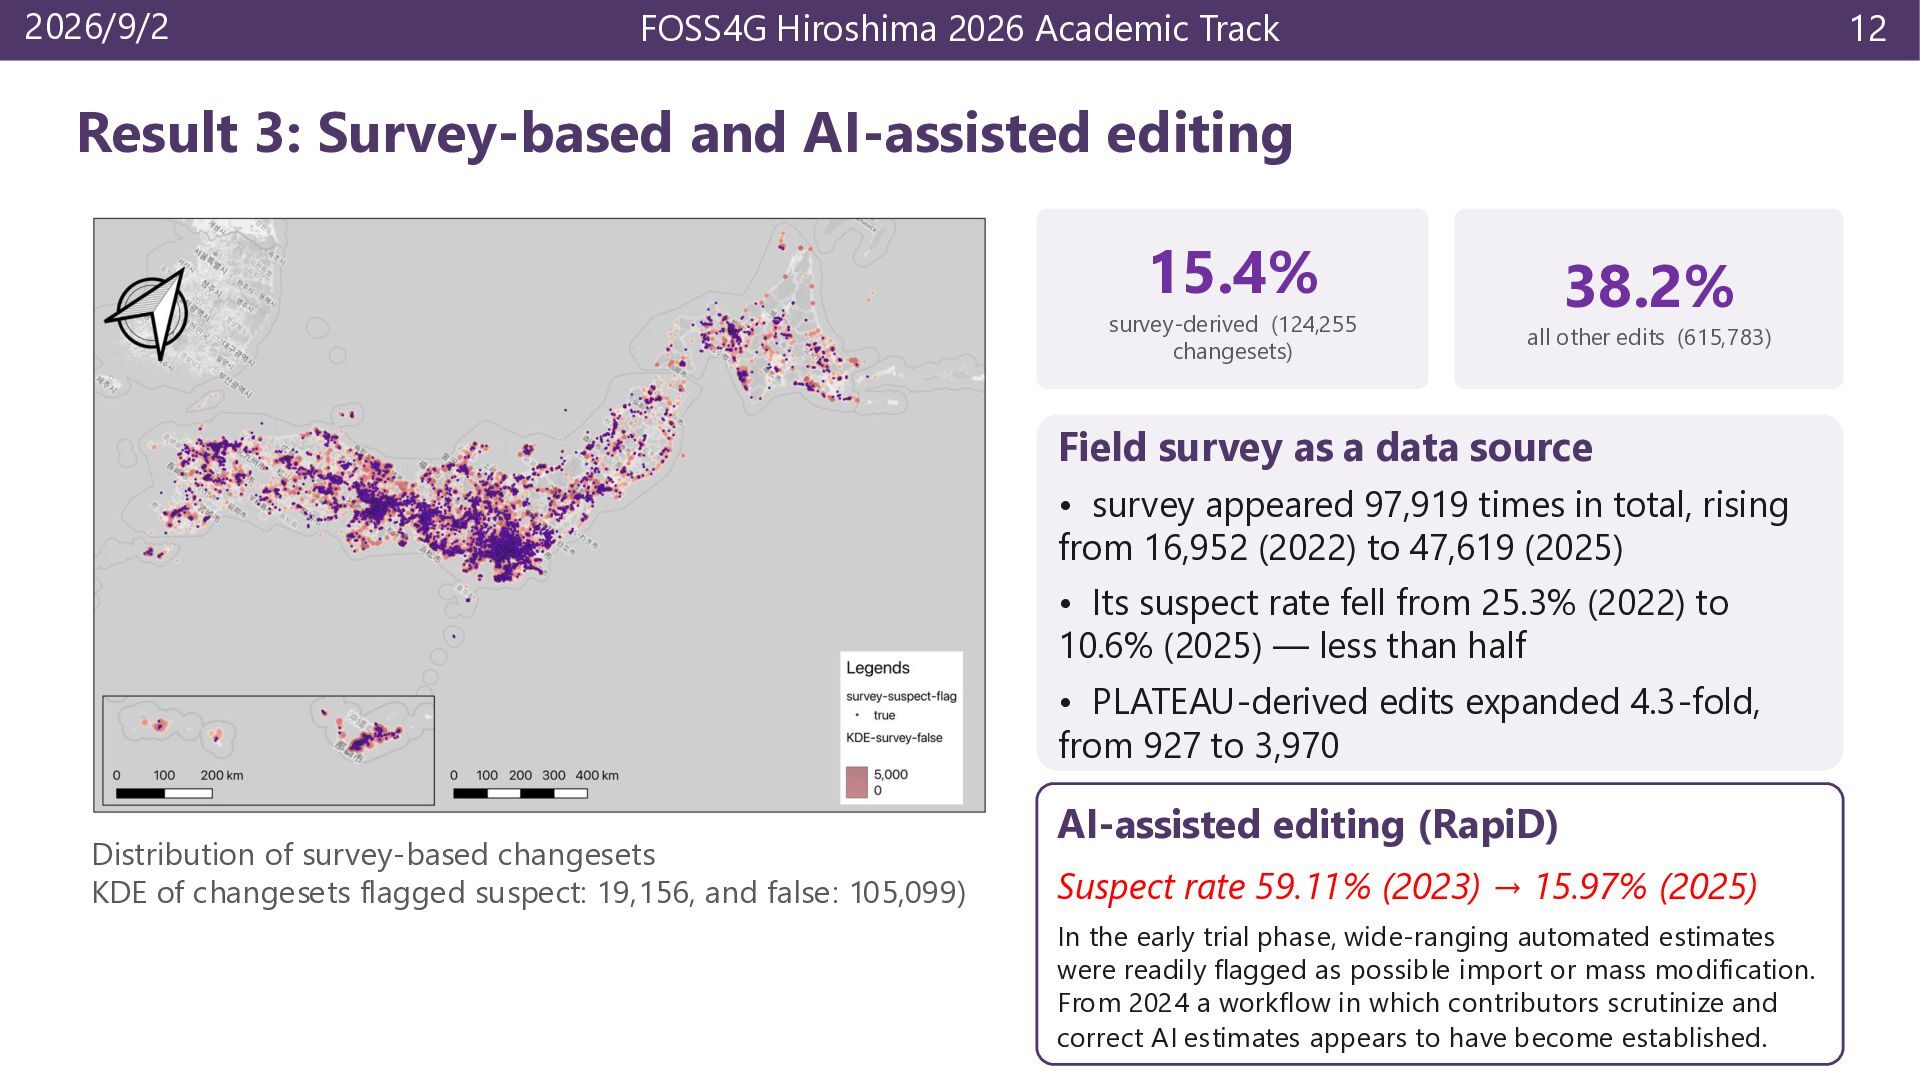
and AI-assisted editing 15.4% survey-derived (124,255 changesets) 38.2% all other edits (615,783) Field survey as a data source • survey appeared 97,919 times in total, rising from 16,952 (2022) to 47,619 (2025) • Its suspect rate fell from 25.3% (2022) to 10.6% (2025) — less than half • PLATEAU-derived edits expanded 4.3-fold, from 927 to 3,970 Distribution of survey-based changesets KDE of changesets flagged suspect: 19,156, and false: 105,099) AI-assisted editing (RapiD) Suspect rate 59.11% (2023) → 15.97% (2025) In the early trial phase, wide-ranging automated estimates were readily flagged as possible import or mass modification. From 2024 a workflow in which contributors scrutinize and correct AI estimates appears to have become established.
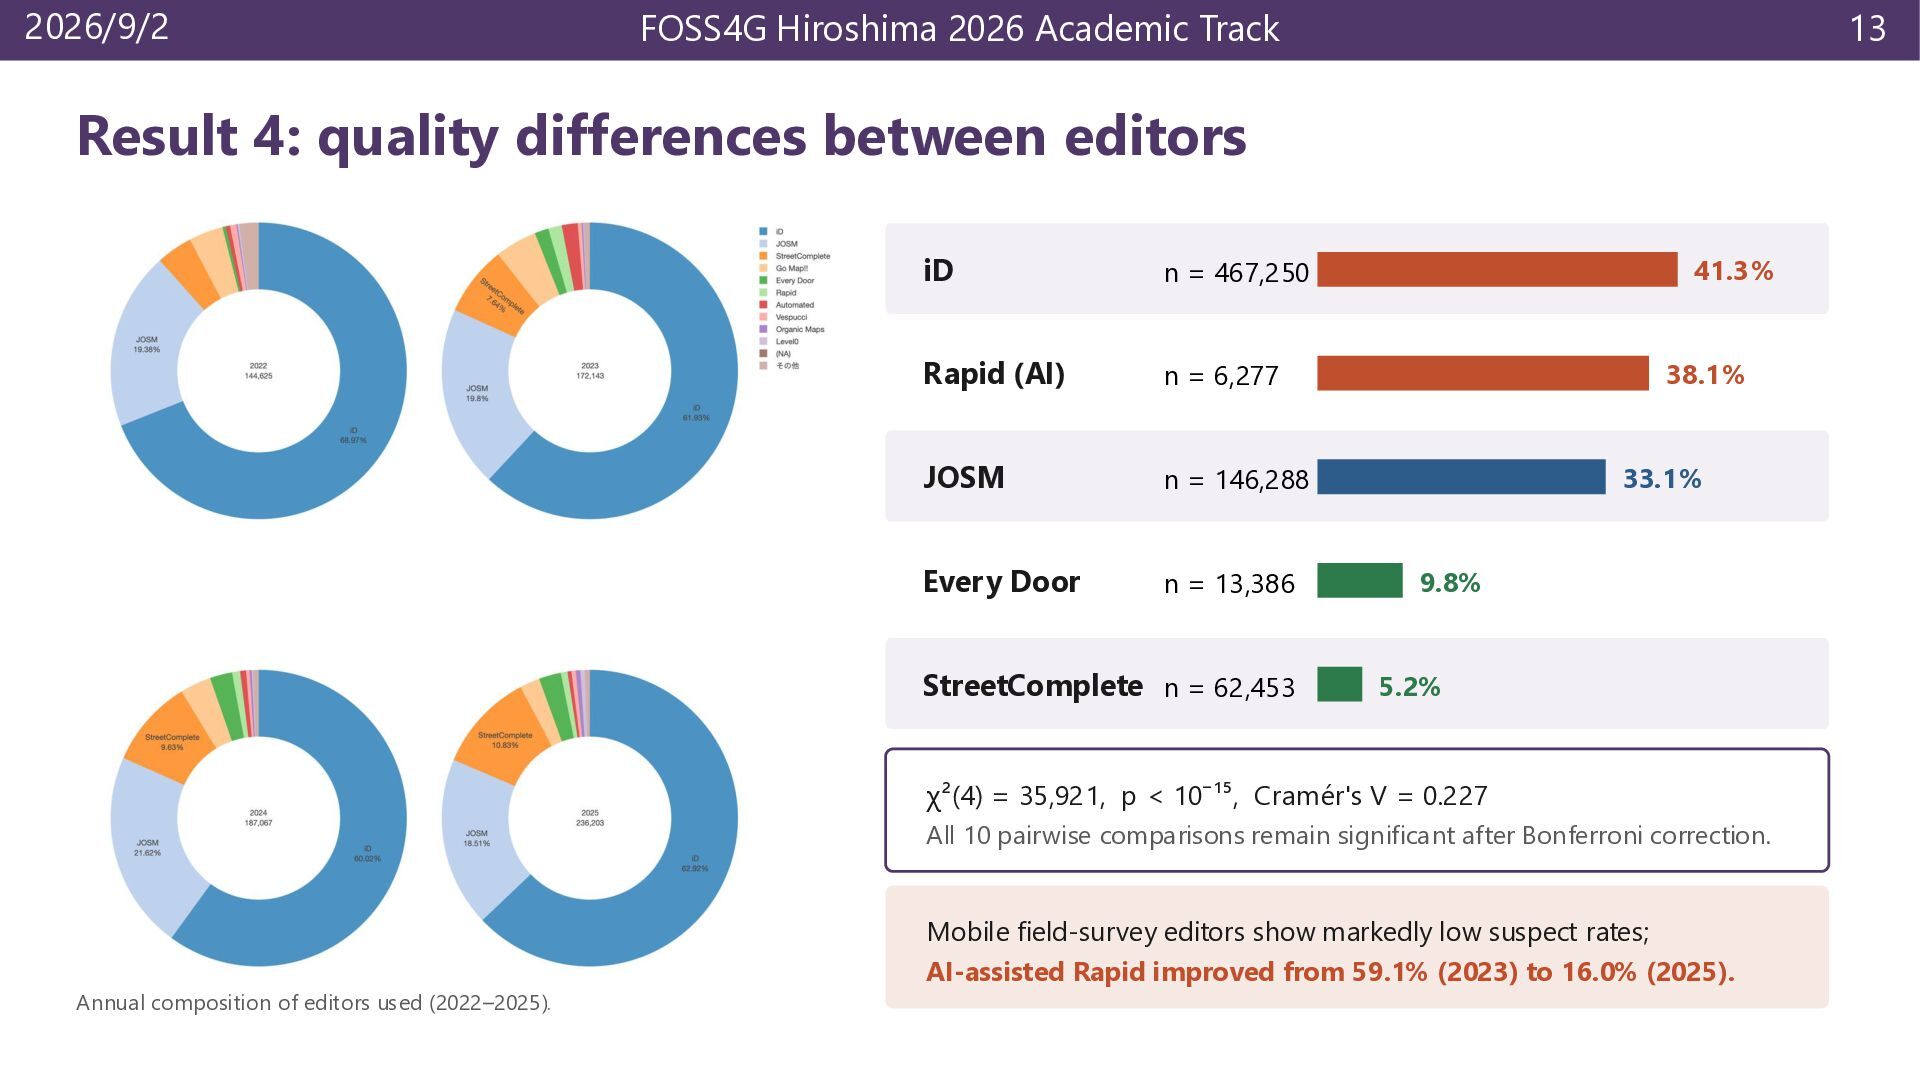
differences between editors iD n = 467,250 Rapid (AI) n = 6,277 JOSM n = 146,288 Every Door n = 13,386 StreetComplete n = 62,453 41.3% 38.1% 33.1% 9.8% 5.2% χ²(4) = 35,921, p < 10⁻¹⁵, Cramér's V = 0.227 All 10 pairwise comparisons remain significant after Bonferroni correction. Annual composition of editors used (2022–2025). Mobile field-survey editors show markedly low suspect rates; AI-assisted Rapid improved from 59.1% (2023) to 16.0% (2025).
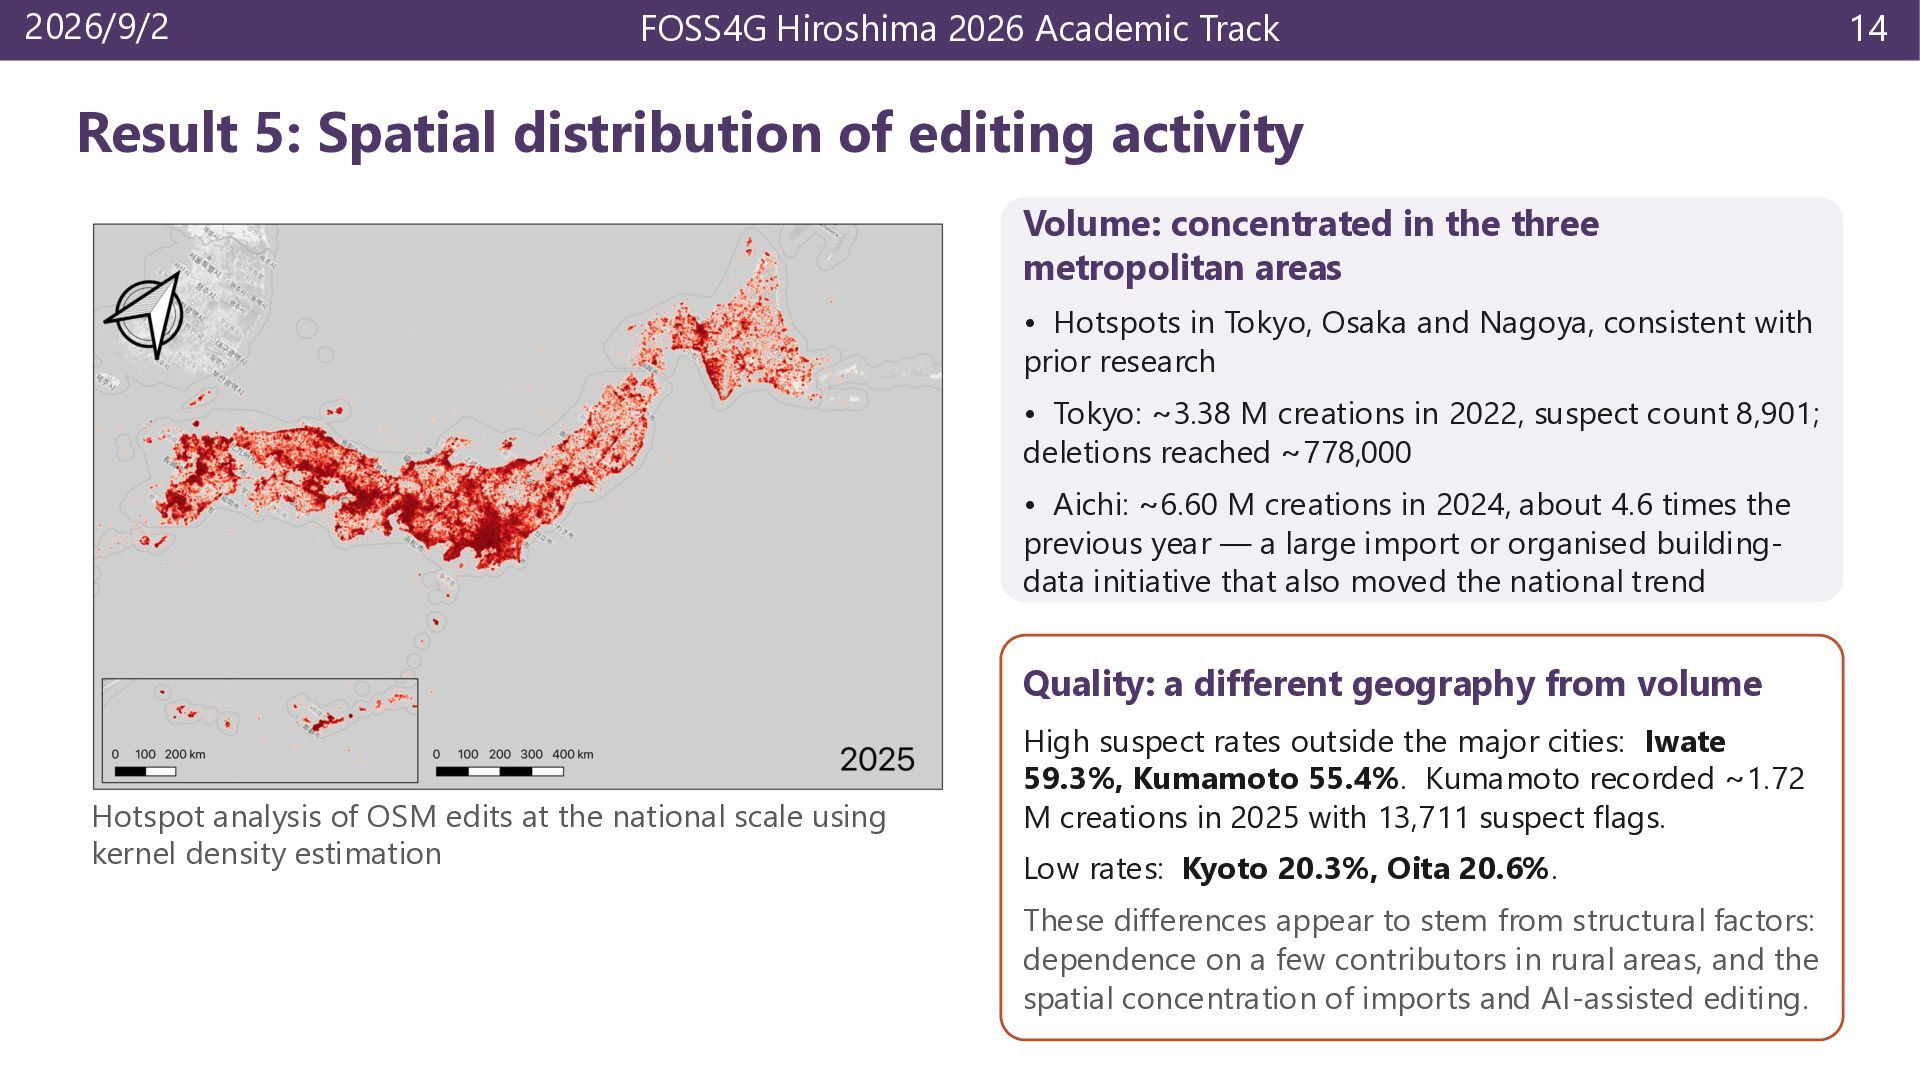
of editing activity Volume: concentrated in the three metropolitan areas • Hotspots in Tokyo, Osaka and Nagoya, consistent with prior research • Tokyo: ~3.38 M creations in 2022, suspect count 8,901; deletions reached ~778,000 • Aichi: ~6.60 M creations in 2024, about 4.6 times the previous year — a large import or organised buildingdata initiative that also moved the national trend Quality: a different geography from volume Hotspot analysis of OSM edits at the national scale using kernel density estimation High suspect rates outside the major cities: Iwate 59.3%, Kumamoto 55.4%. Kumamoto recorded ~1.72 M creations in 2025 with 13,711 suspect flags. Low rates: Kyoto 20.3%, Oita 20.6%. These differences appear to stem from structural factors: dependence on a few contributors in rural areas, and the spatial concentration of imports and AI-assisted editing. 14
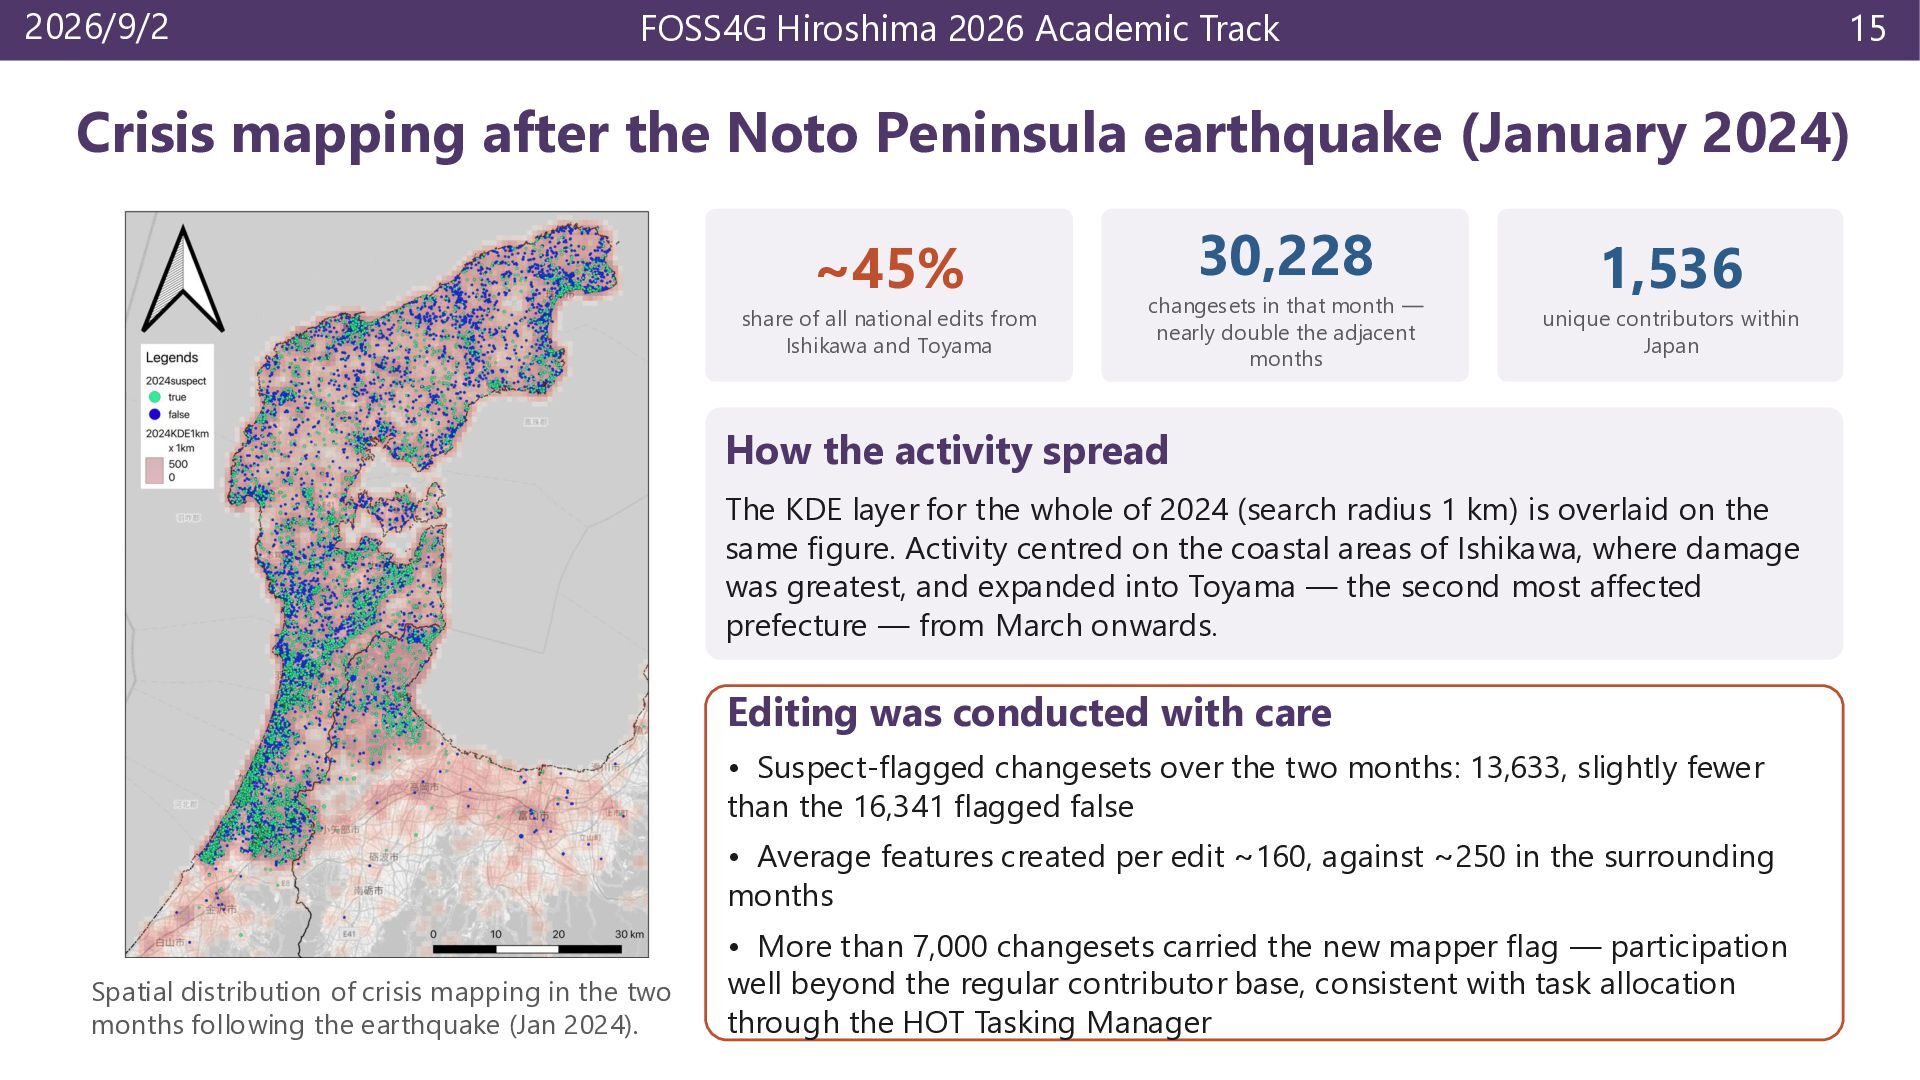
the Noto Peninsula earthquake (January 2024) ~45% share of all national edits from Ishikawa and Toyama 30,228 changesets in that month — nearly double the adjacent months 1,536 unique contributors within Japan How the activity spread The KDE layer for the whole of 2024 (search radius 1 km) is overlaid on the same figure. Activity centred on the coastal areas of Ishikawa, where damage was greatest, and expanded into Toyama — the second most affected prefecture — from March onwards. Editing was conducted with care • Suspect-flagged changesets over the two months: 13,633, slightly fewer than the 16,341 flagged false • Average features created per edit ~160, against ~250 in the surrounding months Spatial distribution of crisis mapping in the two months following the earthquake (Jan 2024). • More than 7,000 changesets carried the new mapper flag — participation well beyond the regular contributor base, consistent with task allocation through the HOT Tasking Manager
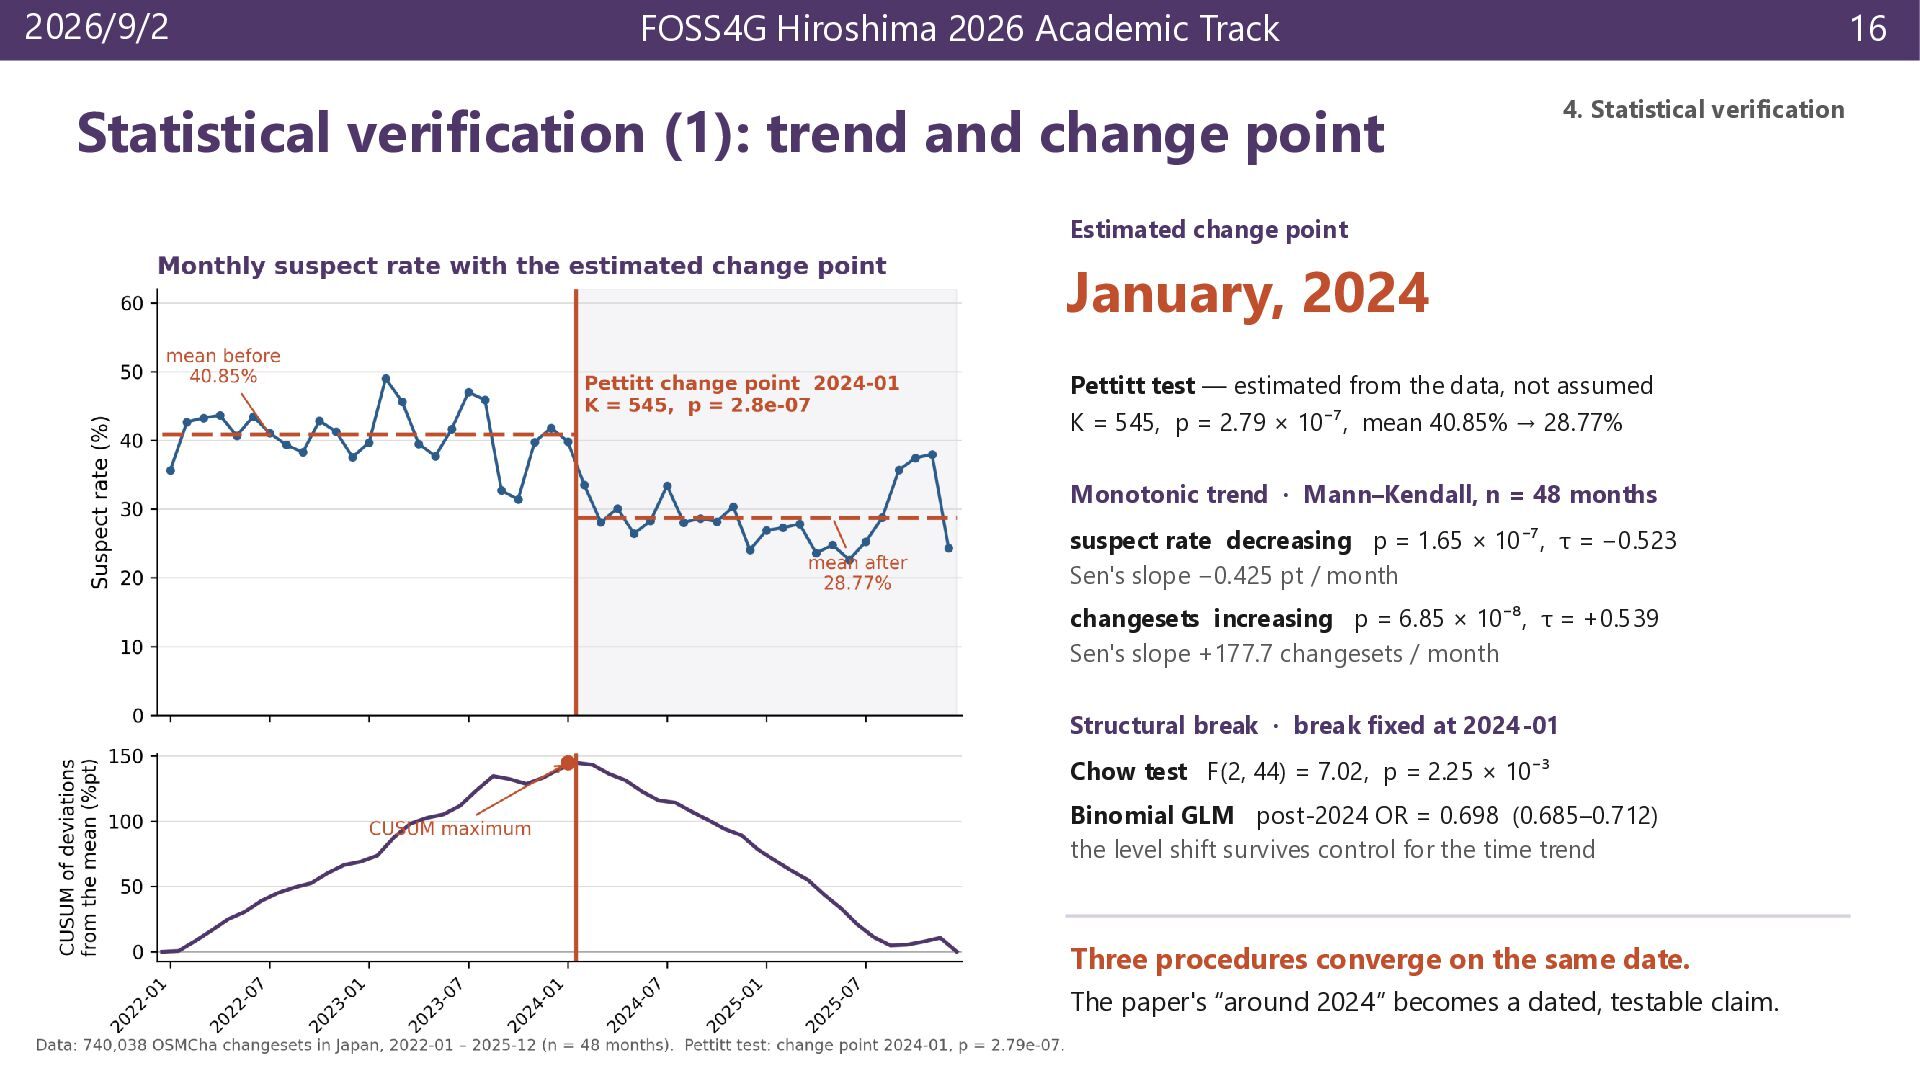
and change point 16 4. Statistical verification Estimated change point January, 2024 Pettitt test — estimated from the data, not assumed K = 545, p = 2.79 × 10⁻⁷, mean 40.85% → 28.77% Monotonic trend · Mann–Kendall, n = 48 months suspect rate decreasing p = 1.65 × 10⁻⁷, τ = −0.523 Sen's slope −0.425 pt / month changesets increasing p = 6.85 × 10⁻⁸, τ = +0.539 Sen's slope +177.7 changesets / month Structural break · break fixed at 2024-01 Chow test F(2, 44) = 7.02, p = 2.25 × 10⁻³ Binomial GLM post-2024 OR = 0.698 (0.685–0.712) the level shift survives control for the time trend Three procedures converge on the same date. The paper's “around 2024” becomes a dated, testable claim.
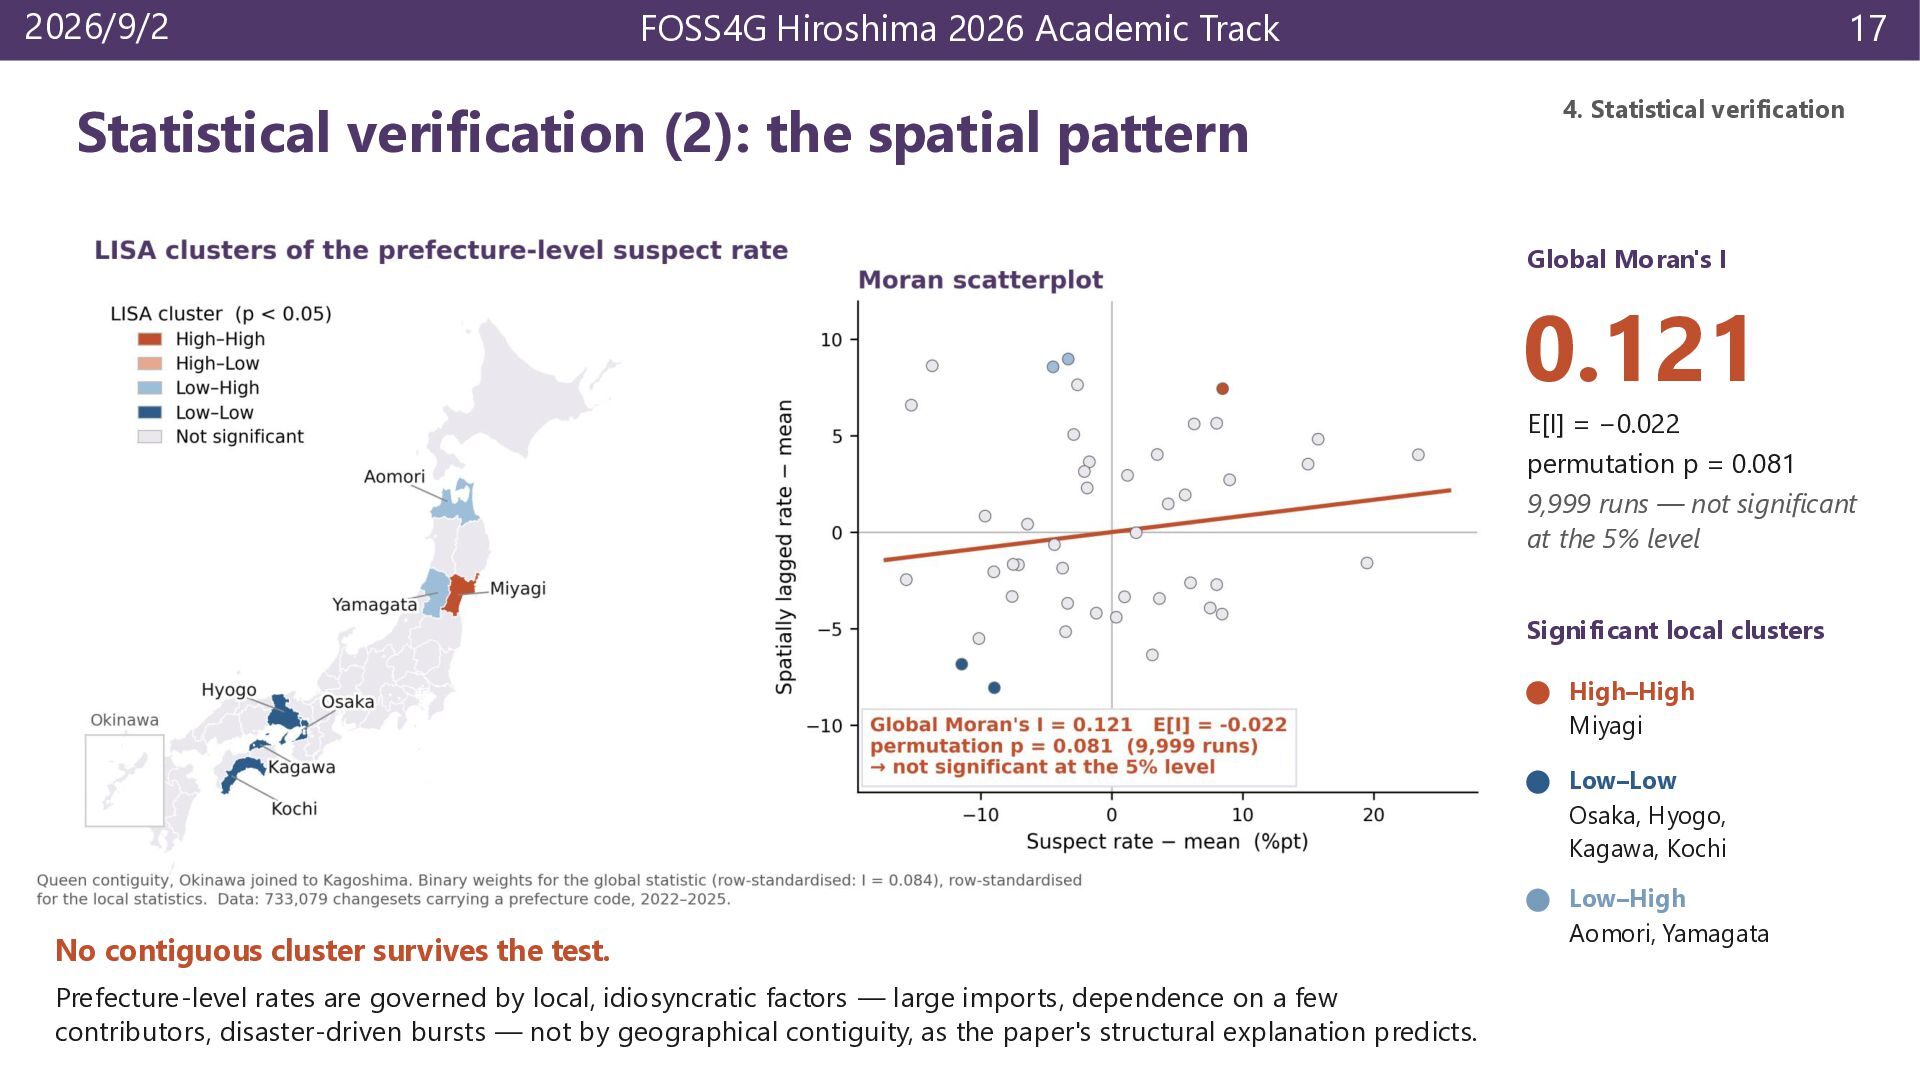
spatial pattern 17 4. Statistical verification Global Moran's I 0.121 E[I] = −0.022 permutation p = 0.081 9,999 runs — not significant at the 5% level Significant local clusters High–High Miyagi Low–Low Osaka, Hyogo, Kagawa, Kochi No contiguous cluster survives the test. Prefecture-level rates are governed by local, idiosyncratic factors — large imports, dependence on a few contributors, disaster-driven bursts — not by geographical contiguity, as the paper's structural explanation predicts. Low–High Aomori, Yamagata
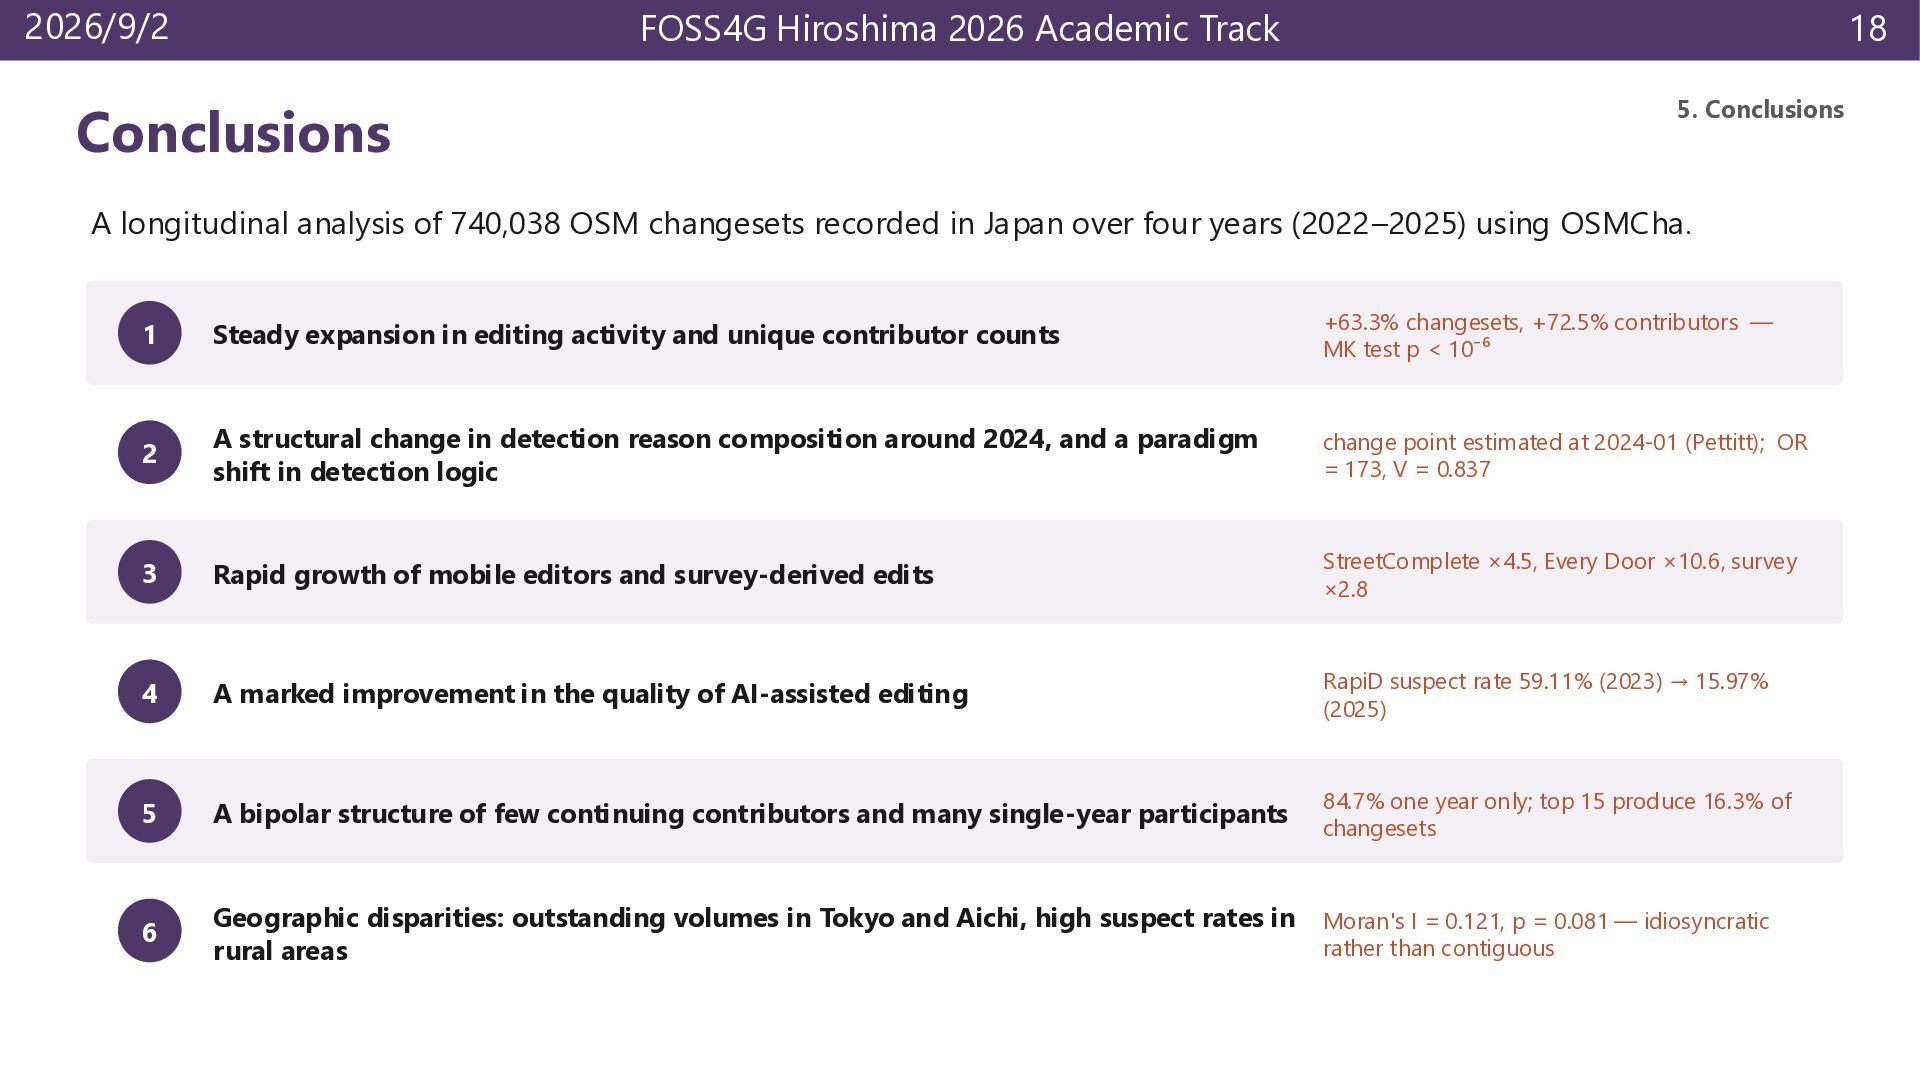
A longitudinal analysis of 740,038 OSM changesets recorded in Japan over four years (2022–2025) using OSMCha. 1 Steady expansion in editing activity and unique contributor counts +63.3% changesets, +72.5% contributors — MK test p < 10⁻⁶ 2 A structural change in detection reason composition around 2024, and a paradigm shift in detection logic change point estimated at 2024-01 (Pettitt); OR = 173, V = 0.837 3 Rapid growth of mobile editors and survey-derived edits StreetComplete ×4.5, Every Door ×10.6, survey ×2.8 4 A marked improvement in the quality of AI-assisted editing RapiD suspect rate 59.11% (2023) → 15.97% (2025) 5 A bipolar structure of few continuing contributors and many single-year participants 84.7% one year only; top 15 produce 16.3% of changesets 6 Geographic disparities: outstanding volumes in Tokyo and Aichi, high suspect rates in Moran's I = 0.121, p = 0.081 — idiosyncratic rather than contiguous rural areas
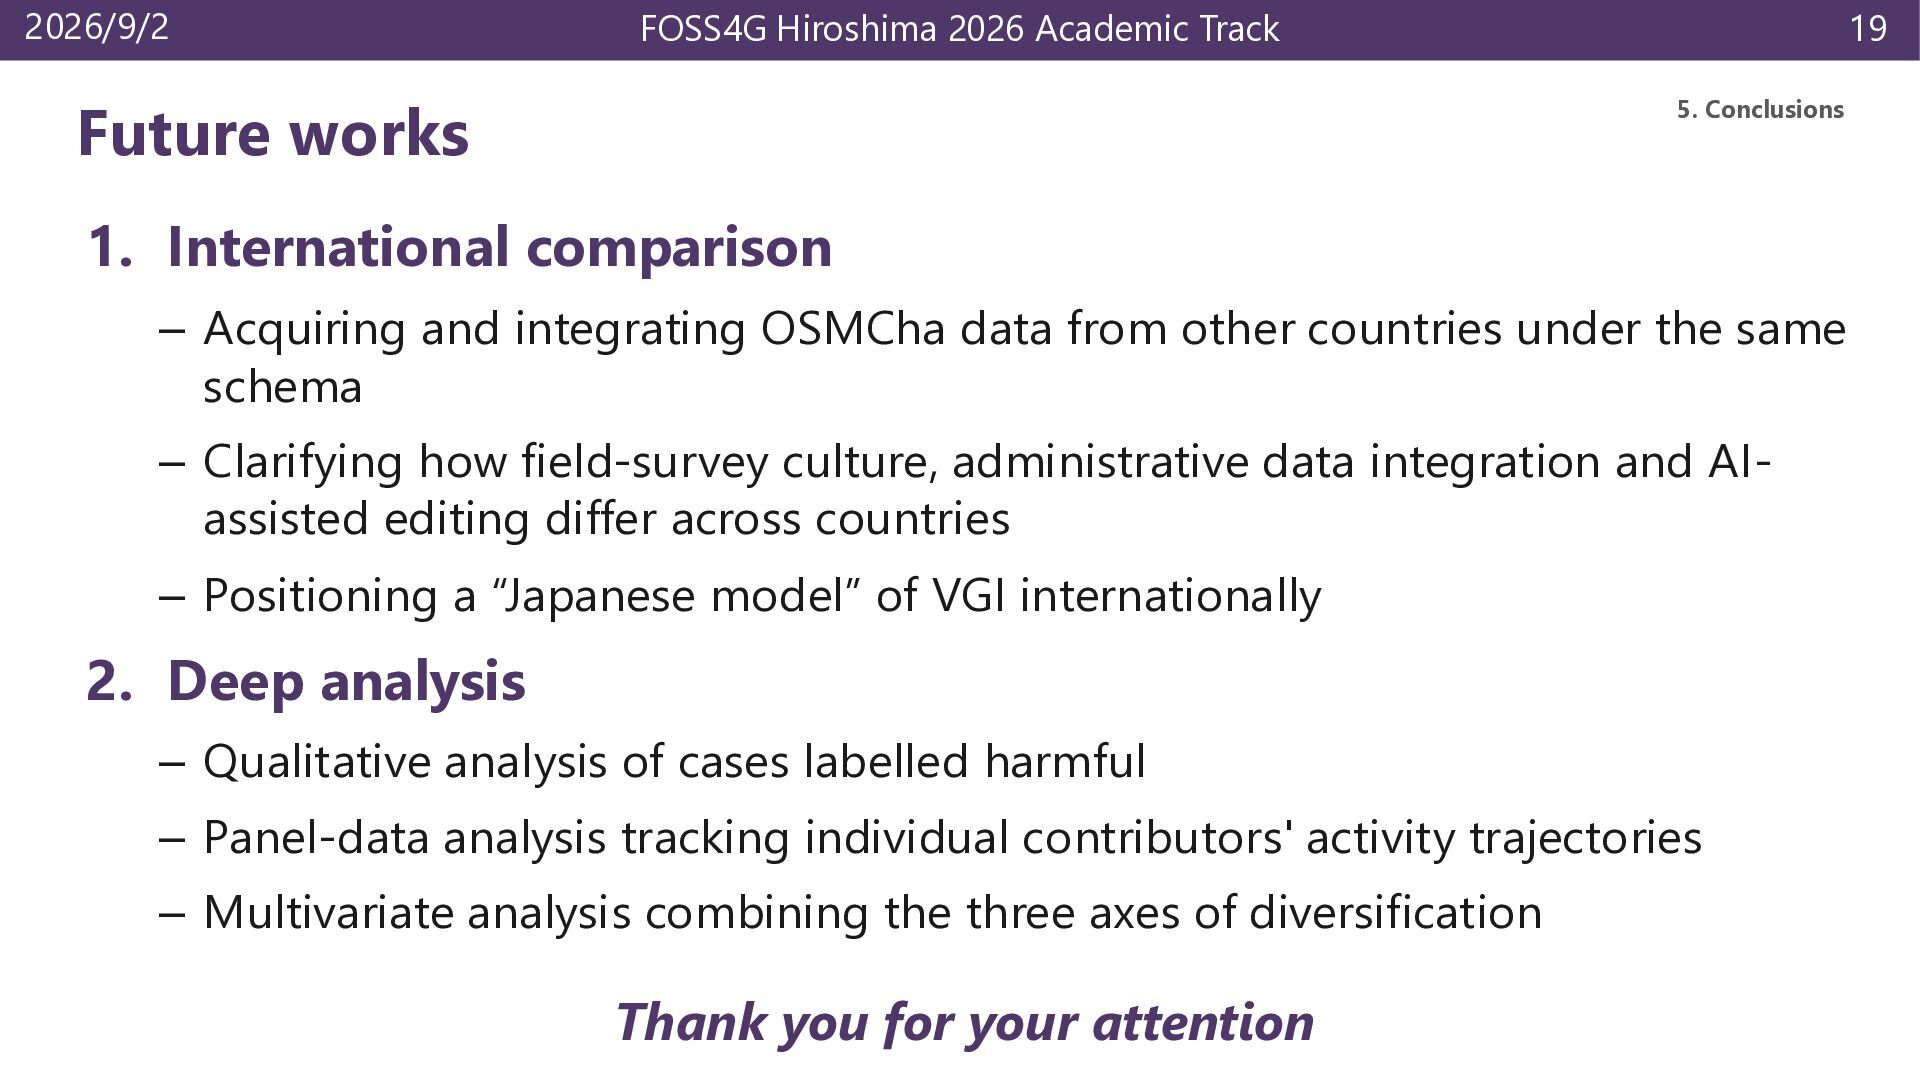
Conclusions 1. International comparison – Acquiring and integrating OSMCha data from other countries under the same schema – Clarifying how field-survey culture, administrative data integration and AIassisted editing differ across countries – Positioning a “Japanese model” of VGI internationally 2. Deep analysis – Qualitative analysis of cases labelled harmful – Panel-data analysis tracking individual contributors' activity trajectories – Multivariate analysis combining the three axes of diversification Thank you for your attention
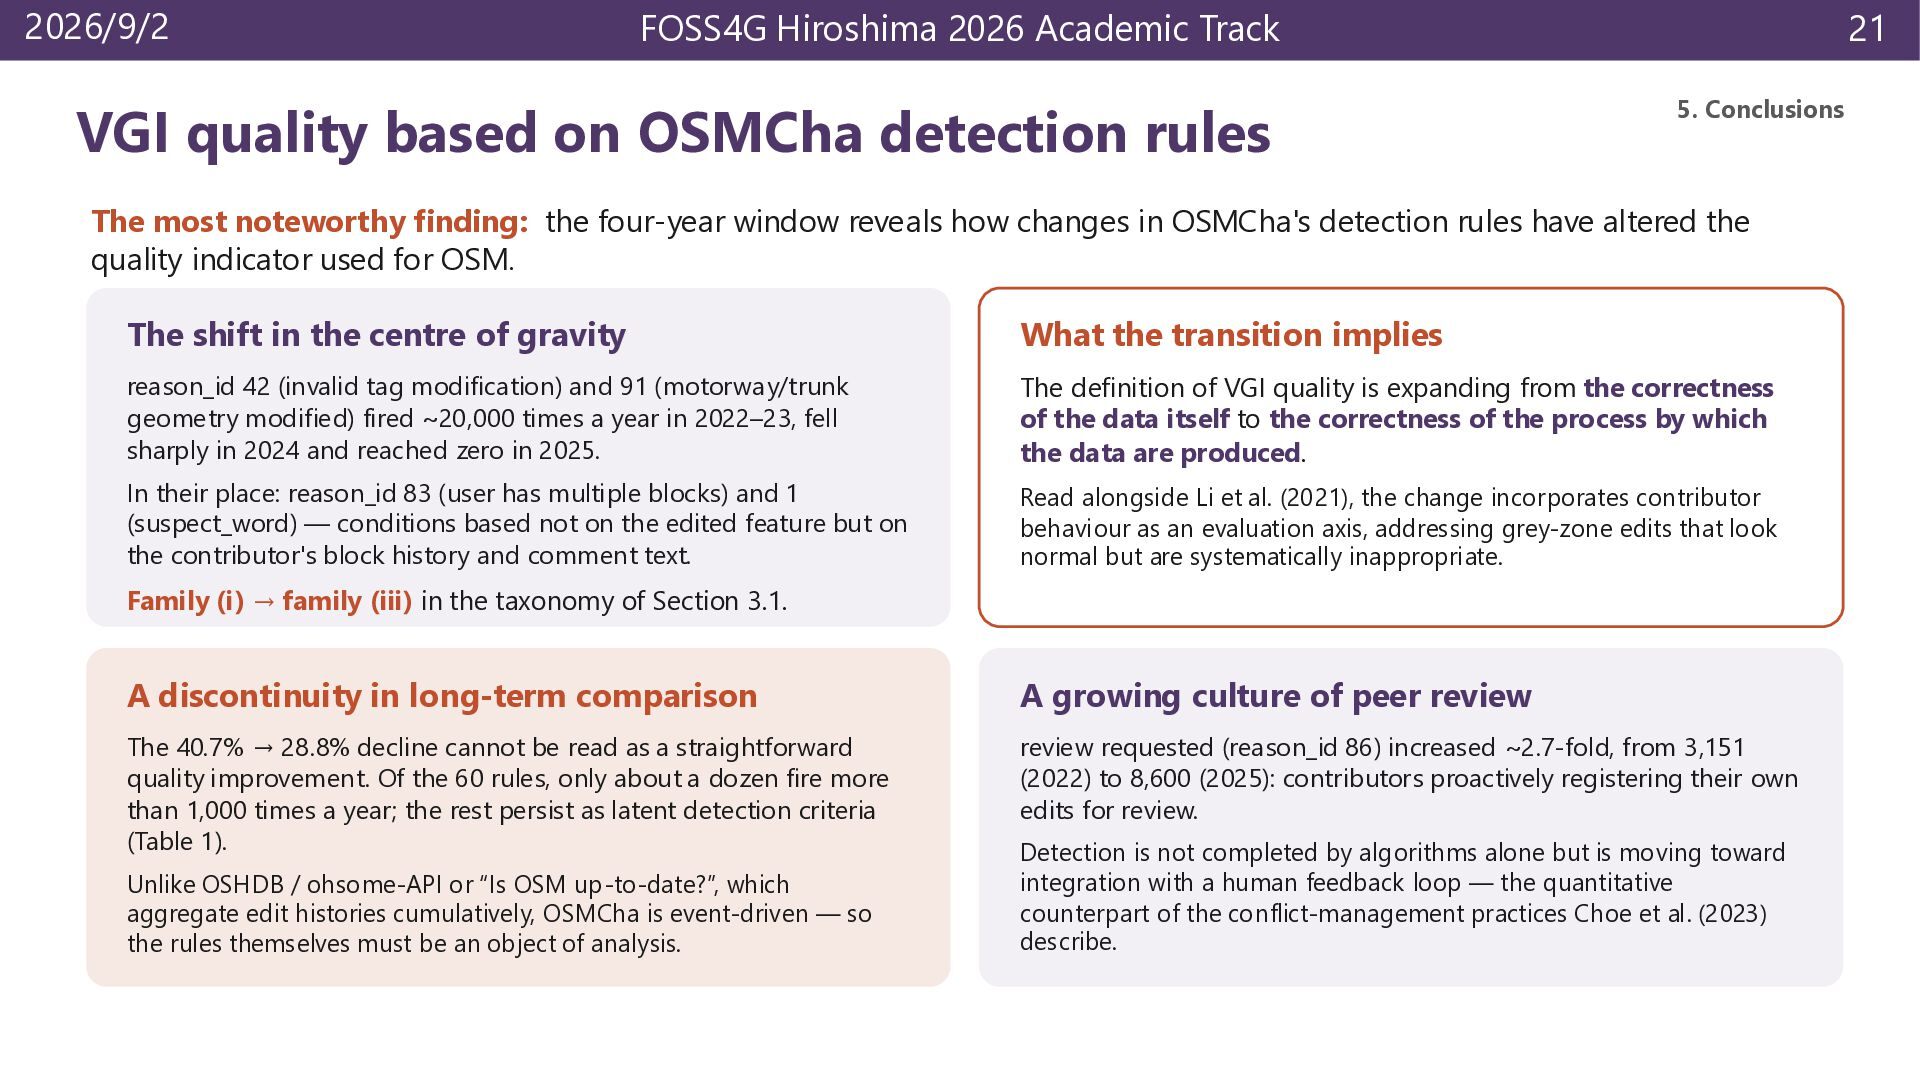
OSMCha detection rules 21 5. Conclusions The most noteworthy finding: the four-year window reveals how changes in OSMCha's detection rules have altered the quality indicator used for OSM. The shift in the centre of gravity What the transition implies reason_id 42 (invalid tag modification) and 91 (motorway/trunk geometry modified) fired ~20,000 times a year in 2022–23, fell sharply in 2024 and reached zero in 2025. The definition of VGI quality is expanding from the correctness of the data itself to the correctness of the process by which the data are produced. In their place: reason_id 83 (user has multiple blocks) and 1 (suspect_word) — conditions based not on the edited feature but on the contributor's block history and comment text. Read alongside Li et al. (2021), the change incorporates contributor behaviour as an evaluation axis, addressing grey-zone edits that look normal but are systematically inappropriate. Family (i) → family (iii) in the taxonomy of Section 3.1. A discontinuity in long-term comparison A growing culture of peer review The 40.7% → 28.8% decline cannot be read as a straightforward quality improvement. Of the 60 rules, only about a dozen fire more than 1,000 times a year; the rest persist as latent detection criteria (Table 1). review requested (reason_id 86) increased ~2.7-fold, from 3,151 (2022) to 8,600 (2025): contributors proactively registering their own edits for review. Unlike OSHDB / ohsome-API or “Is OSM up-to-date?”, which aggregate edit histories cumulatively, OSMCha is event-driven — so the rules themselves must be an object of analysis. Detection is not completed by algorithms alone but is moving toward integration with a human feedback loop — the quantitative counterpart of the conflict-management practices Choe et al. (2023) describe.
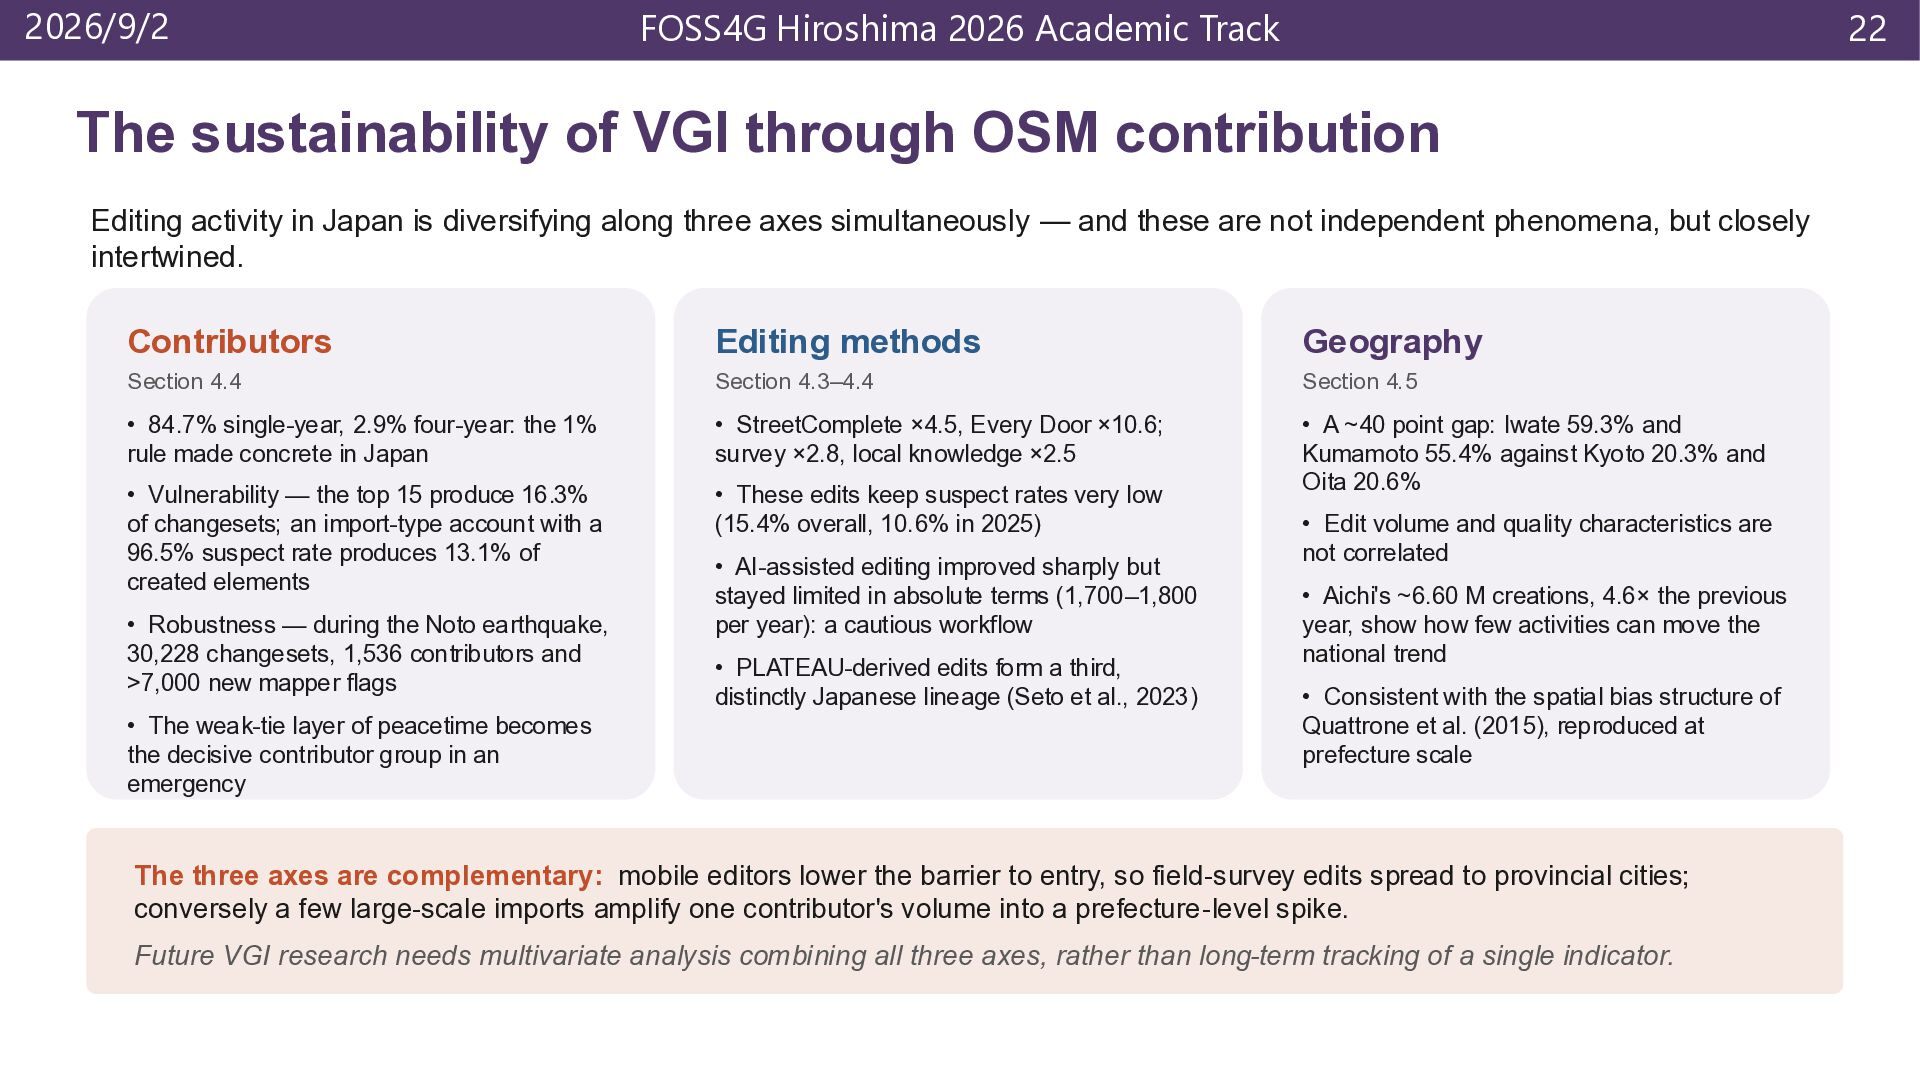
VGI through OSM contribution Editing activity in Japan is diversifying along three axes simultaneously — and these are not independent phenomena, but closely intertwined. Contributors Editing methods Geography Section 4.4 Section 4.3–4.4 Section 4.5 • 84.7% single-year, 2.9% four-year: the 1% rule made concrete in Japan • StreetComplete ×4.5, Every Door ×10.6; survey ×2.8, local knowledge ×2.5 • Vulnerability — the top 15 produce 16.3% of changesets; an import-type account with a 96.5% suspect rate produces 13.1% of created elements • These edits keep suspect rates very low (15.4% overall, 10.6% in 2025) • A ~40 point gap: Iwate 59.3% and Kumamoto 55.4% against Kyoto 20.3% and Oita 20.6% • Robustness — during the Noto earthquake, 30,228 changesets, 1,536 contributors and >7,000 new mapper flags • The weak-tie layer of peacetime becomes the decisive contributor group in an emergency • AI-assisted editing improved sharply but stayed limited in absolute terms (1,700–1,800 per year): a cautious workflow • PLATEAU-derived edits form a third, distinctly Japanese lineage (Seto et al., 2023) • Edit volume and quality characteristics are not correlated • Aichi's ~6.60 M creations, 4.6× the previous year, show how few activities can move the national trend • Consistent with the spatial bias structure of Quattrone et al. (2015), reproduced at prefecture scale The three axes are complementary: mobile editors lower the barrier to entry, so field-survey edits spread to provincial cities; conversely a few large-scale imports amplify one contributor's volume into a prefecture-level spike. Future VGI research needs multivariate analysis combining all three axes, rather than long-term tracking of a single indicator.
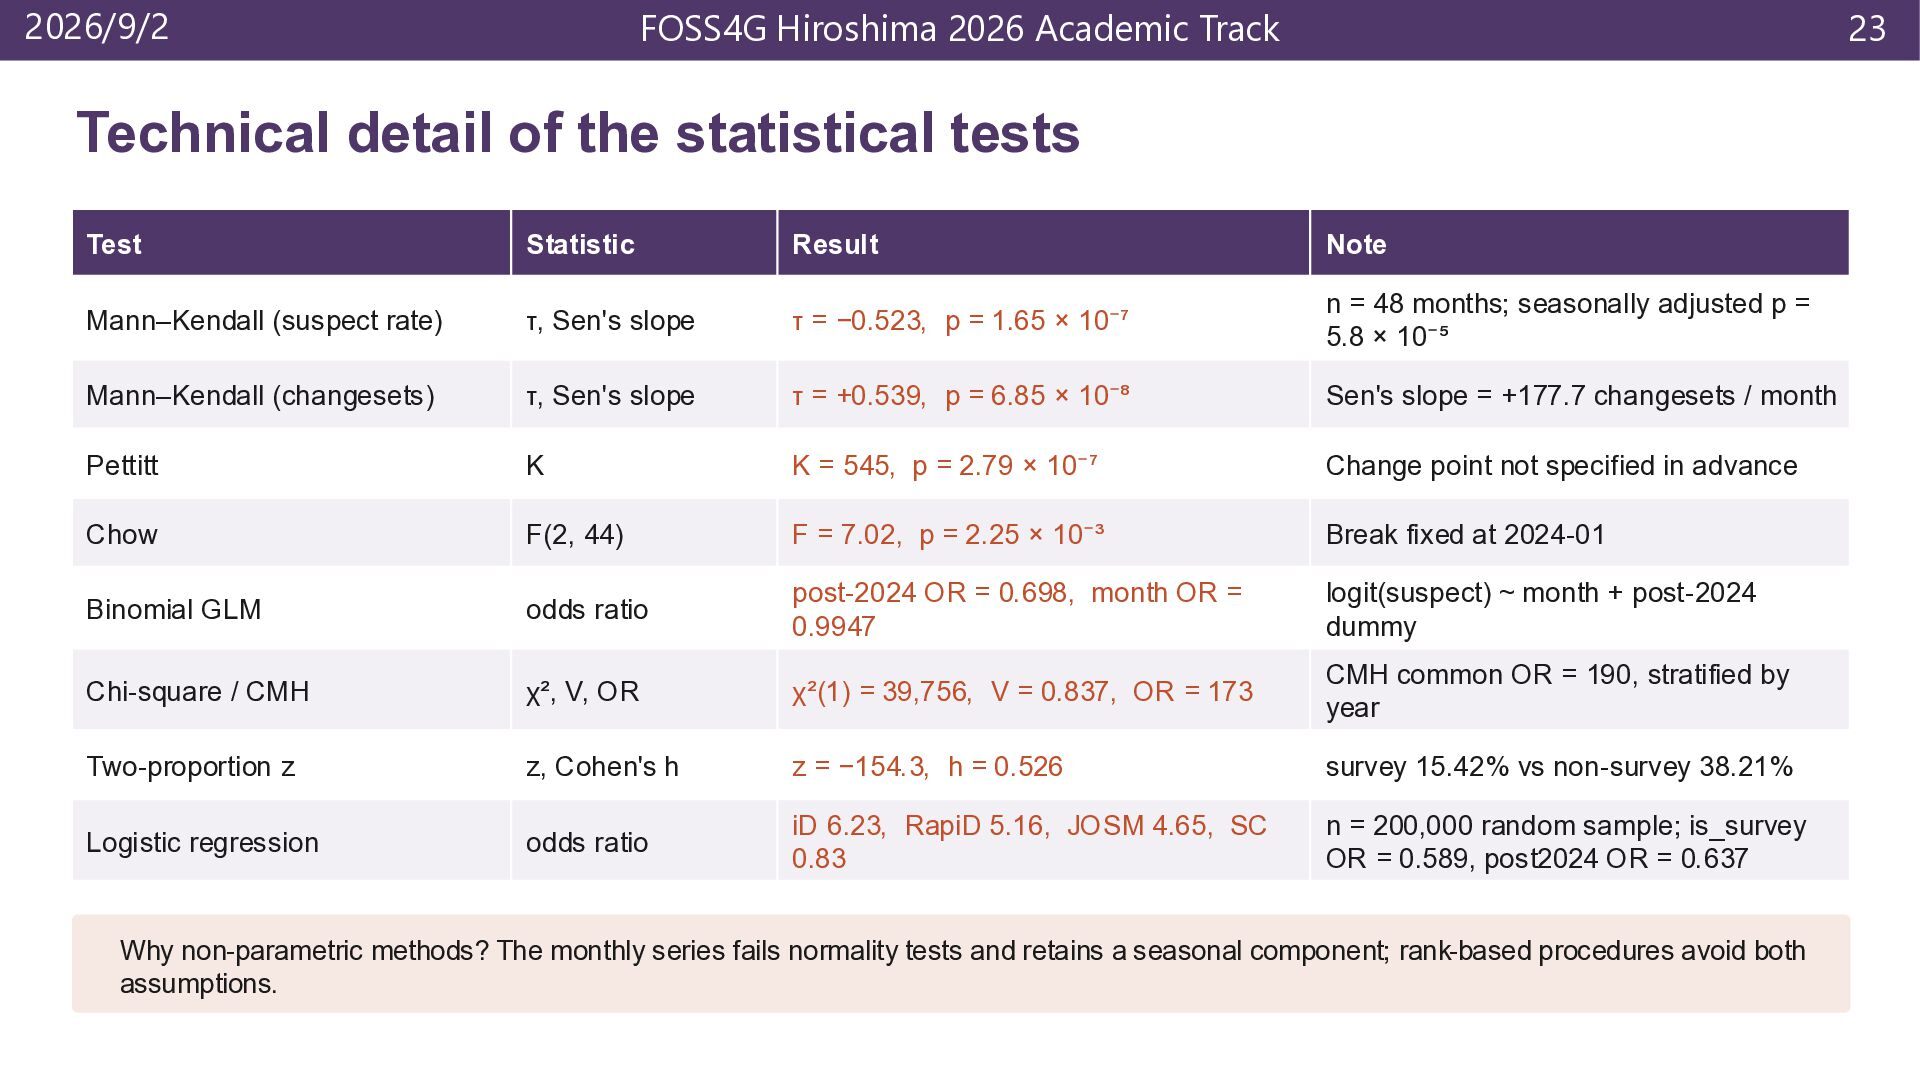
the statistical tests Test Statistic Result Note Mann–Kendall (suspect rate) τ, Sen's slope τ = −0.523, p = 1.65 × 10⁻⁷ n = 48 months; seasonally adjusted p = 5.8 × 10⁻⁵ Mann–Kendall (changesets) τ, Sen's slope τ = +0.539, p = 6.85 × 10⁻⁸ Sen's slope = +177.7 changesets / month Pettitt K K = 545, p = 2.79 × 10⁻⁷ Change point not specified in advance Chow F(2, 44) F = 7.02, p = 2.25 × 10⁻³ Break fixed at 2024-01 Binomial GLM odds ratio post-2024 OR = 0.698, month OR = 0.9947 logit(suspect) ~ month + post-2024 dummy Chi-square / CMH χ², V, OR χ²(1) = 39,756, V = 0.837, OR = 173 CMH common OR = 190, stratified by year Two-proportion z z, Cohen's h z = −154.3, h = 0.526 survey 15.42% vs non-survey 38.21% Logistic regression odds ratio iD 6.23, RapiD 5.16, JOSM 4.65, SC 0.83 n = 200,000 random sample; is_survey OR = 0.589, post2024 OR = 0.637 Why non-parametric methods? The monthly series fails normality tests and retains a seasonal component; rank-based procedures avoid both assumptions.
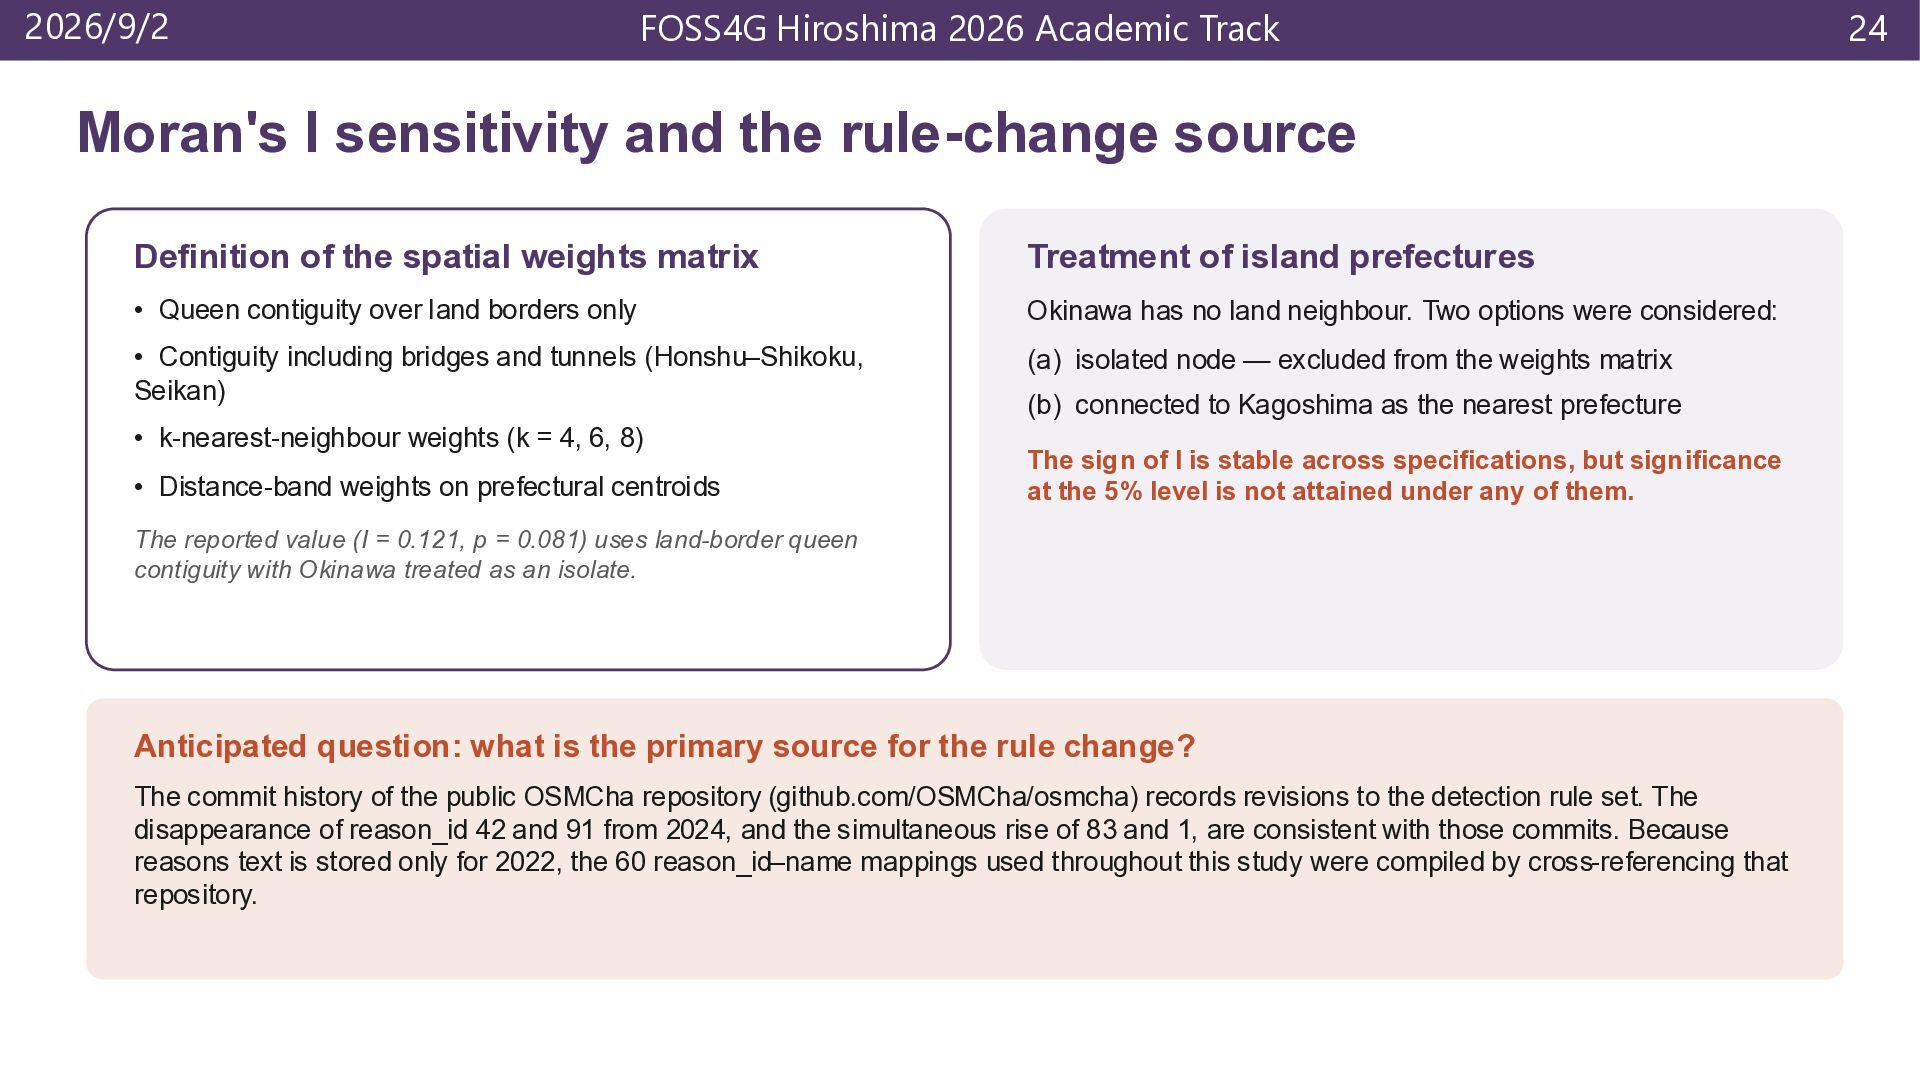
the rule-change source Definition of the spatial weights matrix Treatment of island prefectures • Queen contiguity over land borders only Okinawa has no land neighbour. Two options were considered: • Contiguity including bridges and tunnels (Honshu–Shikoku, Seikan) (a) isolated node — excluded from the weights matrix • k-nearest-neighbour weights (k = 4, 6, 8) • Distance-band weights on prefectural centroids (b) connected to Kagoshima as the nearest prefecture The sign of I is stable across specifications, but significance at the 5% level is not attained under any of them. The reported value (I = 0.121, p = 0.081) uses land-border queen contiguity with Okinawa treated as an isolate. Anticipated question: what is the primary source for the rule change? The commit history of the public OSMCha repository (github.com/OSMCha/osmcha) records revisions to the detection rule set. The disappearance of reason_id 42 and 91 from 2024, and the simultaneous rise of 83 and 1, are consistent with those commits. Because reasons text is stored only for 2022, the 60 reason_id–name mappings used throughout this study were compiled by cross-referencing that repository. 24


 tosseto
 juanmartin2026
 rashwhitman
 akiraasano
 matleenalaakso
 yatabe
 pawan_pharm
 mutomasa
 frievea
 kimpetersen
 sergeychernyshev
 sonatard
 tammyeverts
 sstephenson
 lfama
lfama
 ryanjones
 katarinadahlin
 thekraken
 rmw
rmw
 panda_program
 destraynor