Upgrade to Pro — share decks privately, control downloads, hide ads and more …

Psychometric considerations for learning maps-based assessments

Jake Thompson
February 22, 2019

Psychometric considerations for learning maps-based assessments

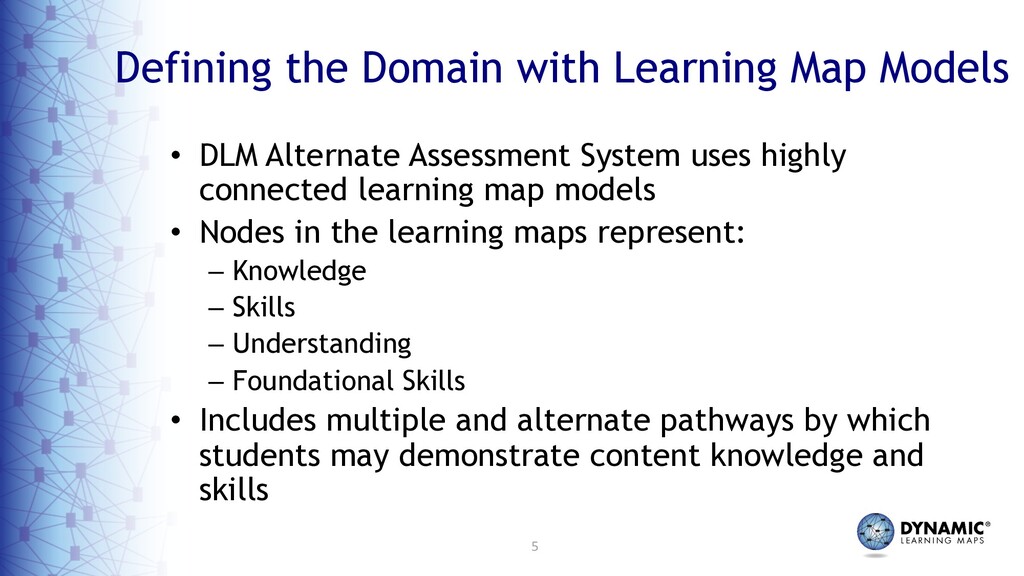
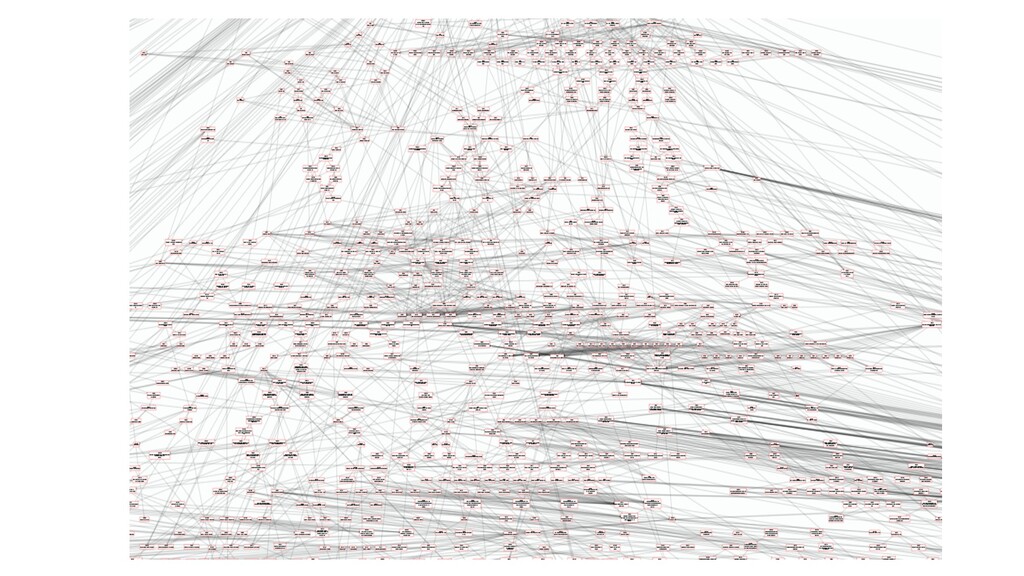
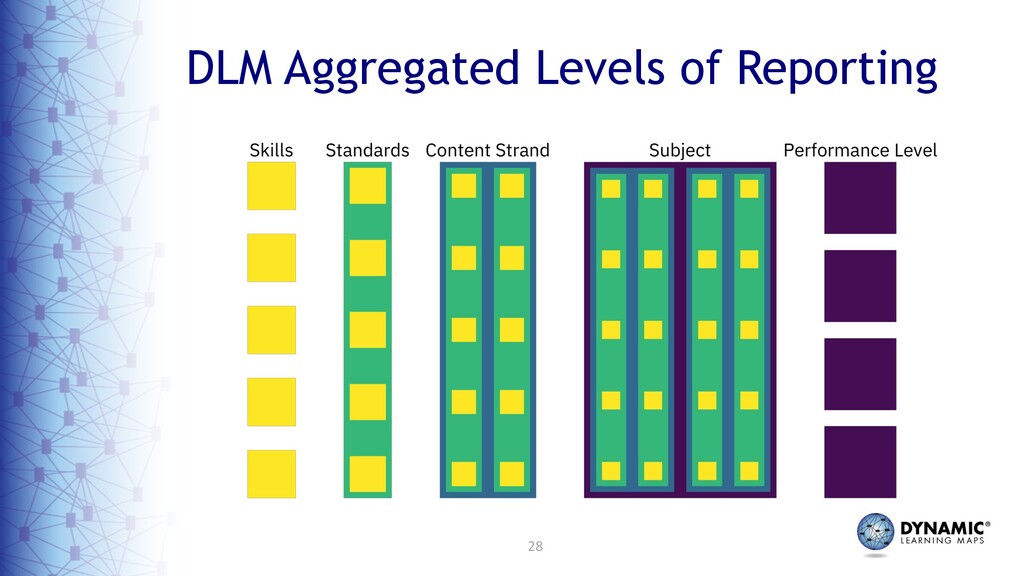
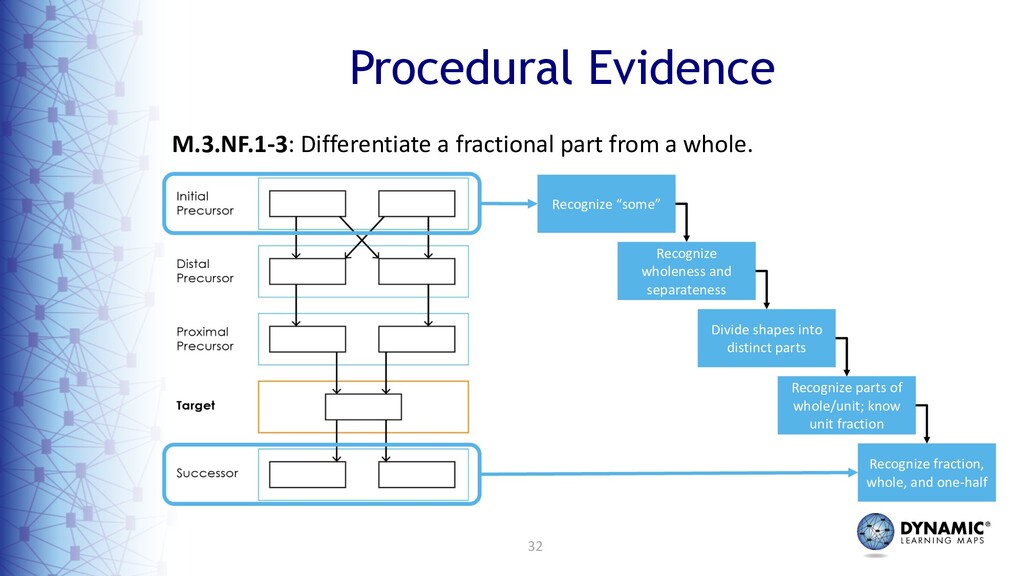
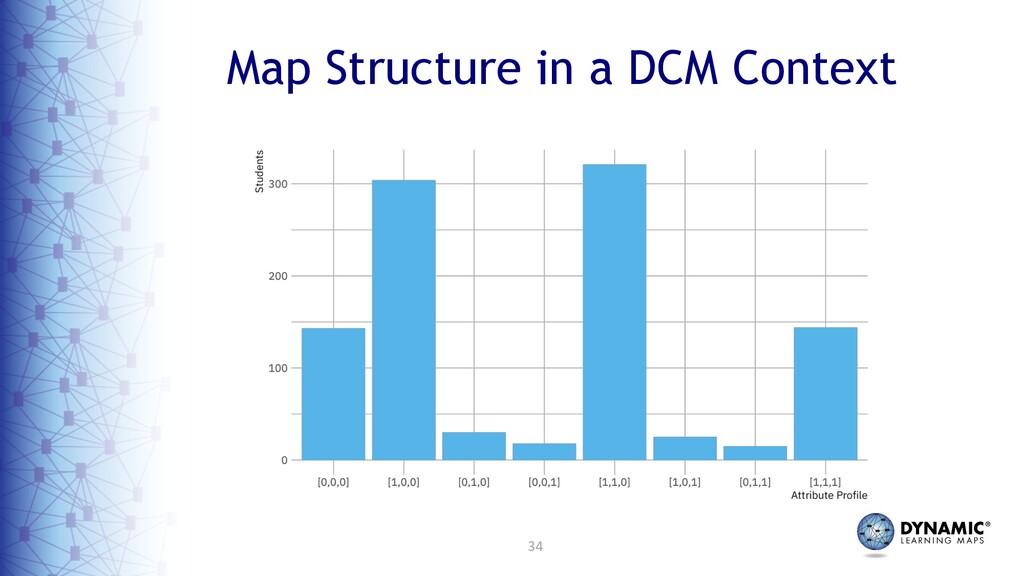
Learning map models are a type of cognitive model composed of multiple interconnected learning targets and other critical knowledge and skills. The Dynamic Learning Maps (DLM) Alternate Assessment System uses learning maps models as the basis for assessment for students with significant cognitive disabilities. The DLM maps and corresponding assessments provide access to multiple and alternate routes to achieving the learning targets, making it more inclusive for learners with various disabilities. However, the unique approach and design of the assessment system designed to maximize accessibility also poses unique psychometric challenges. In this presentation, we will discuss: (1) the DLM assessment design; (2) the diagnostic classification model (DCM) used to evaluate student performance; (3) approaches to empirically evaluating the map structures including future directions for data collection; and (4) results from research conducted on teachers’ interpretations of diagnostic assessment results.

Jake Thompson

February 22, 2019
Tweet

More Decks by Jake Thompson

Other Decks in Education

Transcript

  1. 2 Topics • Overview of DLM assessment design • Diagnostic

    classification modeling • Map validation research • Score report research
  2. 4 DLM Background • Serves students with the most significant

    cognitive disabilities (SCD) • Provides opportunity for students to show what they know and can do in: – English language arts – Mathematics – Science • Consortium of 18 states and the District of Columbia
  3. 5 Defining the Domain with Learning Map Models • DLM

    Alternate Assessment System uses highly connected learning map models • Nodes in the learning maps represent: – Knowledge – Skills – Understanding – Foundational Skills • Includes multiple and alternate pathways by which students may demonstrate content knowledge and skills
  4. 8 Essential Elements • Alternate grade-level expectations (content standards) •

    Provides students access to the maps at five linkage levels: – Initial Precursor (IP) – Distal Precursor (DP) – Proximal Precursor (PP) – Target (T) – Successor (S) • Linkage levels are collections nodes on the path toward the standard
  5. 9

  6. 10 Testlets • Items are administered in short testlets •

    Testlets are collections of 3-9 items centered around an engagement activity – Story or context • Testlets measure a single linkage level • Items measure a single EE
  7. 11 Testlets Measure Linkage Levels Initial Precursor Target Successor Connects

    the learning map … Behavior IP Testlet …to the items delivered. Distal Precursor Proximal Precursor Behavior Behavior Behavior Behavior DP Testlet PP Testlet T Testlet S Testlet *Science has 3 linkage levels: Initial, Precursor, and Target
  8. 12 Goals of the Testlet Assignment Process • Assign first

    testlet content that is both rigorous and also something the student can access. • Base subsequent testlet assignments on student performance to provide the closest match to students’ knowledge and skills while covering blueprint requirements.
  9. 13 Testlet Assignment Process The DLM spring testlet assignment process

    involves two main steps: 1. the selection of linkage level for the first administered testlet is determined from survey information about the student, and 2. the assignment of linkage level for all subsequent administered testlets occurs through adaptive routing.
  10. 16 Moving to a More Fine-Grained Model Distinguish things that

    grow from things that don’t grow. Initial Provide evidence that plants grow. Precursor Provide evidence that plants need air and water to grow. Target SCI.5.LS.1.1: Provide evidence that plants need air and water to grow.
  11. 17 Diagnostic Classification Modeling • Diagnostic classification modeling (DCM) is

    a statistical method that provides diagnostic feedback about students’ mastery of discrete skills • Latent class analyses are conducted separately for each linkage level for each EE.
  12. 18 DLM Scoring Overview • DCM is used to create

    a profile of skill mastery ! "# = % &'( ) *& + ,'( - . ,& /0(1 − .,& )(5/0 • To create the mastery profile, each student is classified as either a master or non-master of each linkage level (LL) within an Essential Element
  13. 19 Defining Mastery For DLM assessments, there are three ways

    to be considered a master of a linkage level: 1. The student’s probability of mastery from the diagnostic model is estimated to be ≥0.8, OR 2. The student answered ≥80% of items correctly for the linkage level, OR 3. If neither of the first two conditions occurs, mastery status is assigned two levels down from the linkage level assessed.
  14. 20 Linkage Level Mastery: Probability Using all student responses to

    items for a given linkage level within an Essential Element, the statistical model is applied to determine the probability that a student is a master of that linkage level: Definitely Not Mastered (0% chance of mastery) Definitely Mastered (100% chance of mastery) 0 100
  15. 21 Linkage Level Mastery: Probability The statistical model tells us

    the probability that the student is a master. For DLM assessments, the student must have an 80% or greater chance of mastery to be considered a master. Definitely Not Mastered (0% chance of mastery) Definitely Mastered (100% chance of mastery) 0 100 27% chance 53% chance 86% chance
  16. 22 Linkage Level Mastery: Percent Correct • If mastery is

    not demonstrated based on probability, mastery can alternately be achieved by percent correct. • Using all student responses to items for a given linkage level within an Essential Element, if the percent correct is ≥80%, the student is classified as a master.
  17. 23 Linkage Level Mastery: Two-Down Rule • If mastery is

    not demonstrated by probability or percent correct, mastery status is assigned two linkage levels down from the linkage level assessed No Mastery Initial Precursor Distal Precursor Proximal Precursor Target Successor No Mastery Initial Precursor Target
  18. 25 Aggregating Linkage Level Performance • Linkage level results must

    be combined to determine how the student performed on the Essential Element • When mastery is demonstrated for higher linkage levels, students are also deemed masters of lower linkage levels within an Essential Element. • The total mastered linkage levels are summed to determine overall performance in the subject
  19. 26 Example EE Mastery • Student tests on the Target

    – Answers 80% of items correctly – Posterior probability of mastery is 97% • Master of Target • Master of all below Initial Precursor Distal Precursor Proximal Precursor Target Successor
  20. 27 Example EE Mastery • Student tests on the Target

    – Answers 75% of items correctly – Posterior probability of mastery is 63% • Master of Distal Precursor • Master of all below Initial Precursor Distal Precursor Proximal Precursor Target Successor
  21. 29 Summary of Stages of Scoring Performance Level Classification Highest

    LL Mastered by EE Total LLs Mastered Statistical Modeling of LL Mastery Items Administered
  22. 31 It All Starts With the Map • Key assumption:

    the map is correct • Two levels to the assumption: 1. Hierarchical ordering of linkage levels 2. Map structure • How do validate this assumption? – Procedural Evidence – Empirical Evidence
  23. 32 M.3.NF.1-3: Differentiate a fractional part from a whole. Procedural

    Evidence Recognize “some” Recognize wholeness and separateness Divide shapes into distinct parts Recognize parts of whole/unit; know unit fraction Recognize fraction, whole, and one-half
  24. 33 Empirical Methods • Current efforts focused on Phase I:

    Linkage Level Ordering • Three methods – Patterns of Mastery Profiles – Patterns of Mastery Assignment – Patterns of Attribute Difficulty
  25. 35 Attribute Hierarchies ELA and Mathematics Science [0,0,0] [1,0,0] [1,1,0]

    [1,1,1] [0,0,0,0,0] [1,0,0,0,0] [1,1,0,0,0] [1,1,1,0,0] [1,1,1,1,0] [1,1,1,1,1]
  26. 36 Patterns of Mastery Profiles • Estimate two models –

    Saturated model: all possible profiles – Reduced model: only hypothesized profiles • Assess model fit – Posterior predictive model checks – Model comparisons Initial Precursor Target 0 0 0 1 0 0 0 1 0 0 0 1 1 1 0 1 0 1 0 1 1 1 1 1
  27. 39 Relative Fit • Leave-one-out cross validation (LOO) • Predictive

    density • Balances predictive power with model complexity Model LOO ELPD Standard Error Saturated -88717.4 174.9 Reduced -89691.3 377.5 Comparison -973.9 259.7
  28. 40 Limitations • Both models must converge – Requires respondents

    in all possible classes – Requires respondents to test on multiple attributes • What to do when these requirements are not met?
  29. 41 Patterns of Attribute Mastery • Estimate each attribute as

    a separate 1-attribute DCM (equivalent to LCA) • Set mastery threshold (0.8) Student Initial Precursor Target 1 .97 .85 .43 2 .86 .52 .13 3 .92 .89 .83 4 .88 .65 .85 5 .55 .70 .33 … … … … Student Initial Precursor Target 1 1 1 0 2 1 0 0 3 1 1 1 4 1 0 1 5 0 0 0 … … … … Student Initial Precursor Target 1 1 1 0 2 1 0 0 3 1 1 1 4 1 0 1 5 0 0 0 … … … …
  30. 42 Analyzing Reversals • 9.4% of students had an unexpected

    attribute mastery profile – 51% flagged for reversal between Initial and Precursor levels – 49% flagged for reversal between Precursor and Target
  31. 43 Limitations • Doesn’t directly account for the relationships between

    attributes • Different mastery thresholds will give different results • Doesn’t account for error in the mastery classifications
  32. 44 Patterns of Attribute Difficulty • Measure difficulty of linkage

    levels using p- values • Group similar students • Calculate the weighted average p-value for a linkage level (attribute) and group Item p-value SE Weight Scaled 1 0.20 0.03 874.47 0.09 2 0.18 0.03 979.15 0.10 3 0.23 0.04 814.34 0.08 4 0.21 0.03 852.96 0.09 5 0.13 0.03 1,280.77 0.13 6 0.23 0.04 796.96 0.08 7 0.09 0.02 1,708.21 0.17 8 0.25 0.04 749.40 0.08 9 0.18 0.03 949.76 0.10 10 0.20 0.03 874.47 0.09 Avg. 0.18 0.13
  33. 45 Difficulty Patterns • Most groups follow the expected pattern

    • Band 3 reversed, but within the margin of error
  34. 46 Limitations • Not model based • Single p-value obscures

    a property of diagnostic models – p-value for masters – p-value for non-masters • Assumes some level of consistency within groups
  35. 47 Ongoing Research • Field Test – Assigning tests from

    operational pool at linkage levels adjacent to those tested operationally • I-SMART – Designing multi-node science testlets – Overlapping assignment of tests along “mini- progressions” • AAI-AICFE – Fixed form, multi-node design
  36. 49 Large-Scale Assessment Context • Summative assessment results for specific

    purposes – Inclusion in state accountability metrics – Program evaluation – Resource allocation • Less emphasis on use in classrooms to inform learning
  37. 50 Challenges to Instructional Use of Large-Scale Assessment Results •

    Typically created for summative purposes • Results are useful for reporting aggregated results, but less so for instructional practice • Score reports are often delivered after the conclusion of the academic year • Students advance a grade and are taught the new grade’s academic content standards
  38. 52 Consequential Evidence The Standards for Educational and Psychological Testing

    state: “The validation process involves gathering evidence to evaluate the soundness of proposed interpretations for their intended uses.”
  39. 53

  40. 54 Research Questions 1. How do teachers use diagnostic score

    reports to inform instructional decision-making? 2. How do teachers talk to parents about diagnostic score reports? 3. Are there additional resources teachers need to support their use of diagnostic score reports for instructional decision-making?
  41. 56

  42. 57 Data Collection • Focus groups with 17 teachers from

    3 states • Eligible teachers indicated they: – currently taught one or more students who took DLM assessments in 2017-2018, – received DLM 2017 summative score reports for their 2017-2018 students, and – used the DLM 2017 reports during the 2017-2018 academic year.
  43. 58 Receiving Reports • All received reports in the fall

    – Ranged from email notification to district meeting with discussion • Shared a desire for more information when receiving reports, including direct access to interpretive materials and meetings to discuss how to interpret and use results
  44. 59 Instructional Use • Observed differences by grade level •

    For elementary and middle school teachers, whose students take assessments annually, reports were more useful for instructional decision-making • High school teachers reported more challenges, particularly for 11th grade teachers whose students were last assessed in 8th grade
  45. 60 Instructional Use: Planning • Use fine-grained mastery to plan

    instruction on similar standards – Varied in prioritizing depth versus breadth • PLDs and conceptual area percent of skills mastered to more generally plan instruction for collections of related content standards – Combined with results from other assessments
  46. 61 Instructional Use: IEP Goals “Their IEP goals are very

    similar to their linkage level [statement]. I can say, ‘Hey, let’s look at this linkage level, and let’s look at this target skill and this is what we’re working on in your IEP.’ It’s real easy for me to tie all these things together so we don’t have this weird zigzag of skills. [It’s] more streamlined and better growth.”
  47. 62 Instructional Use: IEP Goals “We have a district assessment

    in the fall, they provide a report and summary. I try to see if there is still a deficiency based on the DLM [results from] the spring in the new report in the fall to see if that is an area that there’s still a weakness. If there is then that’s definitely something I would spend more time on. That’s more of how I create my goals.”
  48. 63 Instructional Use: Groupings • Using mastery to plan instruction

    for students working on the same skills across standards • Desire for an aggregated report that made instructional groupings more clear, particularly around standards and levels students were working on in common
  49. 64 Talking With Parents • With a few exceptions, parents

    generally did not ask questions about the DLM assessment or score reports • The extent of information parents received about the assessment and results was dependent upon what the teacher offered – Teachers did not receive a copy of the Parent Interpretive Guide to distribute with reports – Teachers highlighted importance of understanding assessment and results when talking to parents
  50. 65 Resources: Parents • Conferences and IEP meetings often inundate

    parents with information • Making resources available online – Brief overview, such as a short video explaining system and calculation of results – Parent Interpretive Guide – Cheat sheets for tying academic content to day-to-day interactions (e.g., shopping)
  51. 66 Resources: Teachers • More training: – e.g., 1) complete

    required training; 2) receive reports and discuss how to interpret; 3) planning instruction from report, including cross-grade collaborations • Aggregate reporting: – Summary information to make instructional groupings more readily apparent
  52. 67 Resources: District • More training at district level on

    assessment and interpretation to facilitate professional development • District aggregated reports to identify standards or conceptual areas that tend to be more challenging – Use to identify resources to facilitate instruction in those areas
  53. 68 Key Takeaways 1. Challenge identifying eligible teachers – Both

    receiving reports and use 2. Utility for diagnostic results – Instructional use, IEP goal setting, & instructional groupings 3. Teachers desire professional development to better understand score report contents and ways to use 4. Programmatic opportunities for making instructional and assessment resources more widely available to parents, teachers, and districts – Finding the right balance of local control and availability of resources
  54. 69 Considerations for the Field 1. Expanding collection of consequential

    evidence 2. Availability of resources and interpretive guides and how to ensure the appropriate groups have access 3. Making reports available at a level of reporting that supports instructional practice – Balanced with technically sound measurement that supports making inferences at this level