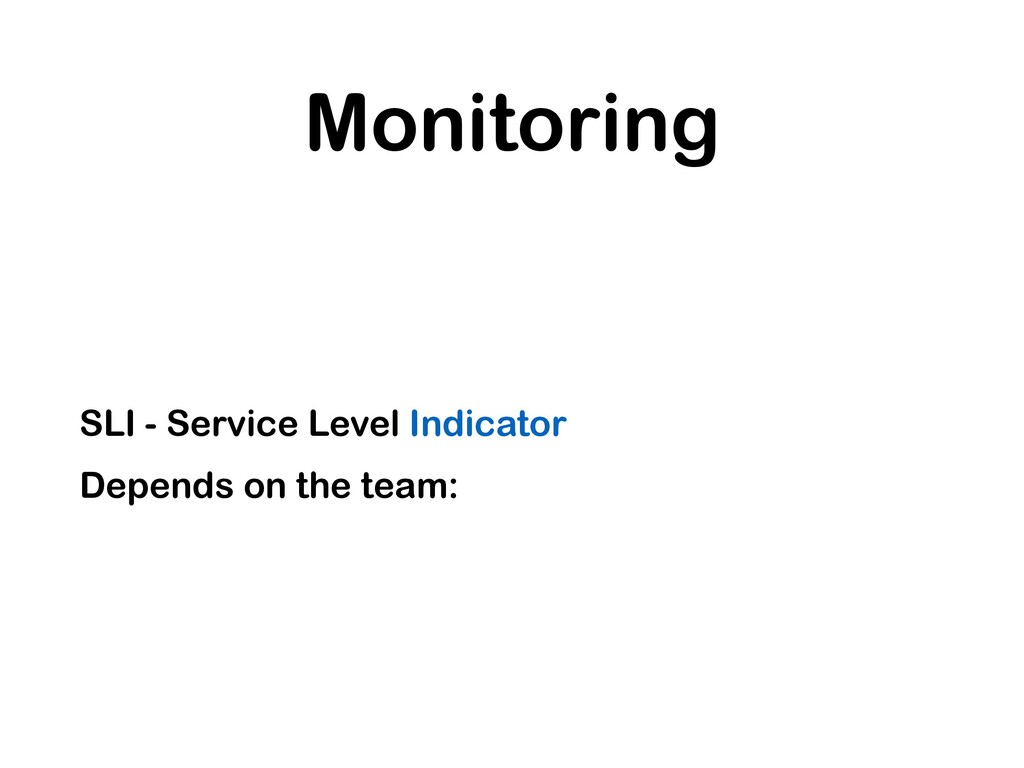
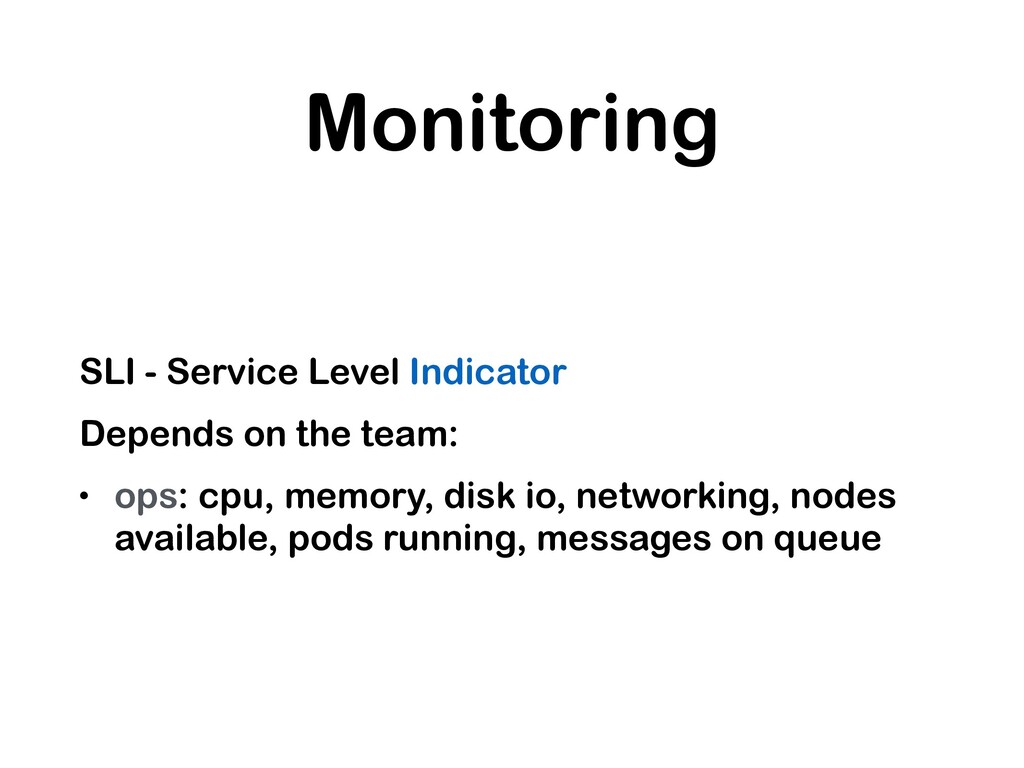
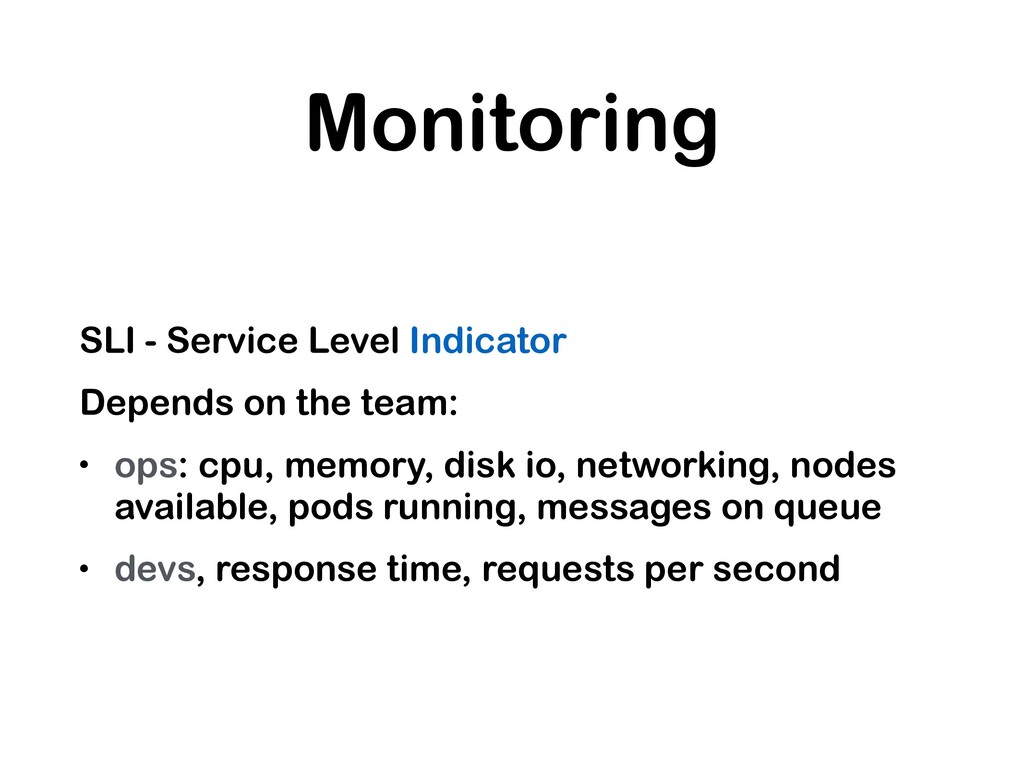
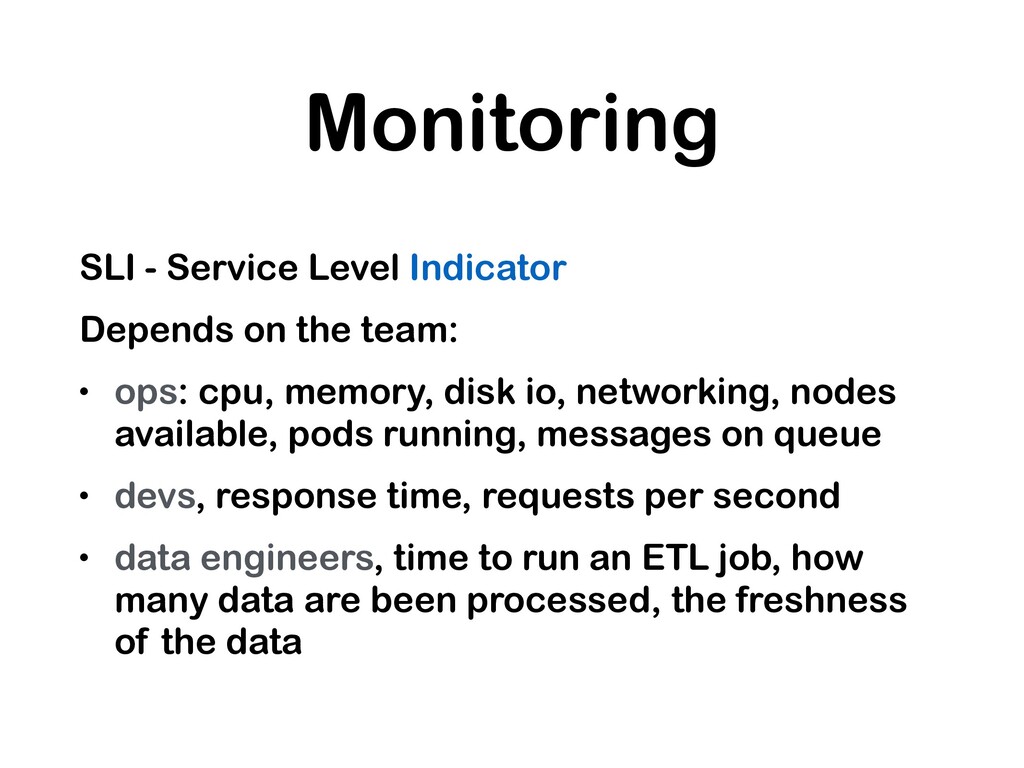
• ops: cpu, memory, disk io, networking, nodes available, pods running, messages on queue • devs, response time, requests per second • data engineers, time to run an ETL job, how many data are been processed, the freshness of the data
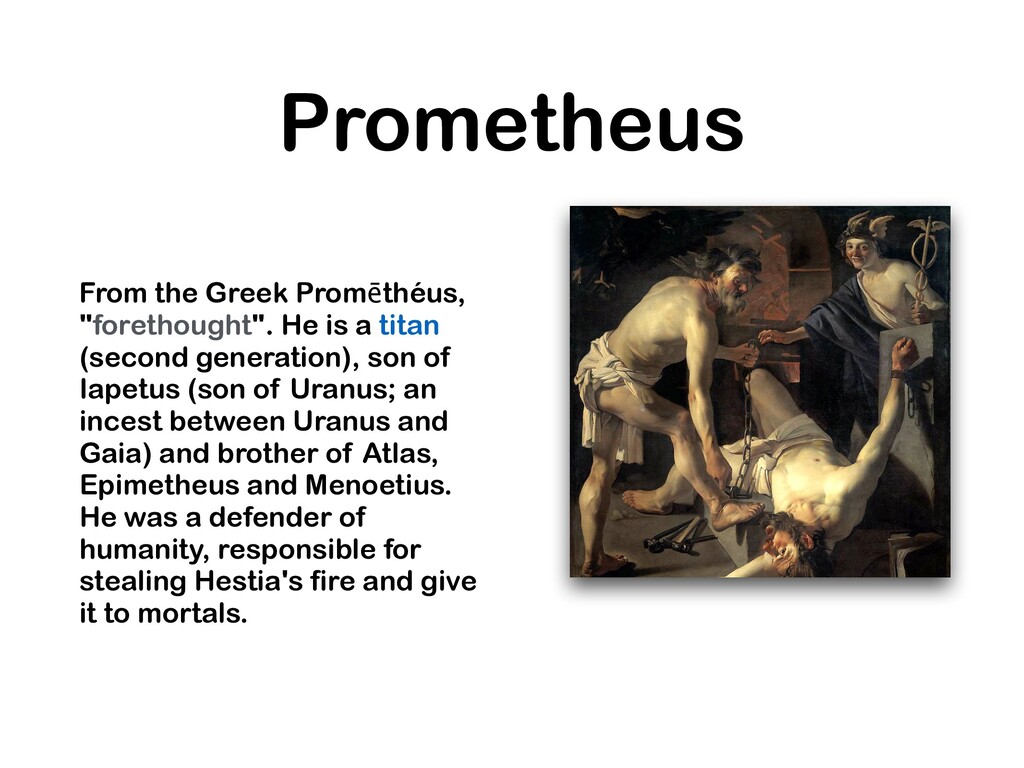
(second generation), son of Iapetus (son of Uranus; an incest between Uranus and Gaia) and brother of Atlas, Epimetheus and Menoetius. He was a defender of humanity, responsible for stealing Hestia's fire and give it to mortals.
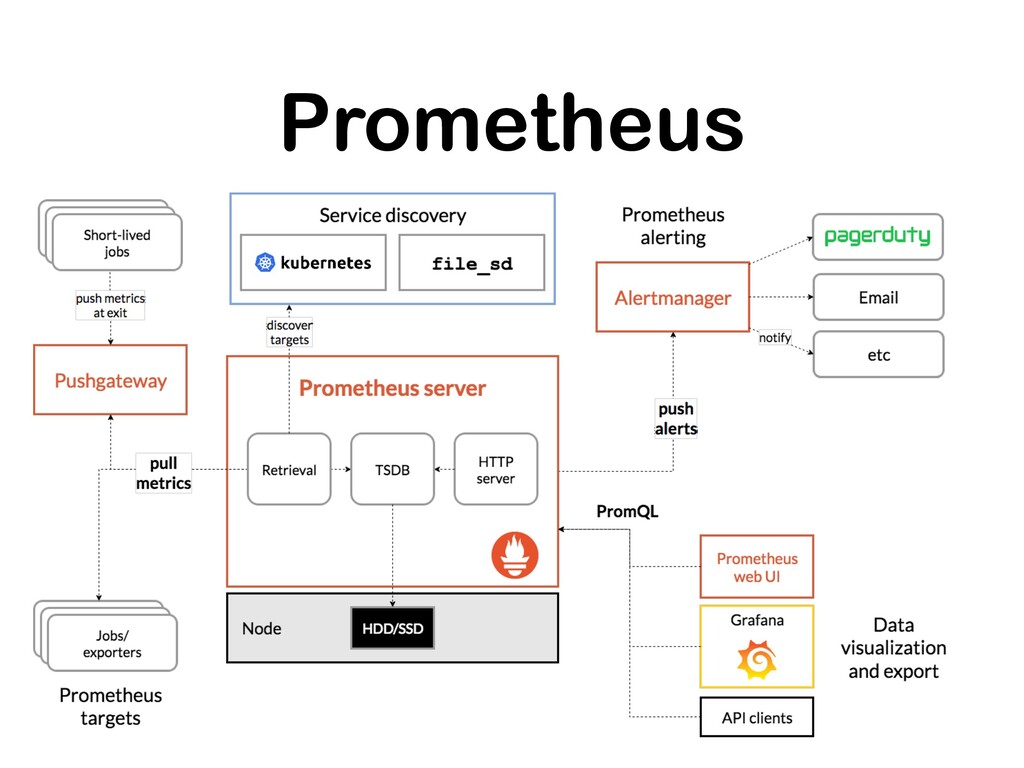
• Opensourced and published in 2015 • Second project under CNCF (Cloud Native Computing Foundation) • Can also fire and manage alerts • Stores metric in time series database (TSDB)
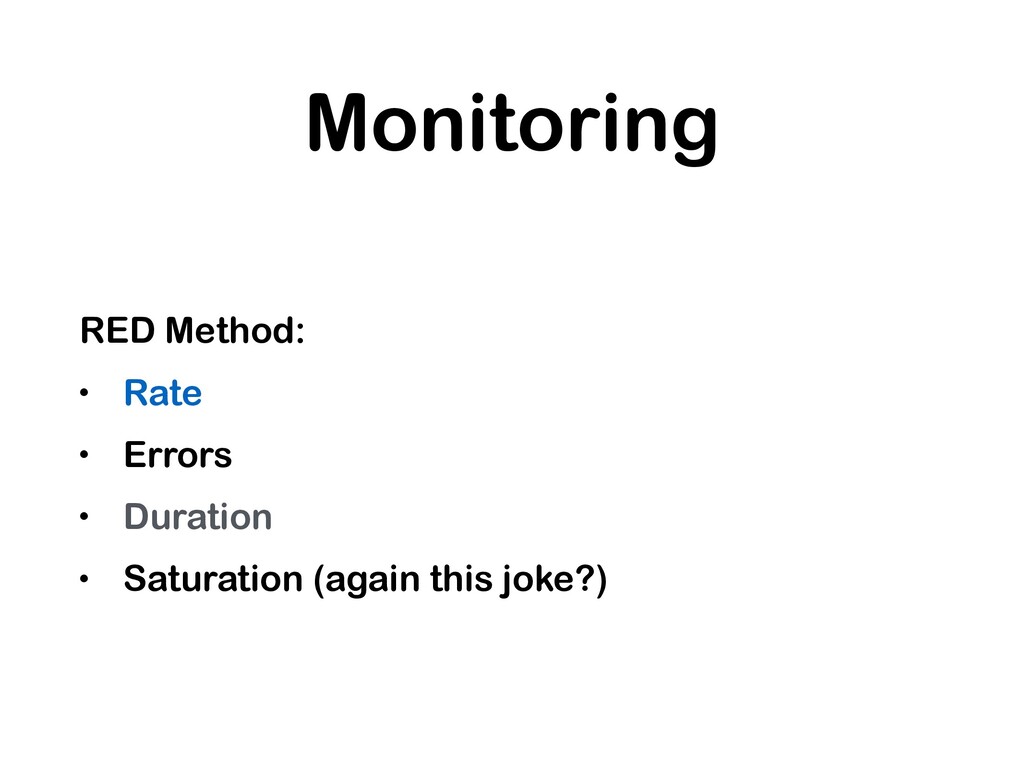
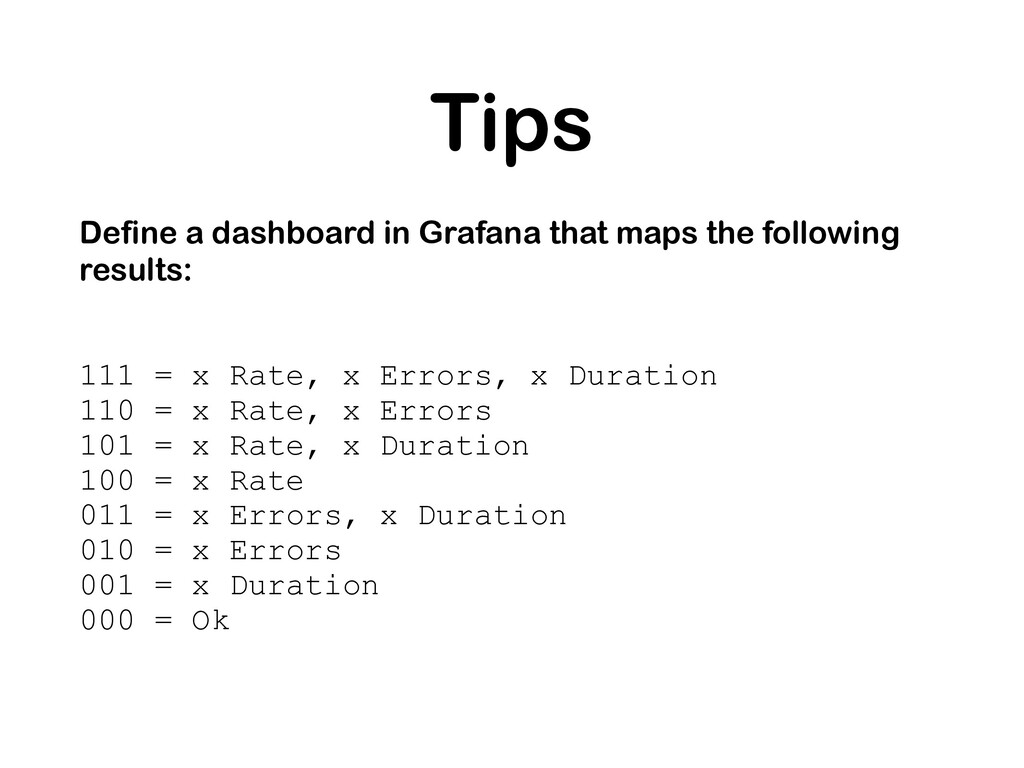
results: 111 = x Rate, x Errors, x Duration 110 = x Rate, x Errors 101 = x Rate, x Duration 100 = x Rate 011 = x Errors, x Duration 010 = x Errors 001 = x Duration 000 = Ok