Upgrade to Pro — share decks privately, control downloads, hide ads and more …

Exploring the Cloud Carbon Footprint application

Exploring the Cloud Carbon Footprint application

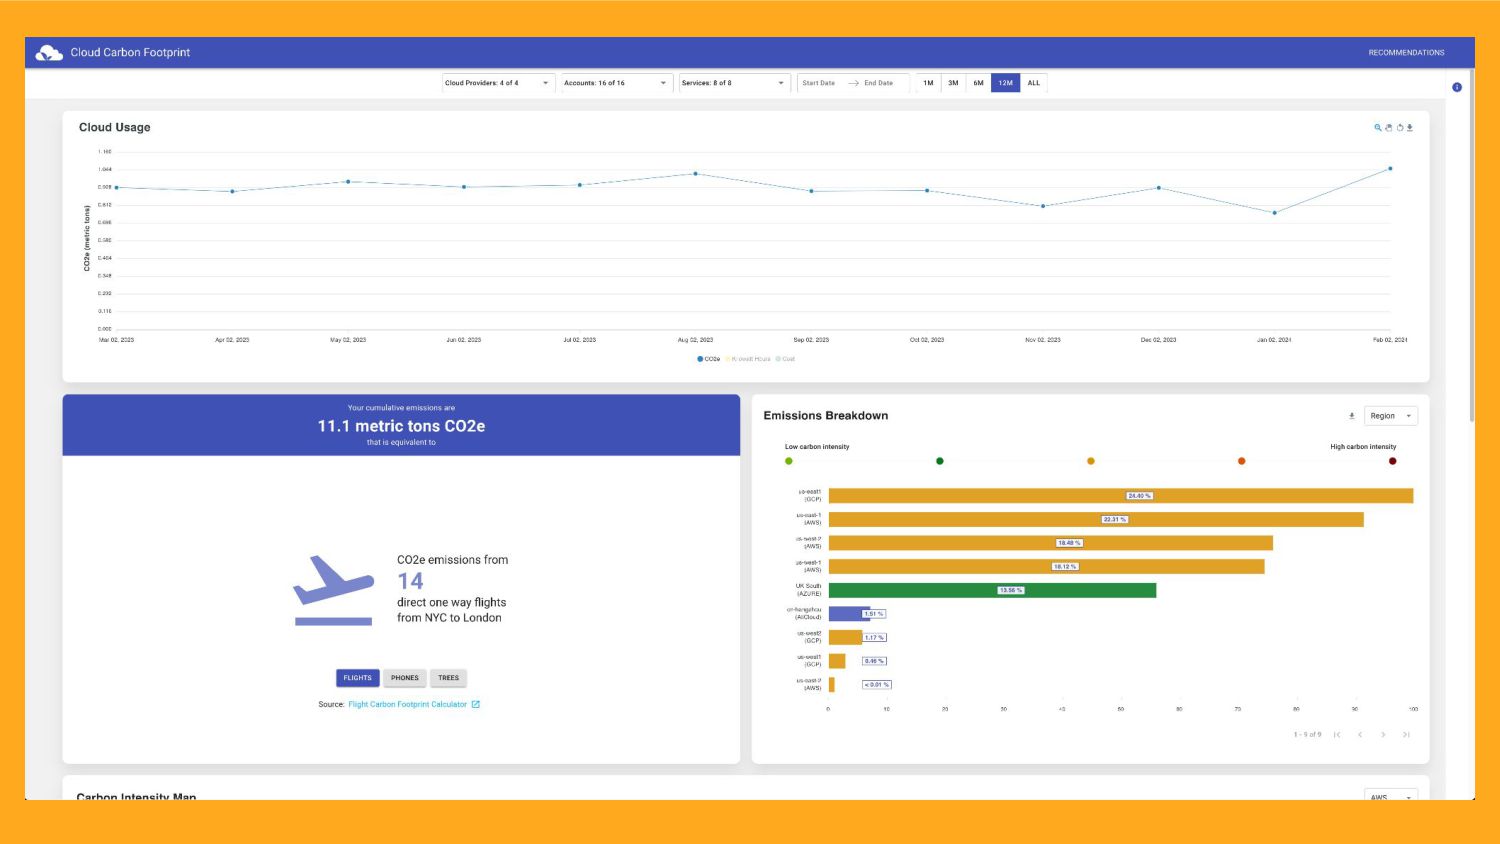
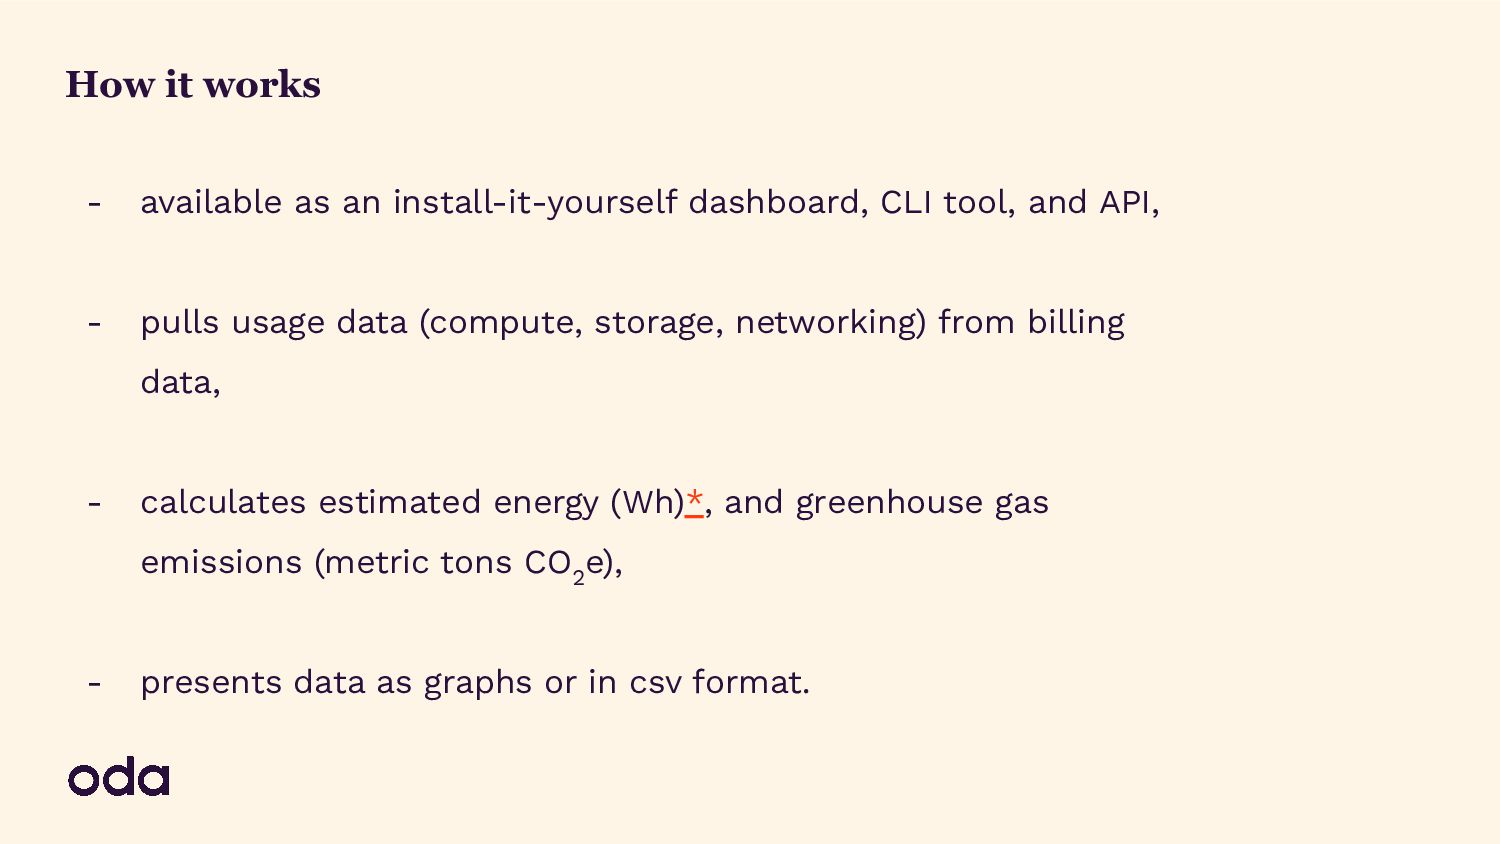
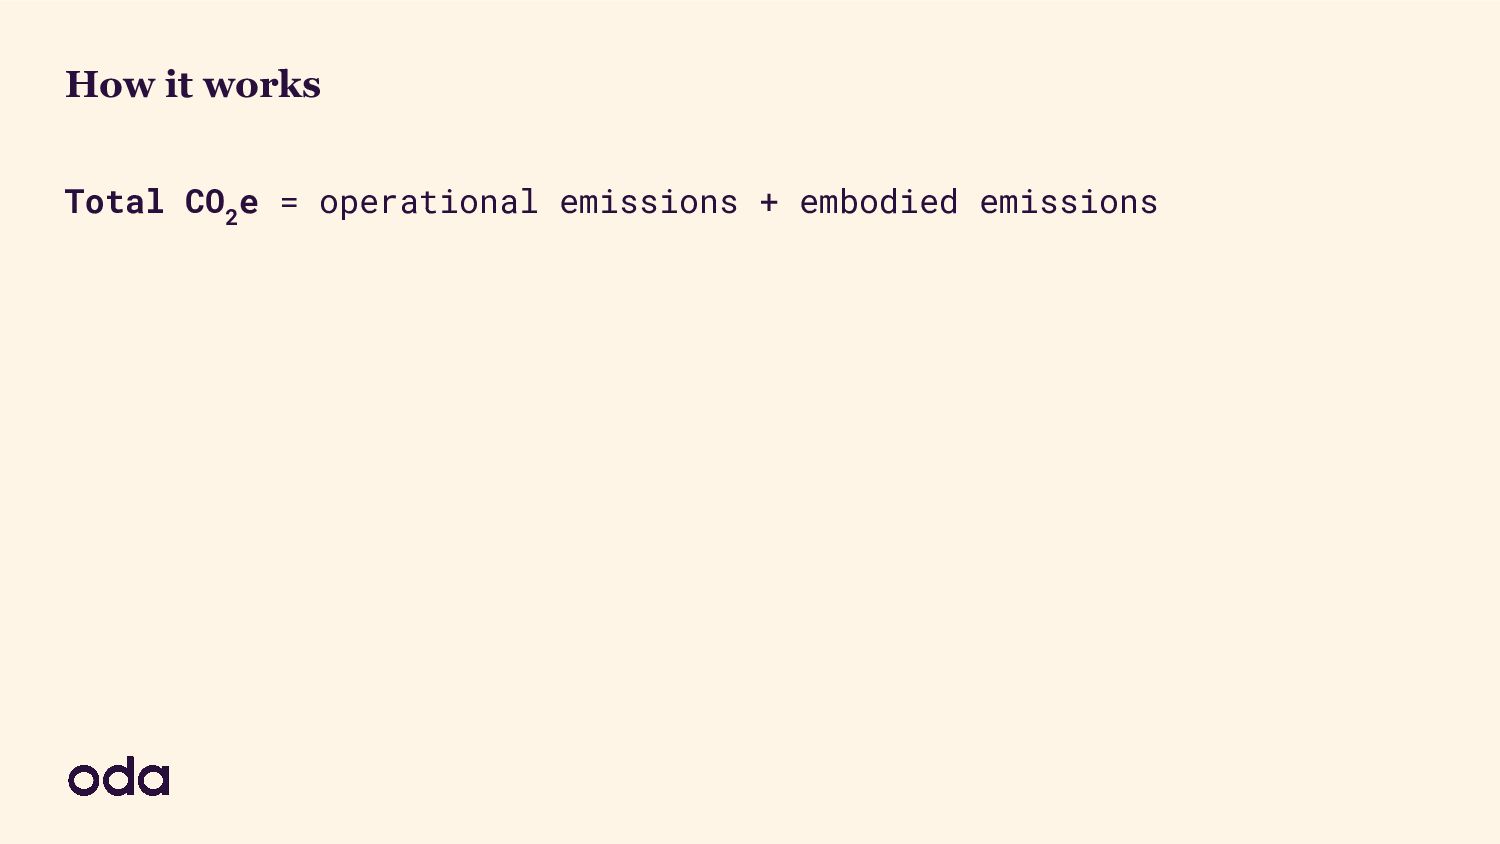
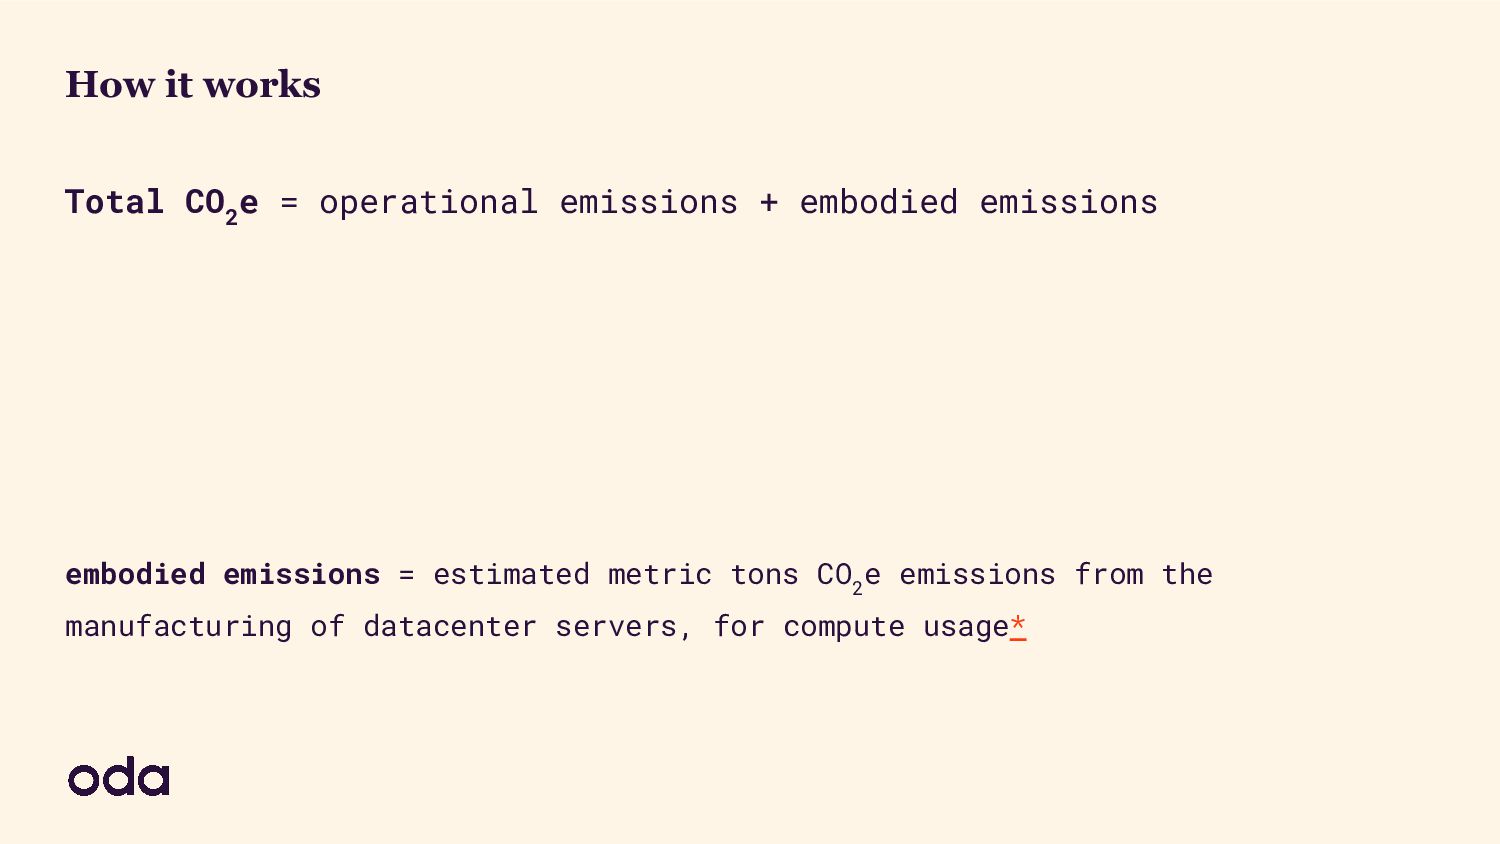
In this session Marta will provide an introduction to and a demo of Cloud Carbon Footprint, which is an open source tool that provides visibility and tooling to measure, monitor and reduce cloud carbon emissions of the applications. Marta will also share experiences of how it has been used at Oda.

Marta Paciorkowska

February 27, 2024
Tweet

More Decks by Marta Paciorkowska

Other Decks in Technology

Transcript

  1. What we’ll talk about today - The current landscape -

    What is the CCF - How we use the CCF in Oda - Applications and limitations - Further reading
  2. Global greenhouse gas emissions from the tech sector are on

    par or larger than the aviation industry, at around 3% for ICT and 2% for aviation respectively.* Photo by David Lezcano on Unsplash
  3. To align with global climate objectives, emissions from the broader

    digital sector must be slashed by nearly half by 2030.*
  4. You can’t change what you can’t measure. How can we

    lower our carbon footprint if we don’t know what our starting point is? Photo by Chris LeBoutillier on Unsplash
  5. How it works - available as an install-it-yourself dashboard, CLI

    tool, and API, - pulls usage data (compute, storage, networking) from billing data, - calculates estimated energy (Wh)*, and greenhouse gas emissions (metric tons CO 2 e), - presents data as graphs or in csv format.
  6. How it works Total CO 2 e = operational emissions

    + embodied emissions operational emissions = (Cloud provider service usage) x (Cloud energy conversion factors [kWh]) x (Cloud provider Power Usage Effectiveness (PUE)) x (grid emissions factors [metric tons CO 2 e]) embodied emissions = estimated metric tons CO 2 e emissions from the manufacturing of datacenter servers, for compute usage*
  7. How it works Total CO 2 e = operational emissions

    + embodied emissions operational emissions = (Cloud provider service usage) x (Cloud energy conversion factors [kWh]) x (Cloud provider Power Usage Effectiveness (PUE)) x (Grid emissions factors [metric tons CO 2 e]) embodied emissions = estimated metric tons CO 2 e emissions from the manufacturing of datacenter servers, for compute usage*
  8. To summarize Right now we report, but don’t act on

    the data. We can already identify areas for slashing our emissions: - Observability stack is our most carbon costly GCP project. - Compute is our most carbon costly GCP resource - is it utilized enough? - Our chosen cloud region’s carbon intensity could be lowered.
  9. Further reading Listen to this episode of Environment Variables about

    the Cloud Carbon Footprint: https://podcast.greensoftware.foundation/e/1n23mkx8-c loud-footprints-with-ccf Take the free Green Software for Practitioners course: https://training.linuxfoundation.org/training/green-softw are-for-practitioners-lfc131/ Read Etsy’s “Cloud Jewels” cloud energy usage methodology: https://www.etsy.com/codeascraft/cloud-jewels-estima ting-kwh-in-the-cloud/
  10. Estimations and averages - CCF methodology is based on estimations

    and averages. - That’s generally ok, as long as you use the same methodology every time.
  11. (William Stanley) Jevons paradox occurs when technological progress or government

    policy increases the efficiency with which a resource is used, but the falling cost of use induces increases in demand enough that resource use is increased, rather than reduced.* Photo by Christian Dubovan on Unsplash