Upgrade to Pro — share decks privately, control downloads, hide ads and more …

Demystifing Postgres - Heroku Edition

zlu
September 08, 2014

Demystifing Postgres - Heroku Edition

Presentation given to SocialChorus Engineering

zlu

September 08, 2014
Tweet

More Decks by zlu

Other Decks in Programming

Transcript

  1. Know Thy Database • Go to Heroku app facebook-envoy-production •

    Standard0 Plan: • Cache - 1GB (cache for index, table, and system) • Storage - 64 GB • Connection Limit - 120 (causes memory as well)
  2. DB Usage • Storage • pg:info - Table size: 6.5

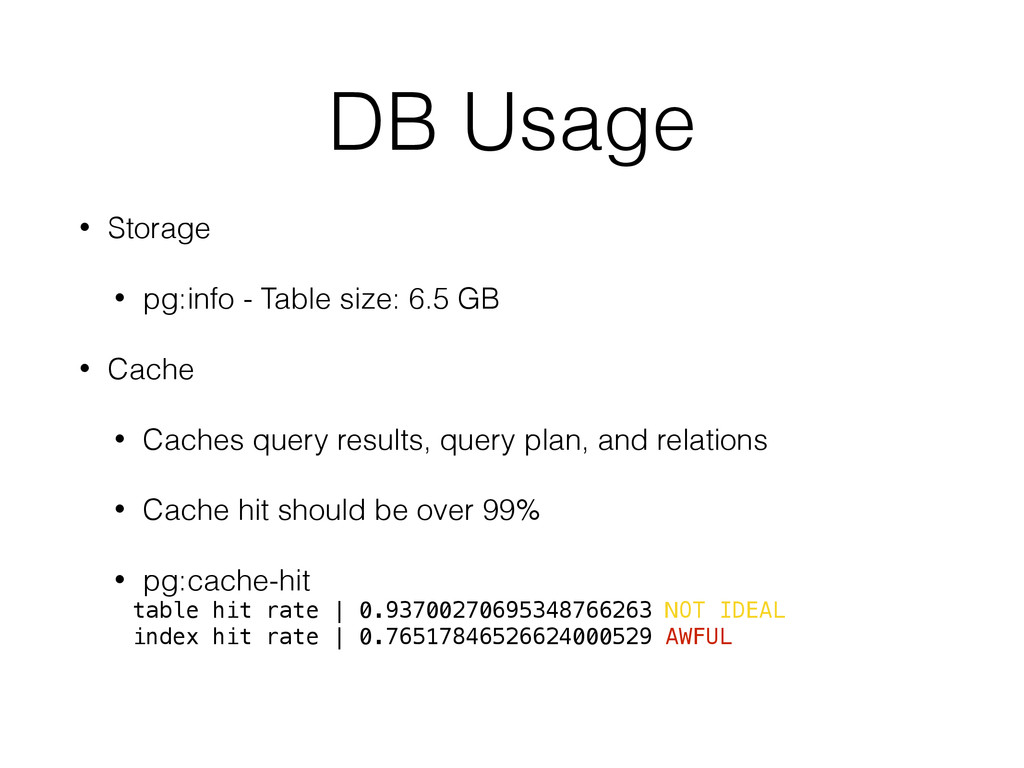
    GB • Cache • Caches query results, query plan, and relations • Cache hit should be over 99% • pg:cache-hit table hit rate | 0.93700270695348766263 NOT IDEAL index hit rate | 0.76517846526624000529 AWFUL
  3. Fixing Cache • Potential Cause • Too much data (table

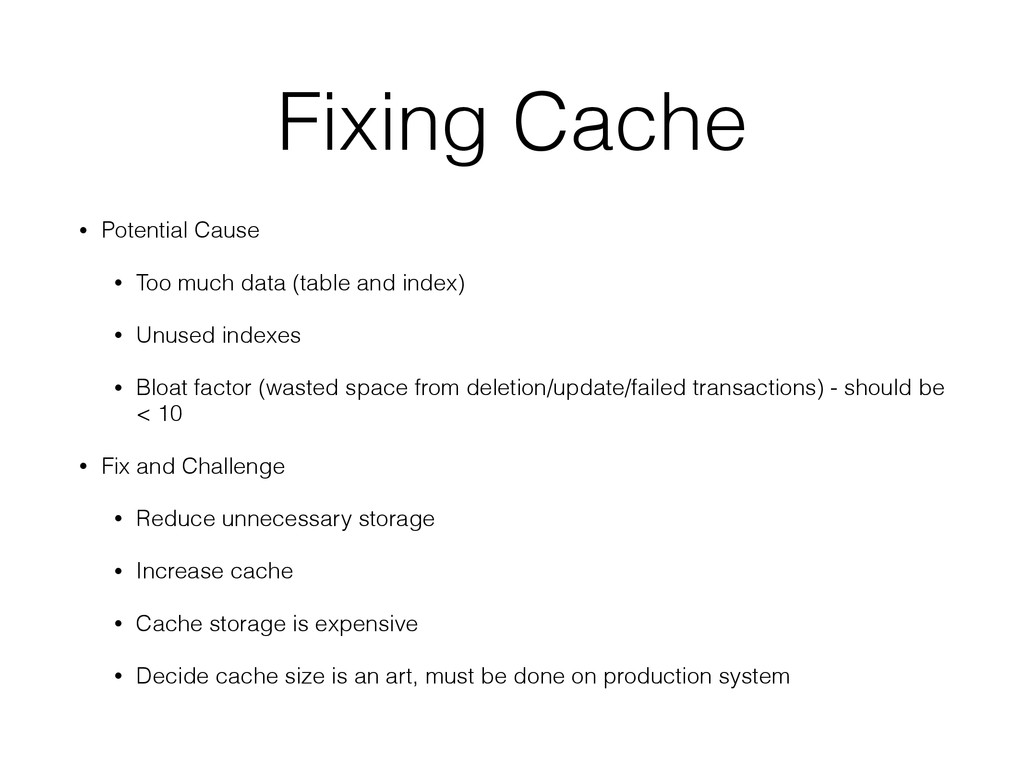
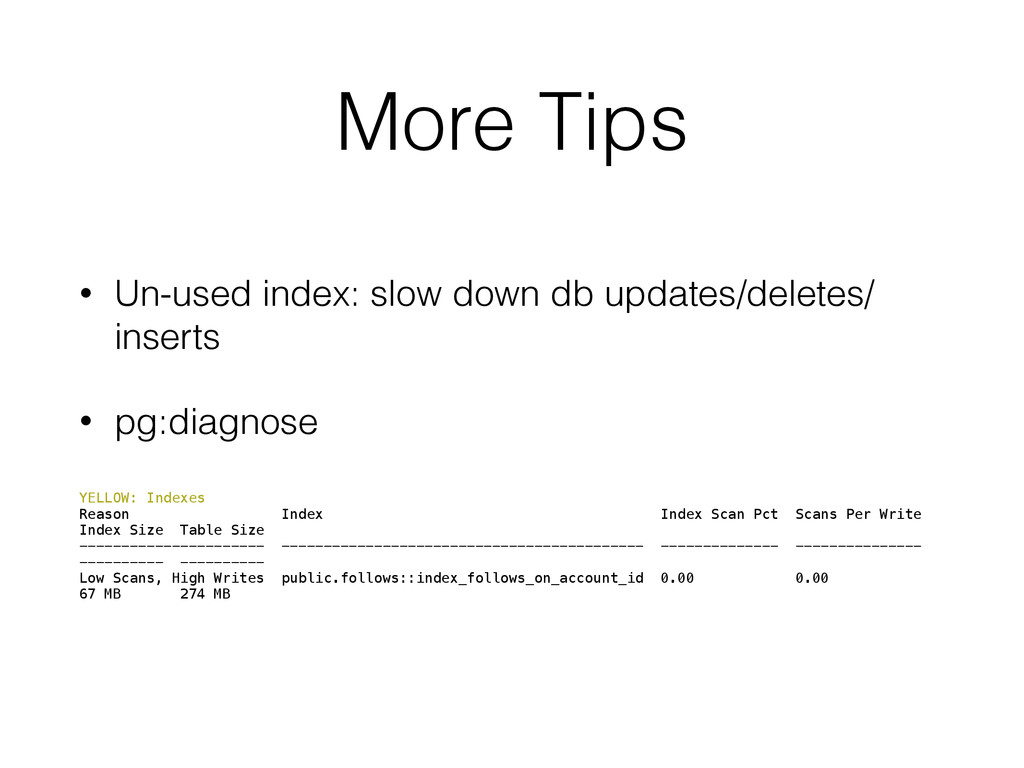
    and index) • Unused indexes • Bloat factor (wasted space from deletion/update/failed transactions) - should be < 10 • Fix and Challenge • Reduce unnecessary storage • Increase cache • Cache storage is expensive • Decide cache size is an art, must be done on production system
  4. Fix Storage • Identify unless data to delete (migration/code) •

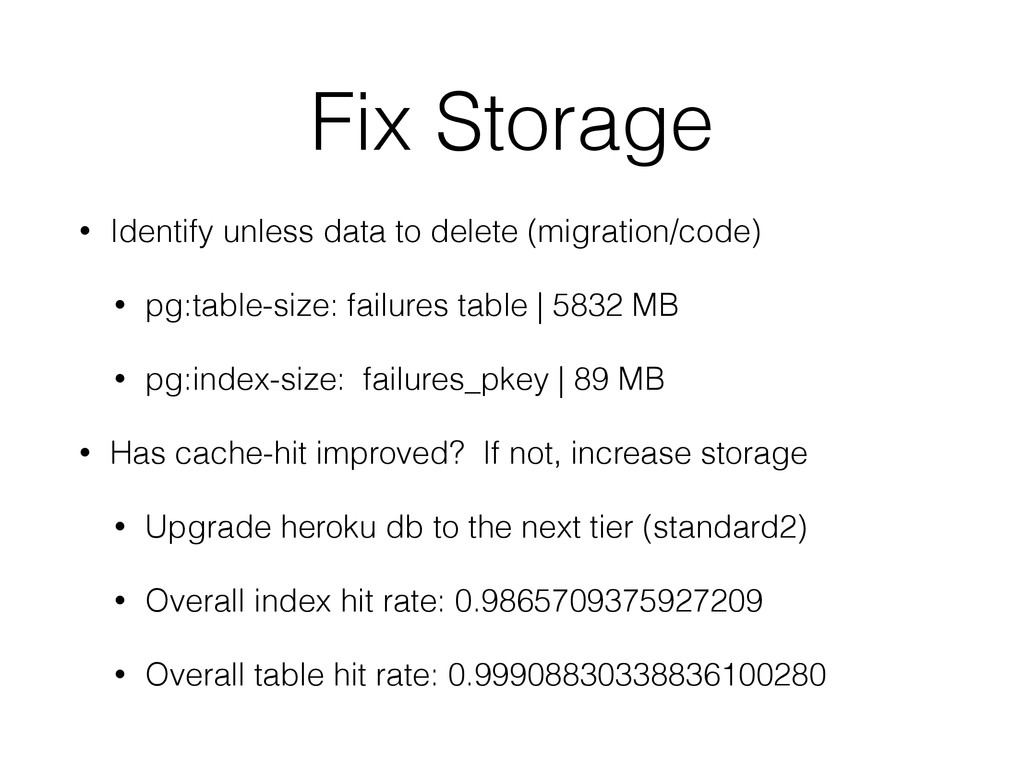
    pg:table-size: failures table | 5832 MB • pg:index-size: failures_pkey | 89 MB • Has cache-hit improved? If not, increase storage • Upgrade heroku db to the next tier (standard2) • Overall index hit rate: 0.9865709375927209 • Overall table hit rate: 0.99908830338836100280
  5. Indexing and Scanning • Index scan v.s. sequential scan •

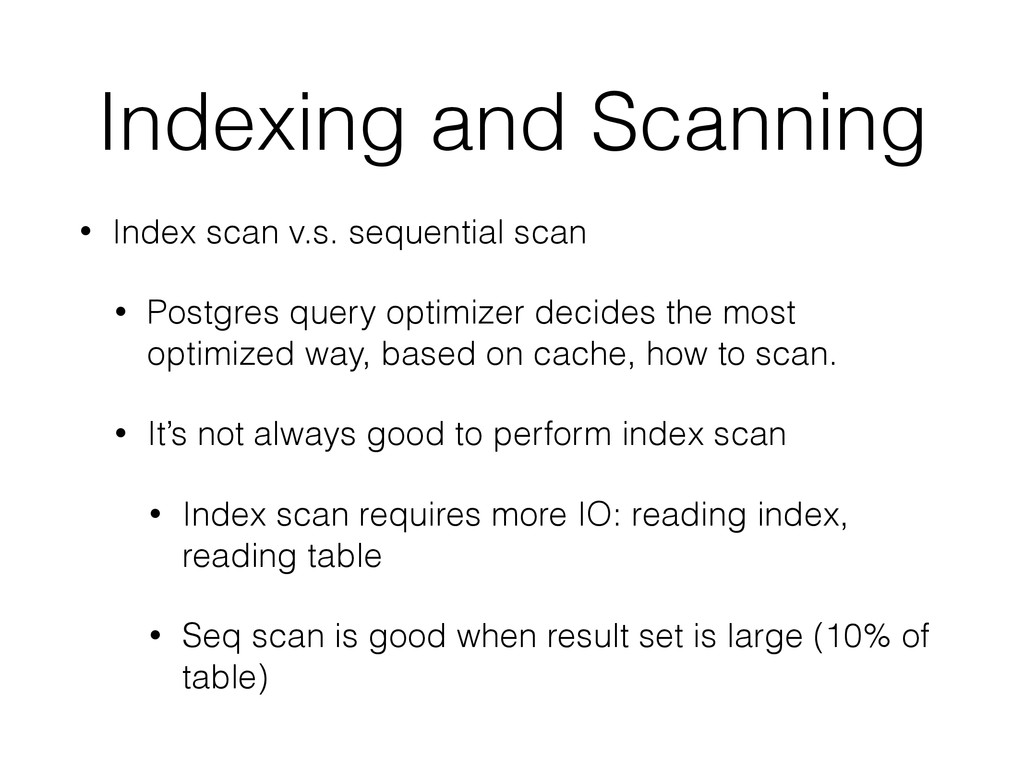
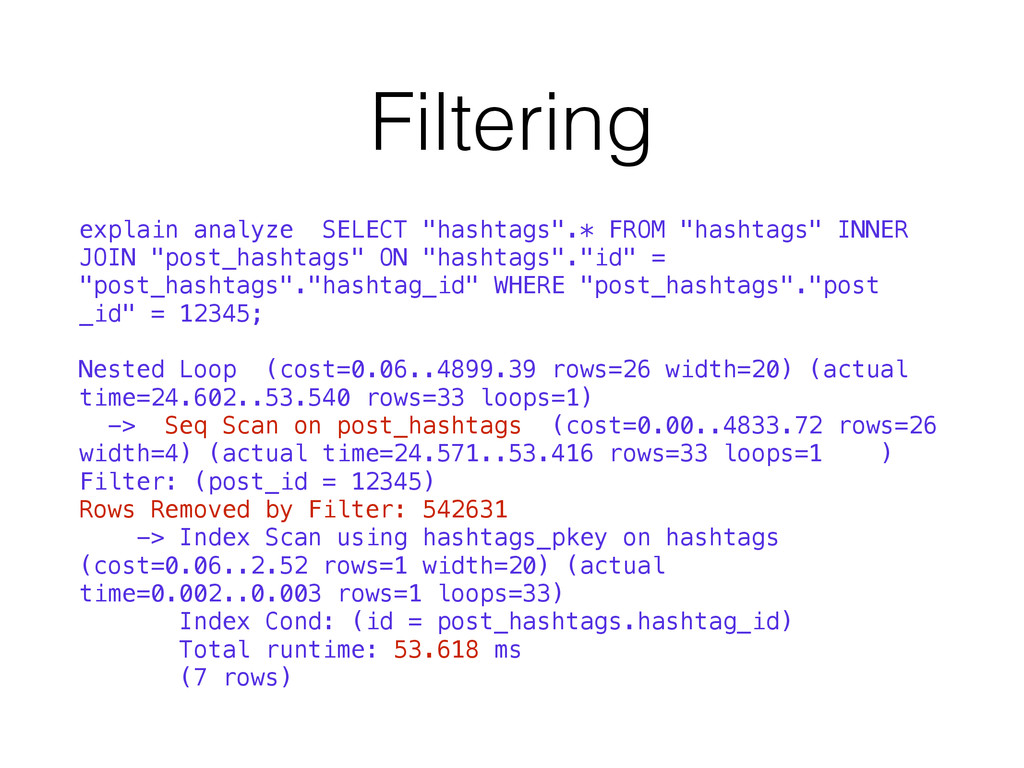
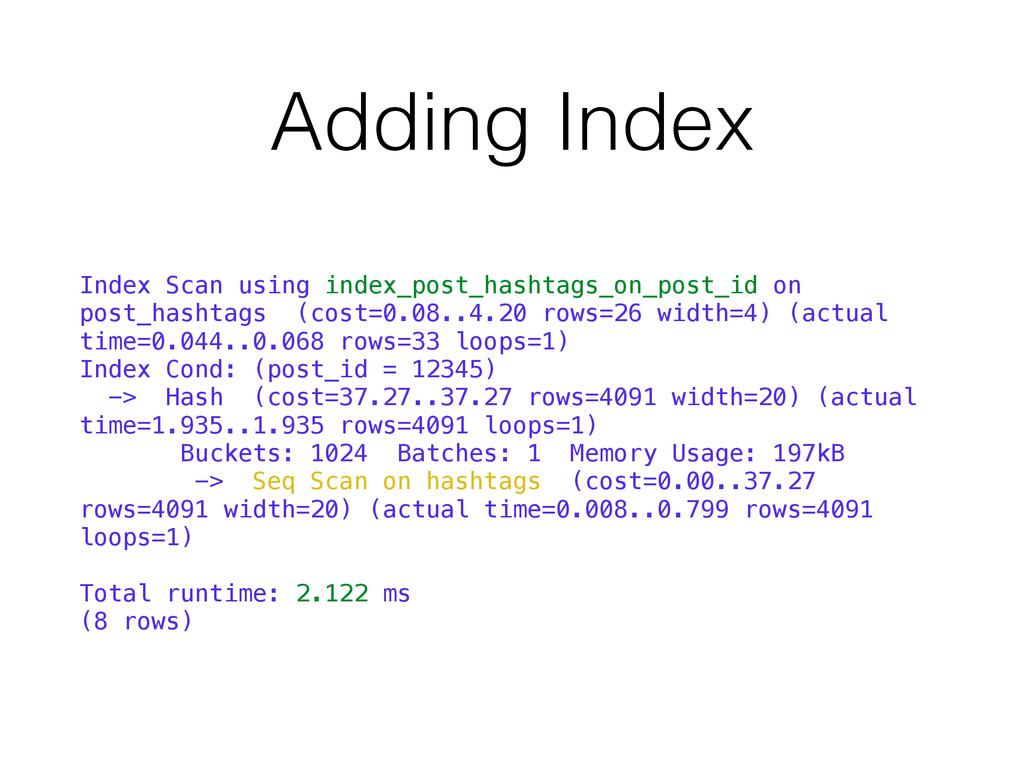
    Postgres query optimizer decides the most optimized way, based on cache, how to scan. • It’s not always good to perform index scan • Index scan requires more IO: reading index, reading table • Seq scan is good when result set is large (10% of table)
  6. Index Types • Balance-Tree (BTree) • Default for pg •

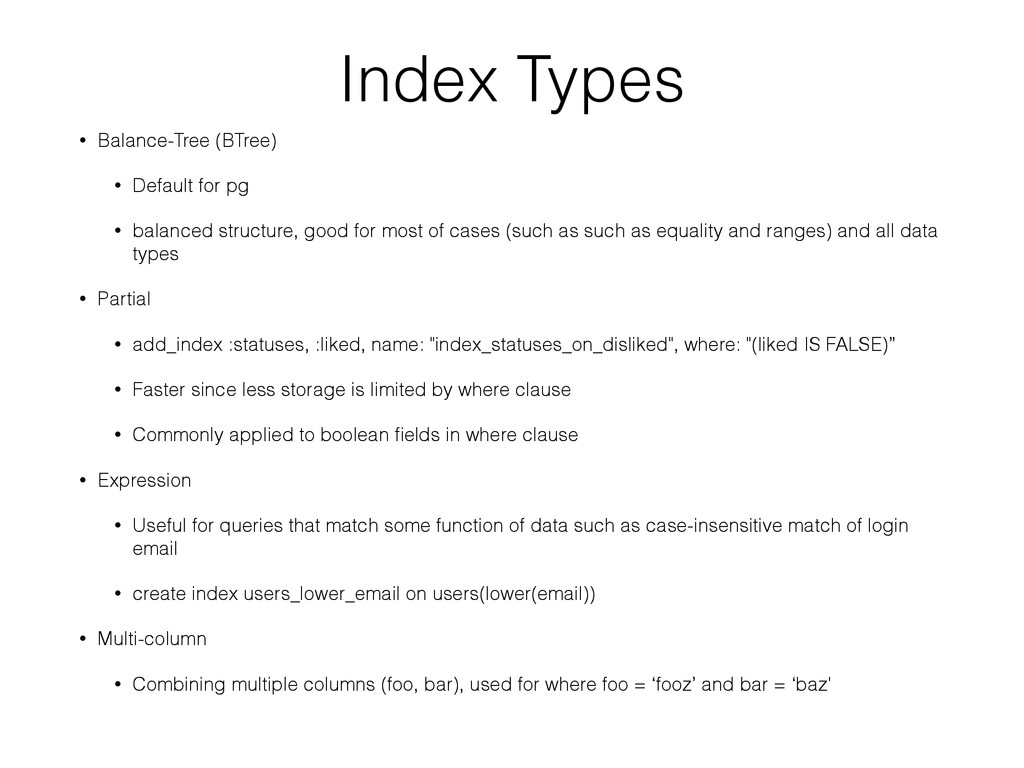
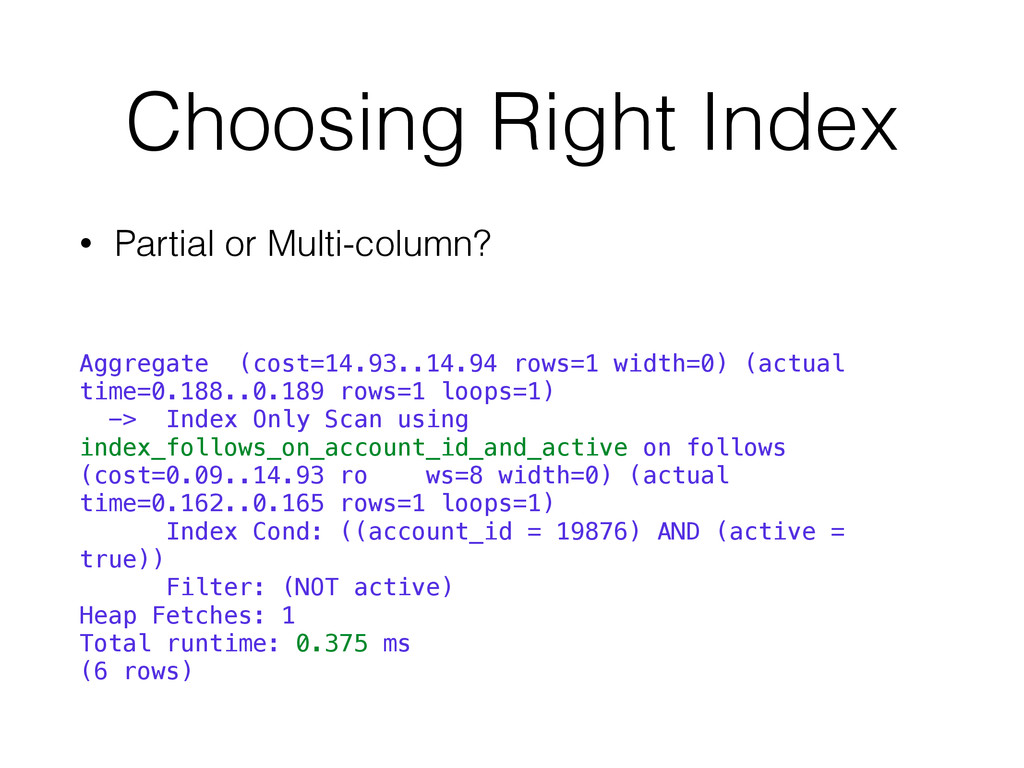
    balanced structure, good for most of cases (such as such as equality and ranges) and all data types • Partial • add_index :statuses, :liked, name: "index_statuses_on_disliked", where: "(liked IS FALSE)” • Faster since less storage is limited by where clause • Commonly applied to boolean fields in where clause • Expression • Useful for queries that match some function of data such as case-insensitive match of login email • create index users_lower_email on users(lower(email)) • Multi-column • Combining multiple columns (foo, bar), used for where foo = ‘fooz’ and bar = ‘baz'
  7. Identify Slow Query • pg:outliers or look at heroku database

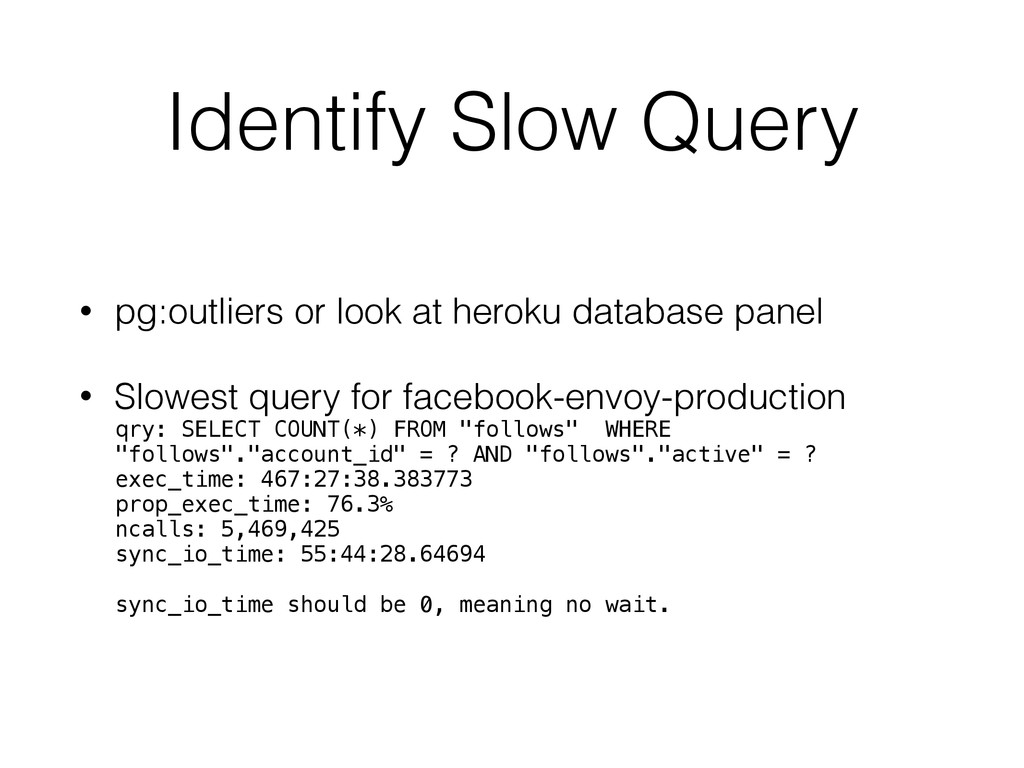
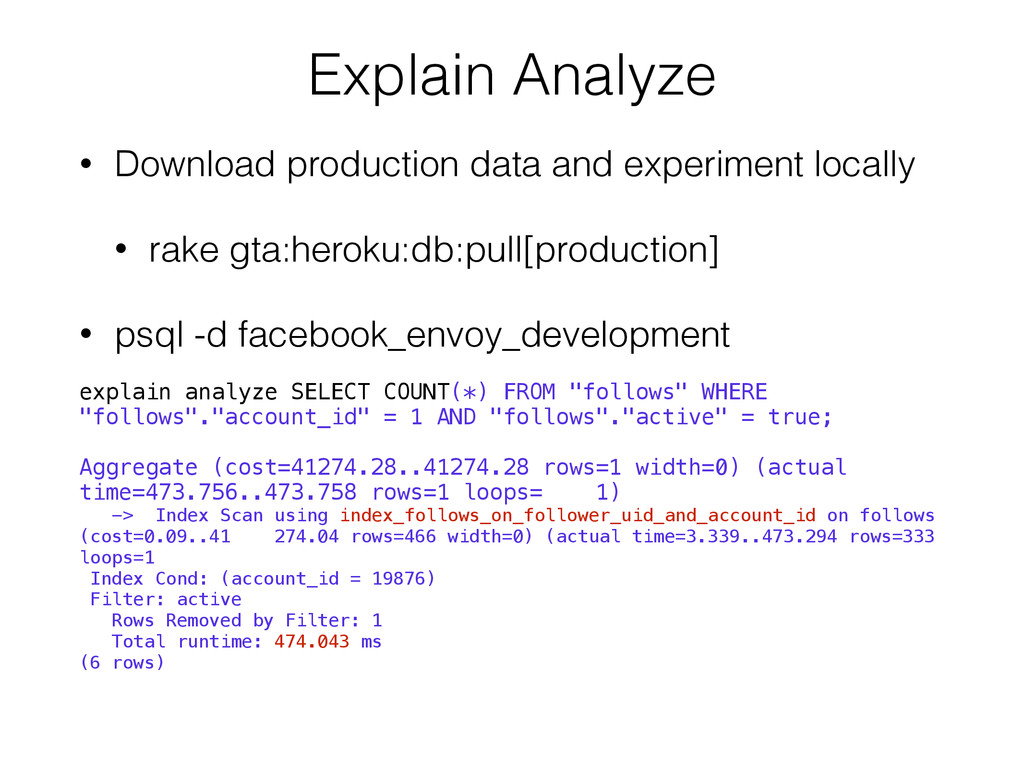
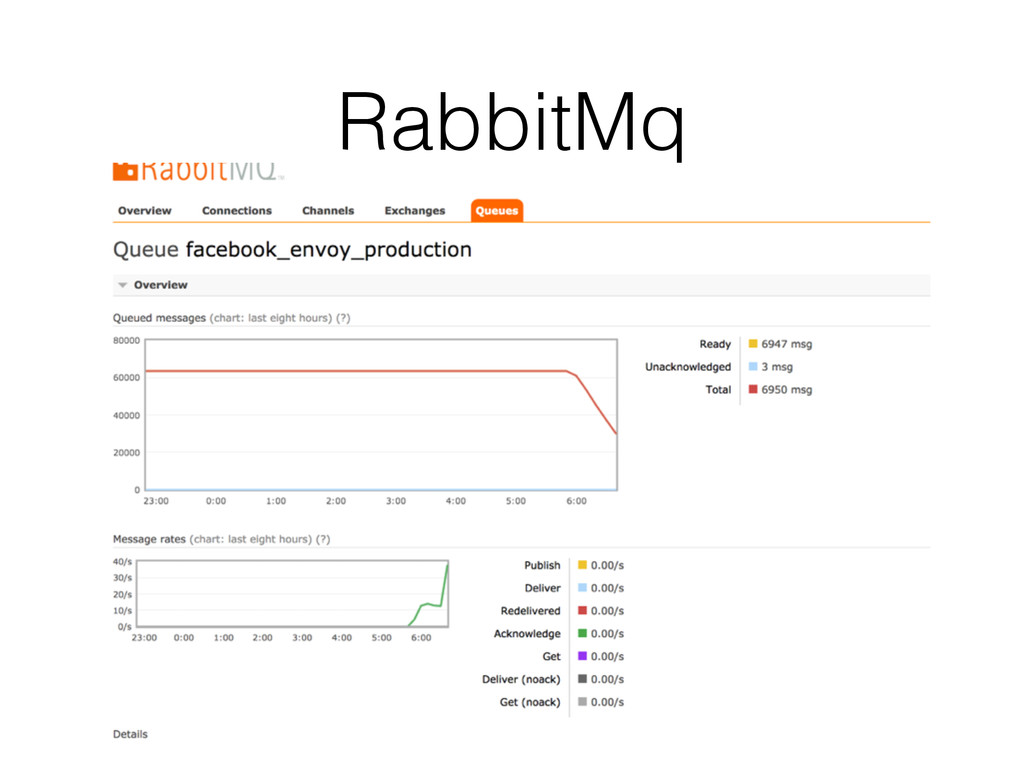
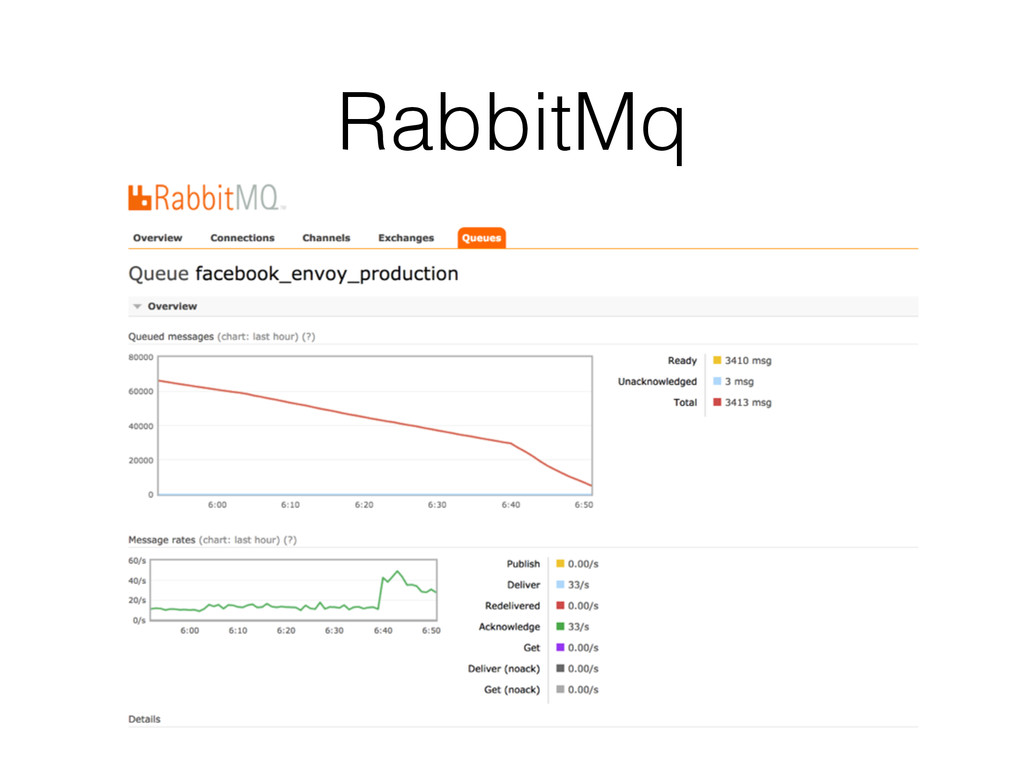
    panel • Slowest query for facebook-envoy-production qry: SELECT COUNT(*) FROM "follows" WHERE "follows"."account_id" = ? AND "follows"."active" = ? exec_time: 467:27:38.383773 prop_exec_time: 76.3% ncalls: 5,469,425 sync_io_time: 55:44:28.64694 ! sync_io_time should be 0, meaning no wait.
  8. Explain Analyze • Download production data and experiment locally •

    rake gta:heroku:db:pull[production] • psql -d facebook_envoy_development ! explain analyze SELECT COUNT(*) FROM "follows" WHERE "follows"."account_id" = 1 AND "follows"."active" = true; Aggregate (cost=41274.28..41274.28 rows=1 width=0) (actual time=473.756..473.758 rows=1 loops= 1) -> Index Scan using index_follows_on_follower_uid_and_account_id on follows (cost=0.09..41 274.04 rows=466 width=0) (actual time=3.339..473.294 rows=333 loops=1 Index Cond: (account_id = 19876) Filter: active Rows Removed by Filter: 1 Total runtime: 474.043 ms (6 rows)
  9. Choosing Right Index • Partial or Multi-column? ! Aggregate (cost=14.93..14.94

    rows=1 width=0) (actual time=0.188..0.189 rows=1 loops=1) -> Index Only Scan using index_follows_on_account_id_and_active on follows (cost=0.09..14.93 ro ws=8 width=0) (actual time=0.162..0.165 rows=1 loops=1) Index Cond: ((account_id = 19876) AND (active = true)) Filter: (NOT active) Heap Fetches: 1 Total runtime: 0.375 ms (6 rows)
  10. Filtering explain analyze SELECT "hashtags".* FROM "hashtags" INNER JOIN "post_hashtags"

    ON "hashtags"."id" = "post_hashtags"."hashtag_id" WHERE "post_hashtags"."post _id" = 12345; ! Nested Loop (cost=0.06..4899.39 rows=26 width=20) (actual time=24.602..53.540 rows=33 loops=1) -> Seq Scan on post_hashtags (cost=0.00..4833.72 rows=26 width=4) (actual time=24.571..53.416 rows=33 loops=1 ) Filter: (post_id = 12345) Rows Removed by Filter: 542631 -> Index Scan using hashtags_pkey on hashtags (cost=0.06..2.52 rows=1 width=20) (actual time=0.002..0.003 rows=1 loops=33) Index Cond: (id = post_hashtags.hashtag_id) Total runtime: 53.618 ms (7 rows)
  11. Large Filter • Large number of rows being filtered is

    bad, it means many rows have been read into memory then abandoned by the filter. • Replace seq scan with index scan
  12. Adding Index Index Scan using index_post_hashtags_on_post_id on post_hashtags (cost=0.08..4.20 rows=26

    width=4) (actual time=0.044..0.068 rows=33 loops=1) Index Cond: (post_id = 12345) -> Hash (cost=37.27..37.27 rows=4091 width=20) (actual time=1.935..1.935 rows=4091 loops=1) Buckets: 1024 Batches: 1 Memory Usage: 197kB -> Seq Scan on hashtags (cost=0.00..37.27 rows=4091 width=20) (actual time=0.008..0.799 rows=4091 loops=1) ! Total runtime: 2.122 ms (8 rows)
  13. More Optimization • Or when do you stop optimization? •

    Building and rebuilding index has a time cost (sync_io_time) and space cost • If the query is performed < 2ms, it’s reasonable and we can stop optimizing it. • N + 1 queries - reducing throughput
  14. Review • Cache-hit (>99%) • Query plan (<2ms) • Choosing

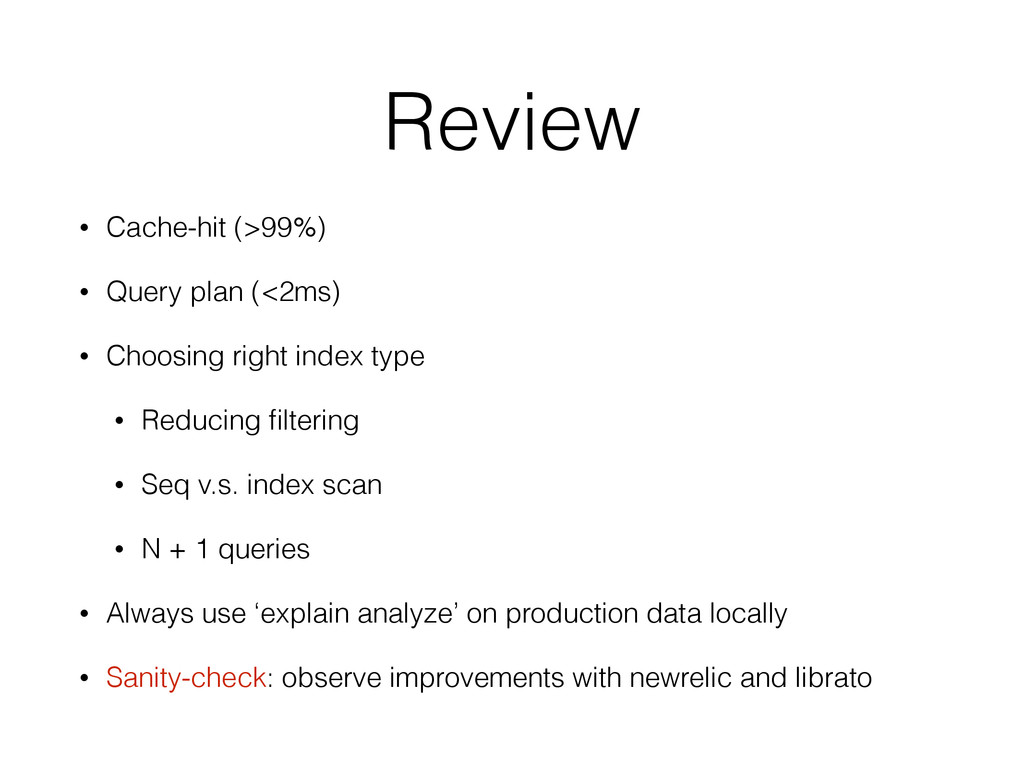
    right index type • Reducing filtering • Seq v.s. index scan • N + 1 queries • Always use ‘explain analyze’ on production data locally • Sanity-check: observe improvements with newrelic and librato
  15. More Tips • Un-used index: slow down db updates/deletes/ inserts

    • pg:diagnose ! ! ! YELLOW: Indexes Reason Index Index Scan Pct Scans Per Write Index Size Table Size ---------------------- ------------------------------------------- -------------- --------------- ---------- ---------- Low Scans, High Writes public.follows::index_follows_on_account_id 0.00 0.00 67 MB 274 MB !
  16. Bloat and Vacuum • Bloated table • Auto/Manual vacuum •

    Setting proper threshold for auto-vacuuming
  17. DB Connections • Database has limited connections. • Standard0 has

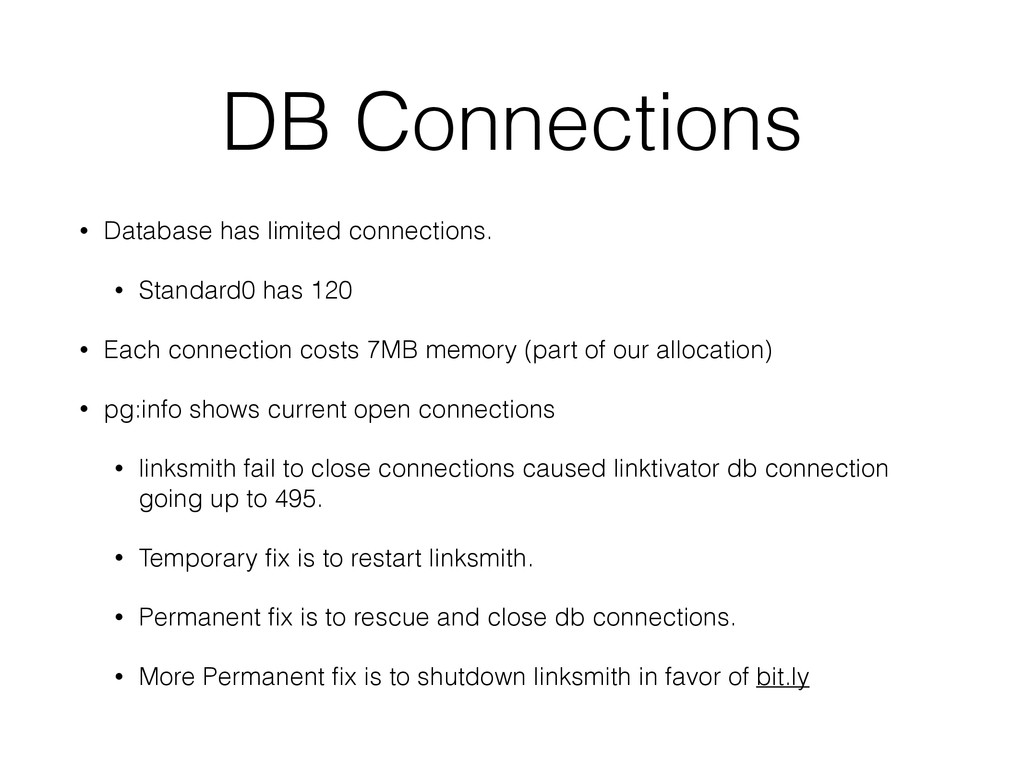
    120 • Each connection costs 7MB memory (part of our allocation) • pg:info shows current open connections • linksmith fail to close connections caused linktivator db connection going up to 495. • Temporary fix is to restart linksmith. • Permanent fix is to rescue and close db connections. • More Permanent fix is to shutdown linksmith in favor of bit.ly
  18. Reminders • Pick at least standard0 ($50) for production database

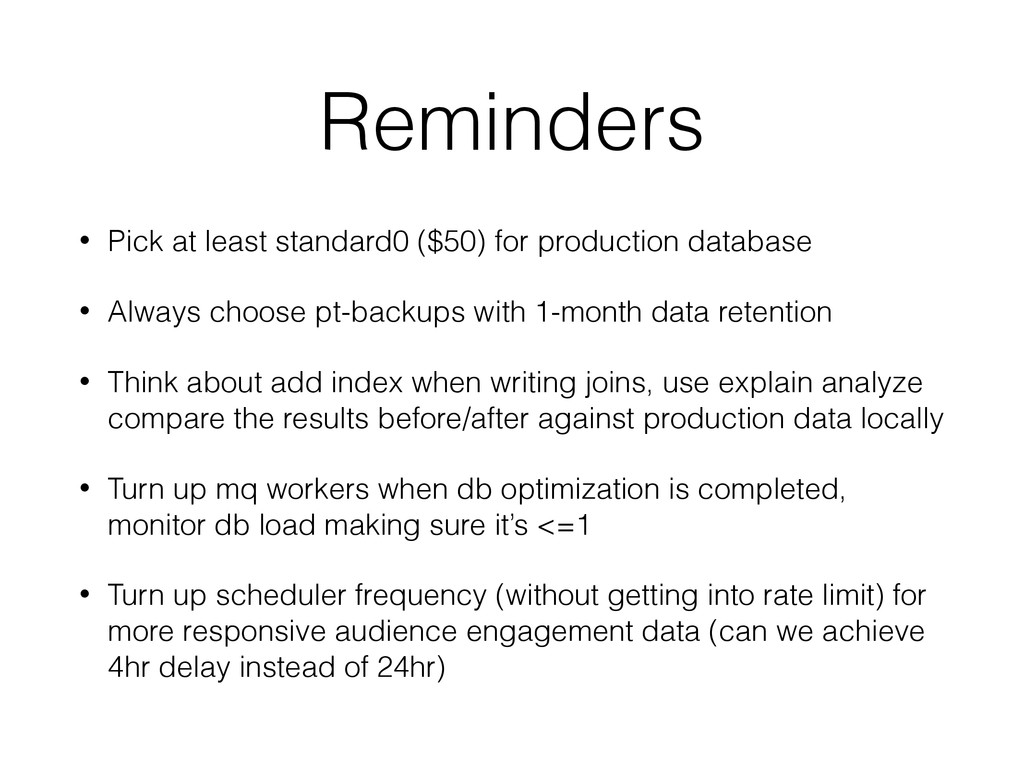
    • Always choose pt-backups with 1-month data retention • Think about add index when writing joins, use explain analyze compare the results before/after against production data locally • Turn up mq workers when db optimization is completed, monitor db load making sure it’s <=1 • Turn up scheduler frequency (without getting into rate limit) for more responsive audience engagement data (can we achieve 4hr delay instead of 24hr)