Upgrade to Pro — share decks privately, control downloads, hide ads and more …

Ops for Developers – Monitoring with Prometheus

Ops for Developers – Monitoring with Prometheus

With DevOps developing an application is no longer enough. Developers need to take responsibility for their applications in production. Monitoring is the key to find out how your application performs in production.
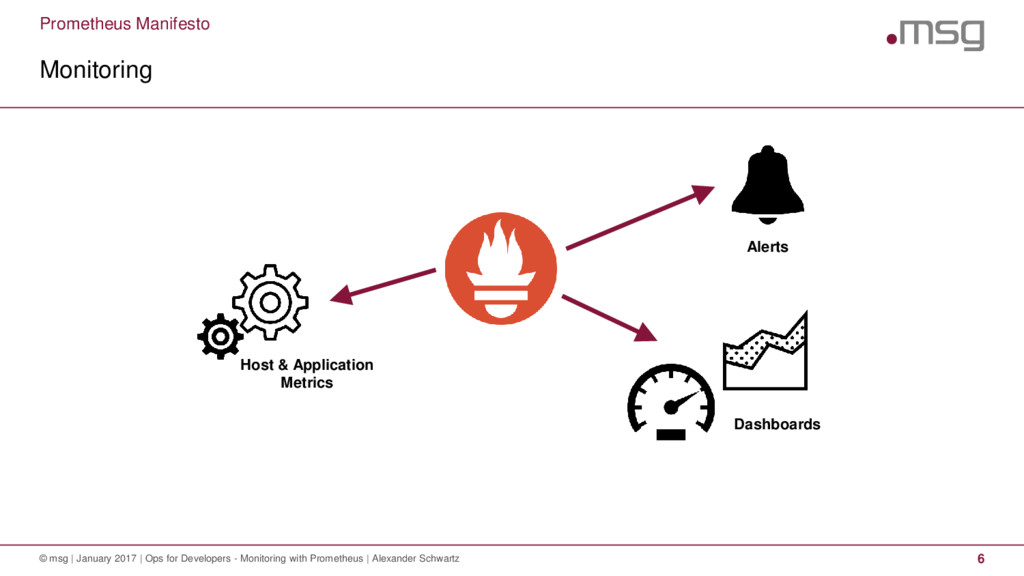
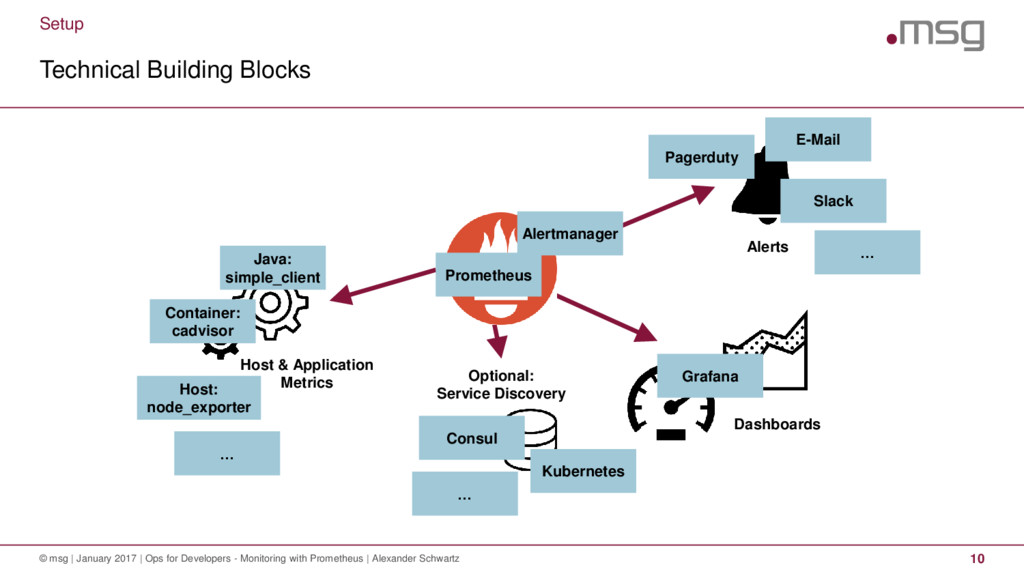
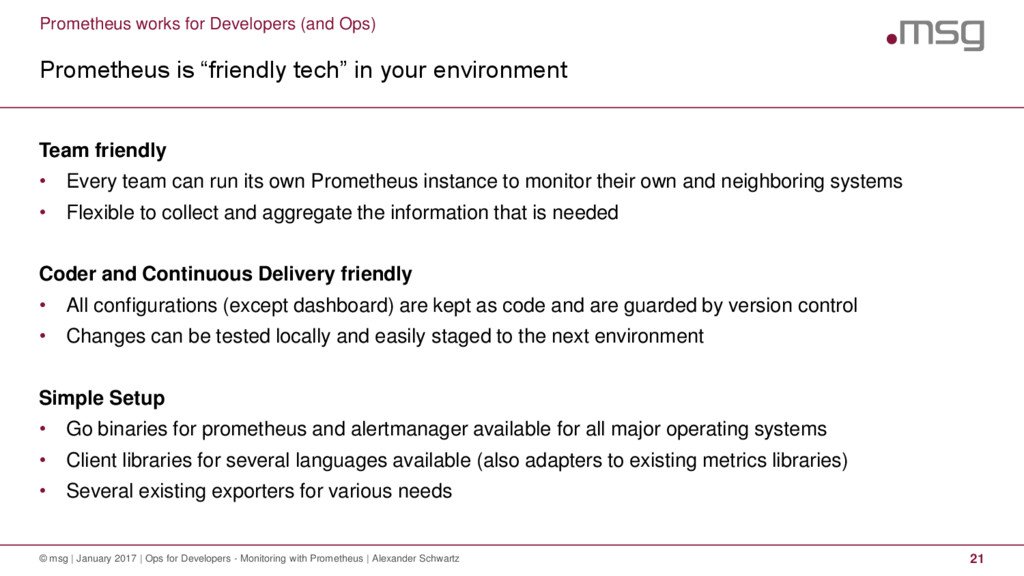
Prometheus provides developers with tools to get started in this domain easily: Expose your application's metrics in a URL, and then pull the data to fill dashboards and trigger alerts. This monitoring doesn't interfere with existing monitoring, and different teams are able to use separate monitoring instances to process the information they need. All configurations live in checked-in YAML files so they can be easily tested locally on a developer’s machine and published to staging environments.
This talk shows you to get started by exposing metrics of your infrastructure and applications and monitoring them in Prometheus for alerts and graph them using Grafana.

Alexander Schwartz

January 23, 2017
Tweet

More Decks by Alexander Schwartz

Other Decks in Technology

Transcript

  1. .consulting .solutions .partnership Ops for Developers – Monitoring with Prometheus

    Alexander Schwartz, Principal IT Consultant DevOps Meetup Mannheim 23.01.2017
  2. Ops for Developers – Monitoring with Prometheus 2 © msg

    | January 2017 | Ops for Developers – Monitoring with Prometheus | Alexander Schwartz Prometheus Manifesto 1 Setup 2 How to... 3 Prometheus works for Developers (and Ops) 4
  3. Sponsor and Employer – msg systems ag © msg |

    January 2017 | Ops for Developers - Monitoring with Prometheus | Alexander Schwartz 3 Founded 1980 More than 6.000 Employees 727 Millionen € Turnover 2015 25 Countries 18 offices in Germany
  4. About me – Principal IT Consultant @ msg Travel &

    Logistics © msg | January 2017 | Ops for Developers - Monitoring with Prometheus | Alexander Schwartz 4 14 year Java 7 years PL/SQL 7 years consumer finance 3,5 years online banking 1 wife 2 kids 501 Geocaches @ahus1de
  5. Ops for Developers – Monitoring with Prometheus 5 © msg

    | January 2017 | Ops for Developers - Monitoring with Prometheus | Alexander Schwartz Prometheus Manifesto 1 Setup 2 How to... 3 Prometheus works for Developers (and Ops) 4
  6. Prometheus Manifesto Monitoring © msg | January 2017 | Ops

    for Developers - Monitoring with Prometheus | Alexander Schwartz 6 Host & Application Metrics Alerts Dashboards
  7. Prometheus Manifesto Prometheus is a Monitoring System and Time Series

    Database © msg | January 2017 | Ops for Developers - Monitoring with Prometheus | Alexander Schwartz 7 Prometheus is an opinionated solution for instrumentation, collection, storage querying, alerting, dashboards, trending
  8. Prometheus Manifesto 1. PromCon 2016: Prometheus Design and Philosophy -

    Why It Is the Way It Is - Julius Volz https://youtu.be/4DzoajMs4DM / https://goo.gl/1oNaZV Prometheus values … © msg | January 2017 | Ops for Developers - Monitoring with Prometheus | Alexander Schwartz 8 operational systems monitoring (not only) for the cloud simple single node w/ local storage for a few weeks horizontal scaling, clustering, multitenancy raw logs and events, tracing of requests, magic anomaly detection, accounting, SLA reporting over over over over over configuration files Web UI, user management pulling data from single processes pushing data from processes aggregation on nodes NoSQL query & data massaging multidimensional data everything as float64 point-and-click configurations data silos complex data types
  9. Ops for Developers – Monitoring with Prometheus 9 © msg

    | January 2017 | Ops for Developers - Monitoring with Prometheus | Alexander Schwartz Prometheus Manifesto 1 Setup 2 How to... 3 Prometheus works for Developers (and Ops) 4
  10. Dashboards Setup Technical Building Blocks © msg | January 2017

    | Ops for Developers - Monitoring with Prometheus | Alexander Schwartz 10 Host & Application Metrics Alerts Grafana E-Mail Slack Pagerduty Container: cadvisor Java: simple_client Host: node_exporter … Optional: Service Discovery Consul Kubernetes … … Prometheus Alertmanager
  11. Ops for Developers – Monitoring with Prometheus 11 © msg

    | January 2017 | Ops for Developers - Monitoring with Prometheus | Alexander Schwartz Prometheus Manifesto 1 Setup 2 How to... 3 Prometheus works for Developers (and Ops) 4
  12. How to… Information about your node © msg | January

    2017 | Ops for Developers - Monitoring with Prometheus | Alexander Schwartz 12 Presented by: node_exporter Free disk space: Variable: node_filesystem_free Expression: node_filesystem_free{fstype =~ '(xfs|vboxsf)', device !~ '/dev/mapper/.*' } Additional Options: Axis / Left Y -> Unit bytes Percent free: Variables: node_filesystem_free, node_filesystem_size Expression: node_filesystem_free / node_filesystem_size {fstype =~ '(xfs|vboxsf)'}
  13. How to… Information about your containers © msg | January

    2017 | Ops for Developers - Monitoring with Prometheus | Alexander Schwartz 13 Presented by: cadvisor RAM Usage per container: Variable: container_memory_usage_bytes Expression: container_memory_usage_bytes{name=~'.+',id=~'/docker/.*'} CPU Usage per container: Variable: container_cpu_usage_seconds_total Expression: rate(container_cpu_usage_seconds_total [30s]) irate(container_cpu_usage_seconds_total [30s]) sum by (instance, name) (irate(container_cpu_usage_seconds_total{name=~'.+'} [15s]))
  14. How to… Information about your JVM © msg | January

    2017 | Ops for Developers - Monitoring with Prometheus | Alexander Schwartz 14 Presented by: Java simple_client RAM Usage of Java VM: Variable: jvm_memory_bytes_used Expressions: irate(container_cpu_usage_seconds_total [30s]) sum by (instance, job) (jvm_memory_bytes_used) sum by (instance, job) (jvm_memory_bytes_committed) CPU seconds used by Garbage Collection: Variable: jvm_gc_collection_seconds_sum Expression: sum by (job, instance) (irate(jvm_gc_collection_seconds_sum [10s])) Test: ab -n 100000 -c 10 http://192.168.23.1:8080/manage/metrics
  15. How to… Information about your Application Metrics © msg |

    January 2017 | Ops for Developers - Monitoring with Prometheus | Alexander Schwartz 15 Presented by: Java simple_client, Dropwizard Metrics/Spring Timings of a method call: Java Annotation: @Timed Variables: countedCallExample_snapshot_mean countedCallExample_snapshot_75thPercentile countedCallExample_snapshot_98thPercentile Test: ab -n 10000 -c 10 http://192.168.23.1:8080/api/countedCall
  16. How to… Information about your External Interfaces © msg |

    January 2017 | Ops for Developers - Monitoring with Prometheus | Alexander Schwartz 16 Presented by: Java simple_client, Hystrix/Spring Hystrix Metrics: Java Annotation: @HystrixCommand Test: ab -n 10000 -c 10 http://192.168.23.1:8080/api/externalCall Variables: hystrix_command_count_success, hystrix_command_count_exceptions_thrown hystrix_command_latency_total_* Expressions: irate(hystrix_command_count_success [15s]) irate(hystrix_command_count_exceptions_thrown [15s]) hystrix_command_latency_total_mean hystrix_command_latency_total_percentile_90 hystrix_command_latency_total_percentile_99
  17. How to… Information about your Application Metrics © msg |

    January 2017 | Ops for Developers - Monitoring with Prometheus | Alexander Schwartz 17 Presented by: your own Java metric provider Tomcat DB metrics: Java Class: for example: TomcatStatisticsCollector Variables: tomcat_thread_pool_current_thread_count tomcat_thread_pool_current_threads_busy
  18. How to… Federation of Prometheus © msg | January 2017

    | Ops for Developers - Monitoring with Prometheus | Alexander Schwartz 18 Any Metric can be exported to other Prometheus instances http://localhost/prometheus/federate?match[]={job=%22prometheus%22}
  19. How to… Alerting with Prometheus © msg | January 2017

    | Ops for Developers - Monitoring with Prometheus | Alexander Schwartz 19 Any expression can be used for alerting ALERT HDD_Alert_warning IF (1 - node_filesystem_free{mountpoint=~".*"} / node_filesystem_size{mountpoint=~".*"}) * 100 > 70 FOR 5m LABELS {severity="warning"} ANNOTATIONS {summary=“High disk usage on {{ $labels.instance }}: filesystem {{$labels.mountpoint}} more than 70 % full."}
  20. Ops for Developers – Monitoring with Prometheus 20 © msg

    | January 2017 | Ops for Developers - Monitoring with Prometheus | Alexander Schwartz Prometheus Manifesto 1 Setup 2 How to... 3 Prometheus works for Developers (and Ops) 4
  21. Prometheus works for Developers (and Ops) Prometheus is “friendly tech”

    in your environment © msg | January 2017 | Ops for Developers - Monitoring with Prometheus | Alexander Schwartz 21 Team friendly • Every team can run its own Prometheus instance to monitor their own and neighboring systems • Flexible to collect and aggregate the information that is needed Coder and Continuous Delivery friendly • All configurations (except dashboard) are kept as code and are guarded by version control • Changes can be tested locally and easily staged to the next environment Simple Setup • Go binaries for prometheus and alertmanager available for all major operating systems • Client libraries for several languages available (also adapters to existing metrics libraries) • Several existing exporters for various needs
  22. Links © msg | January 2017 | Ops for Developers

    - Monitoring with Prometheus | Alexander Schwartz 22 Prometheus: https://prometheus.io Hystrix https://github.com/Netflix/Hystrix Dropwizard Metrics http://metrics.dropwizard.io @ahus1de Julius Volz @ PromCon 2016 Prometheus Design and Philosophy - Why It Is the Way It Is https://youtu.be/4DzoajMs4DM https://goo.gl/1oNaZV
  23. .consulting .solutions .partnership Alexander Schwartz Principal IT Consultant +49 171

    5625767 [email protected] @ahus1de msg systems ag (Headquarters) Robert-Buerkle-Str. 1, 85737 Ismaning Germany www.msg-systems.com