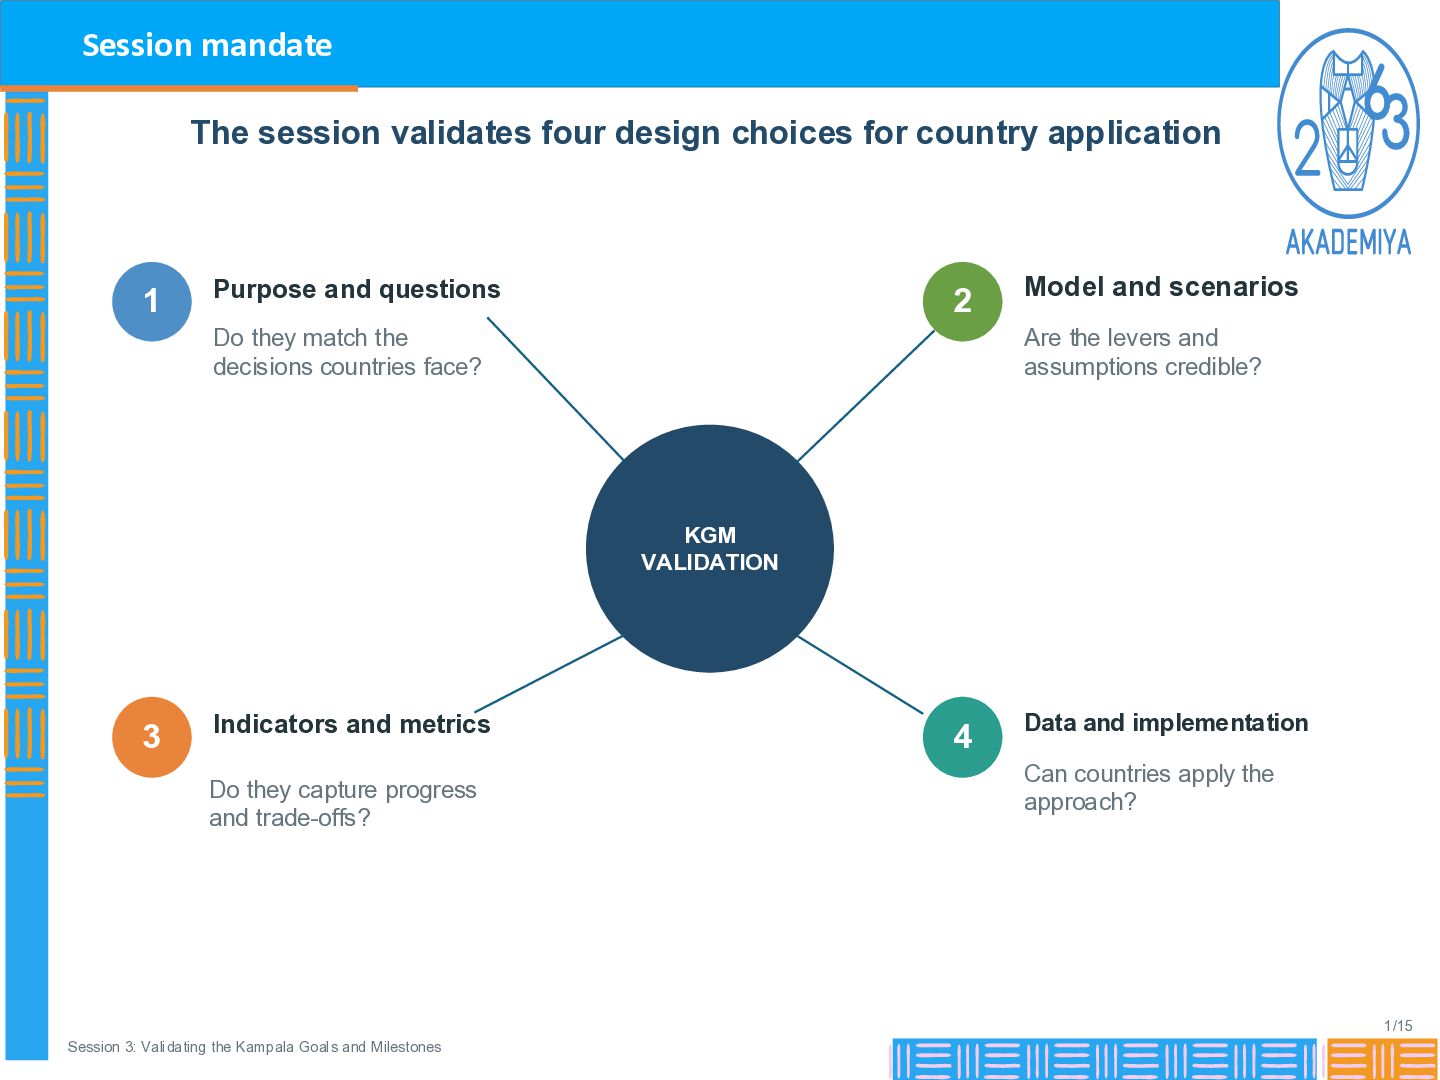
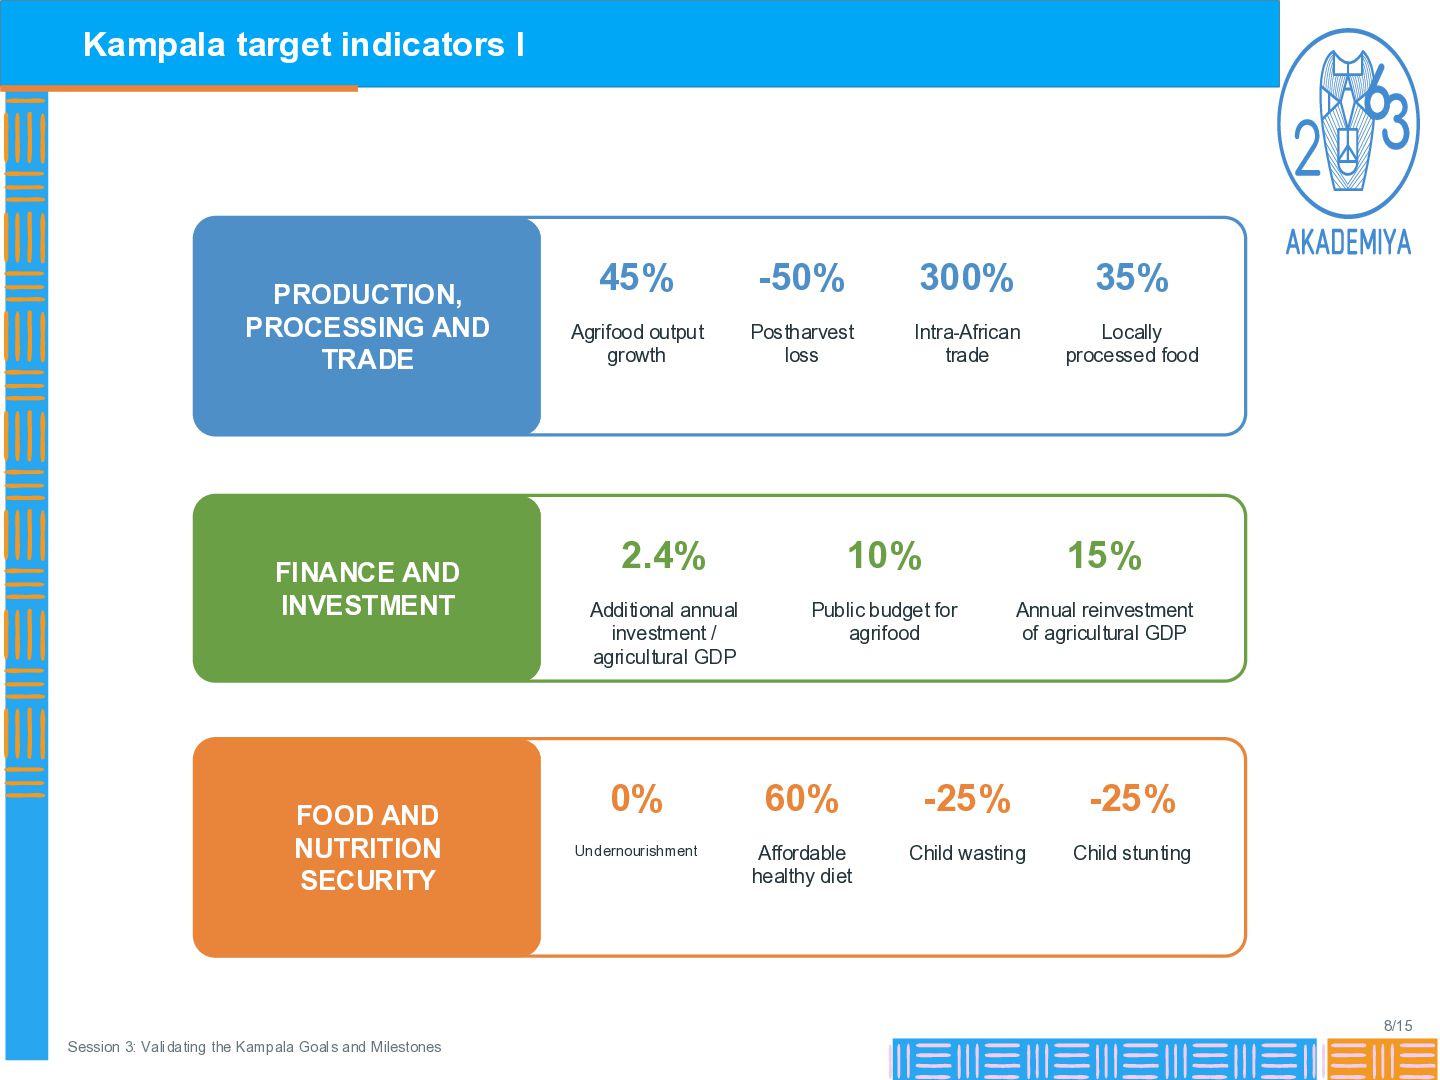
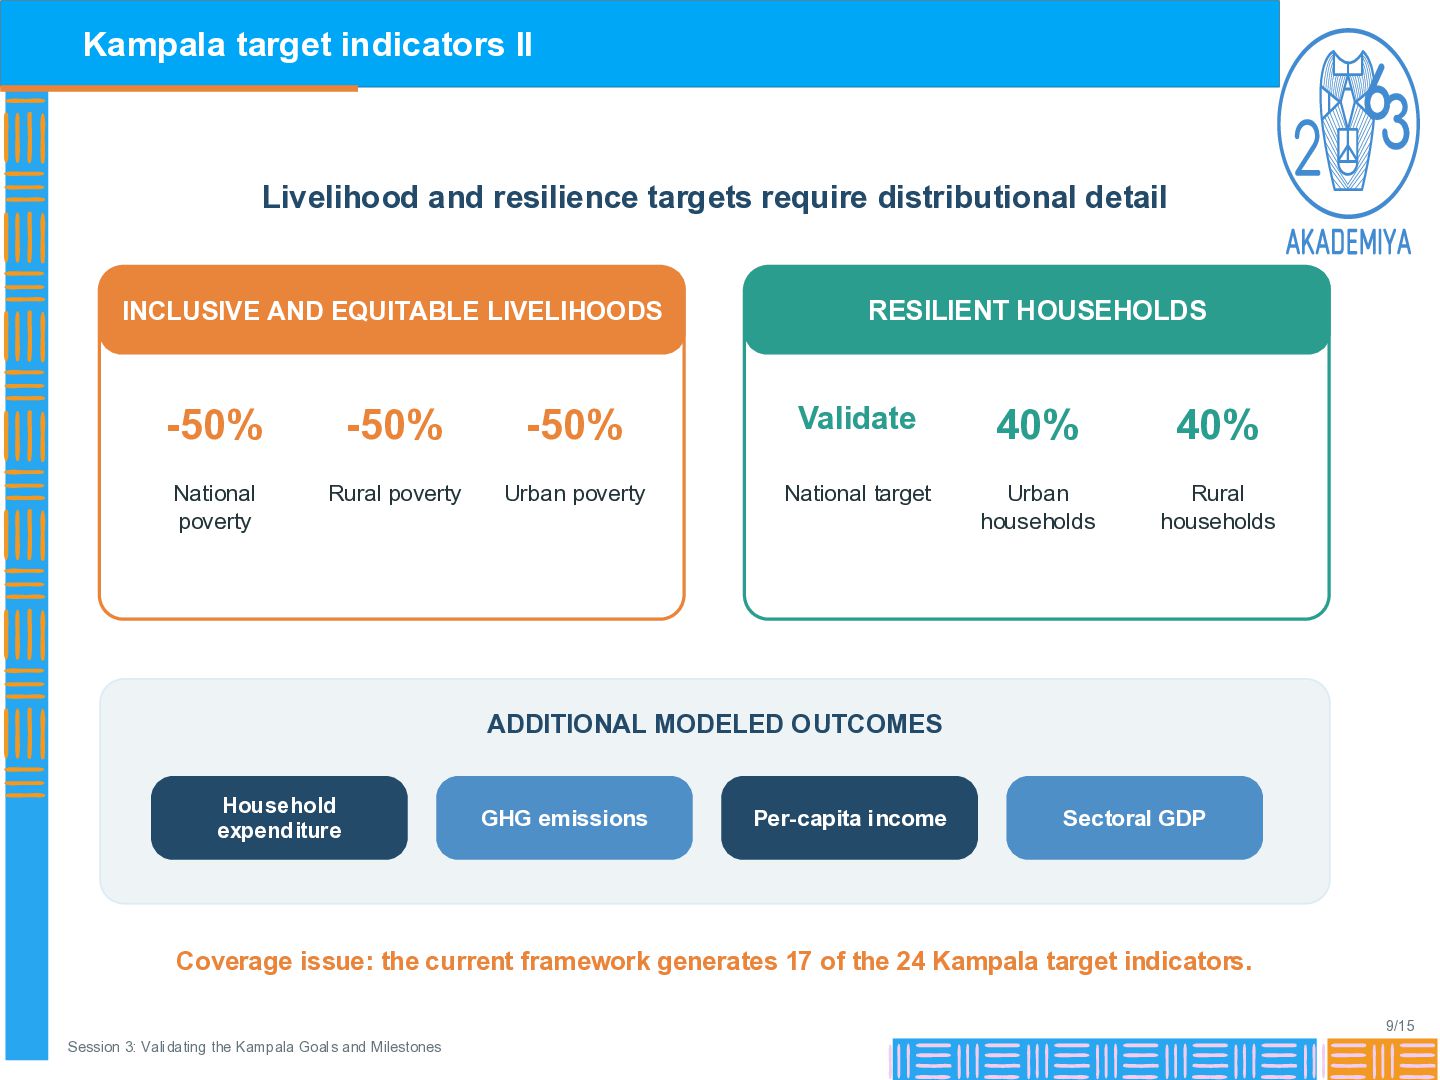
application 1 Purpose and questions 2 Do they match the decisions countries face? Model and scenarios Are the levers and assumptions credible? KGM VALIDATION 3 Indicators and metrics Do they capture progress and trade-offs? 4 Data and implementation Can countries apply the approach? 1/15 Session 3: Validating the Kampala Goals and Milestones
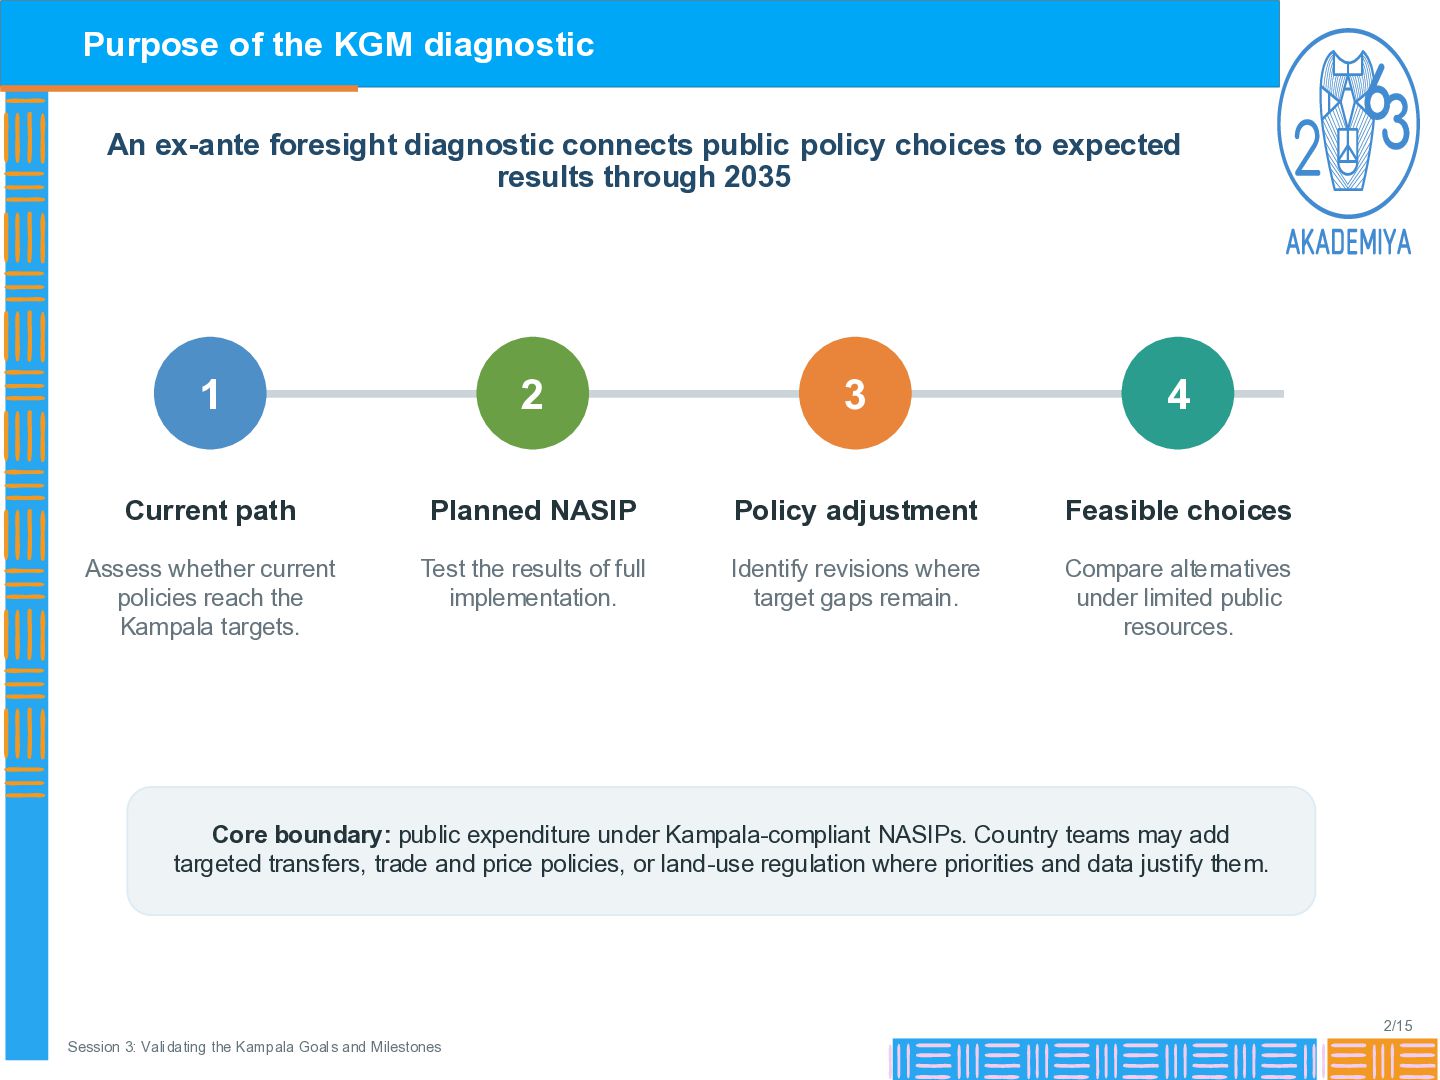
public policy choices to expected results through 2035 1 2 3 4 Current path Planned NASIP Policy adjustment Feasible choices Assess whether current policies reach the Kampala targets. Test the results of full implementation. Identify revisions where target gaps remain. Compare alternatives under limited public resources. Core boundary: public expenditure under Kampala-compliant NASIPs. Country teams may add targeted transfers, trade and price policies, or land-use regulation where priorities and data justify them. 2/15 Session 3: Validating the Kampala Goals and Milestones
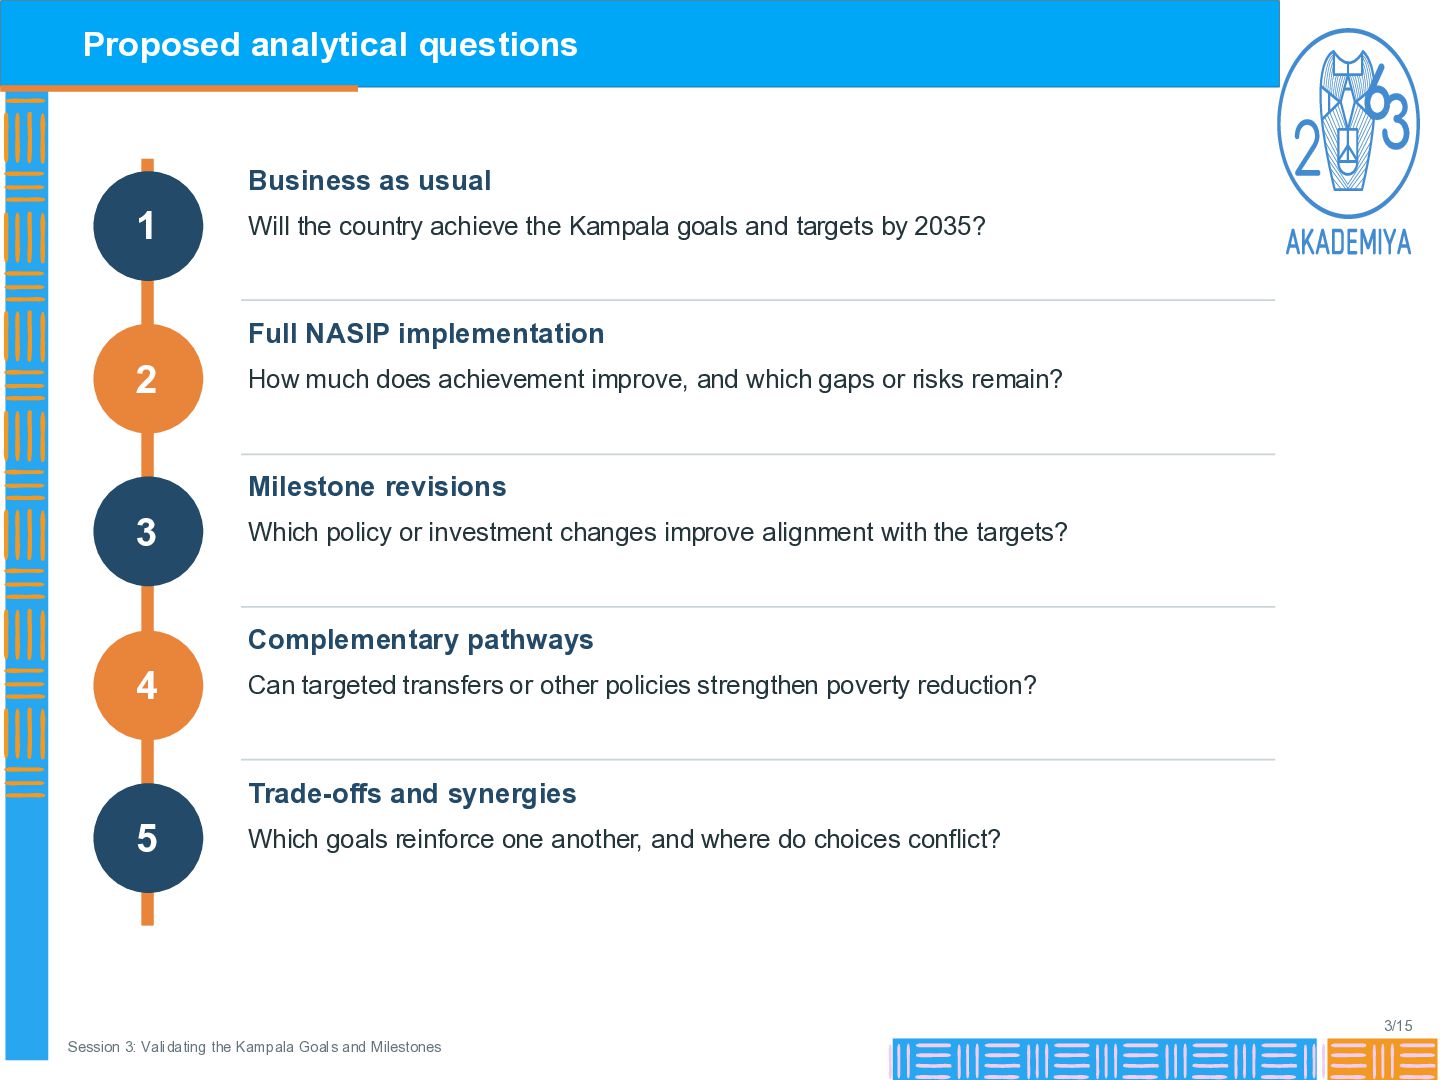
achieve the Kampala goals and targets by 2035? Full NASIP implementation 2 How much does achievement improve, and which gaps or risks remain? Milestone revisions 3 Which policy or investment changes improve alignment with the targets? Complementary pathways 4 Can targeted transfers or other policies strengthen poverty reduction? Trade-offs and synergies 5 Which goals reinforce one another, and where do choices conflict? 3/15 Session 3: Validating the Kampala Goals and Milestones
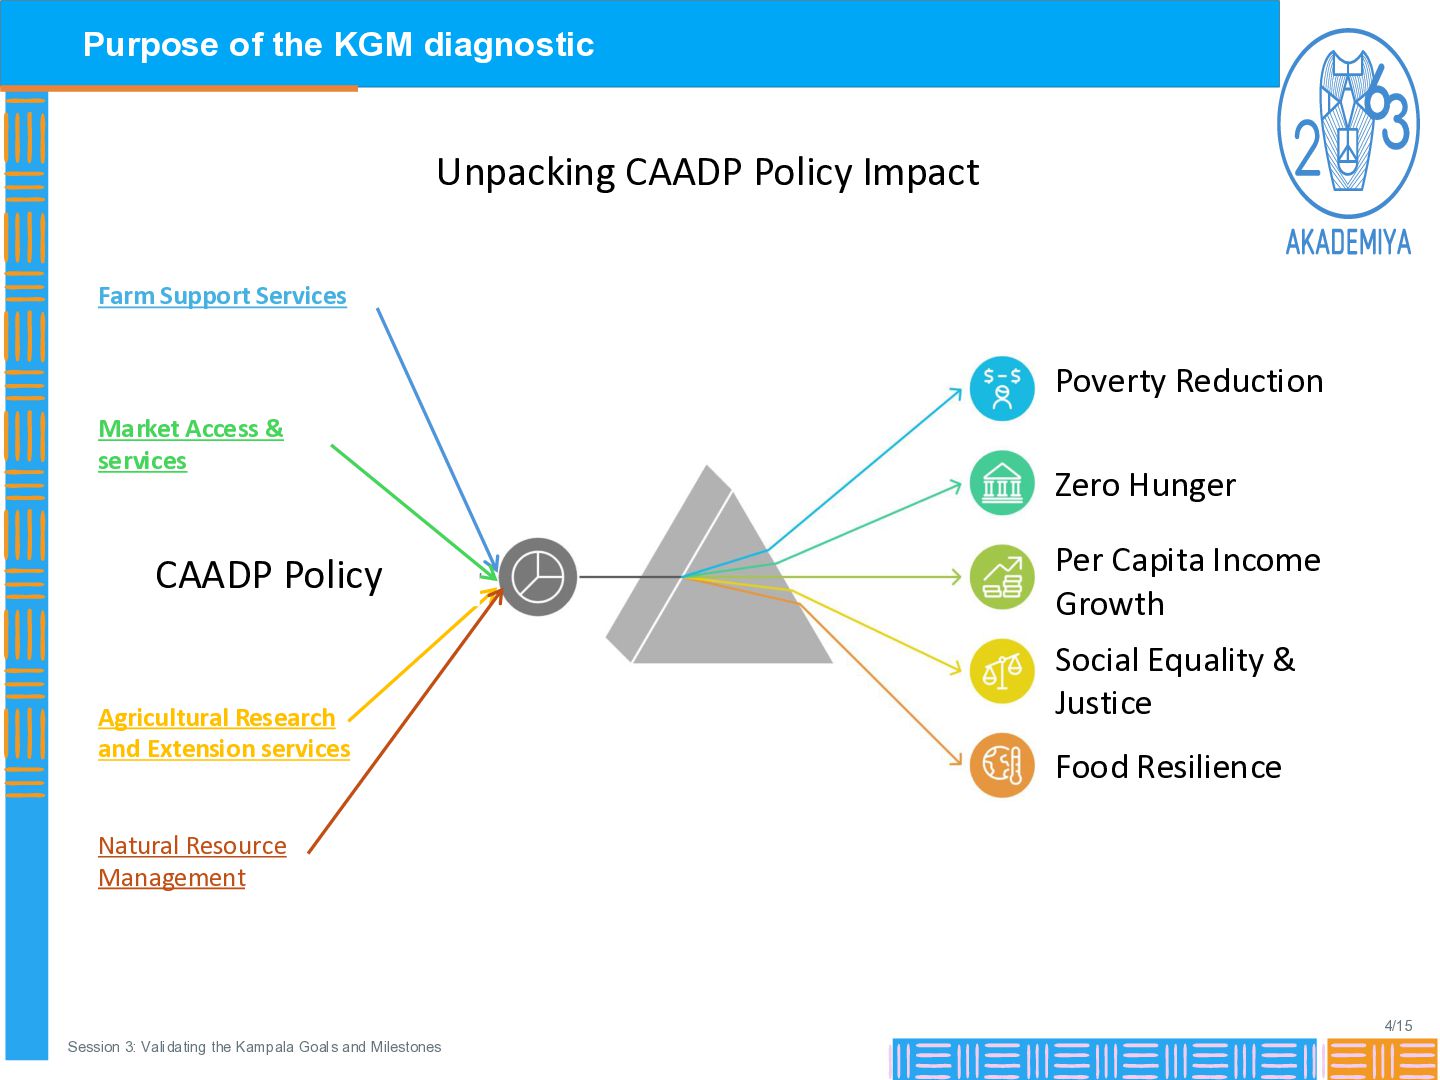
Support Services Poverty Reduction Market Access & services CAADP Policy Agricultural Research and Extension services Zero Hunger Per Capita Income Growth Social Equality & Justice Food Resilience Natural Resource Management 4/15 Session 3: Validating the Kampala Goals and Milestones
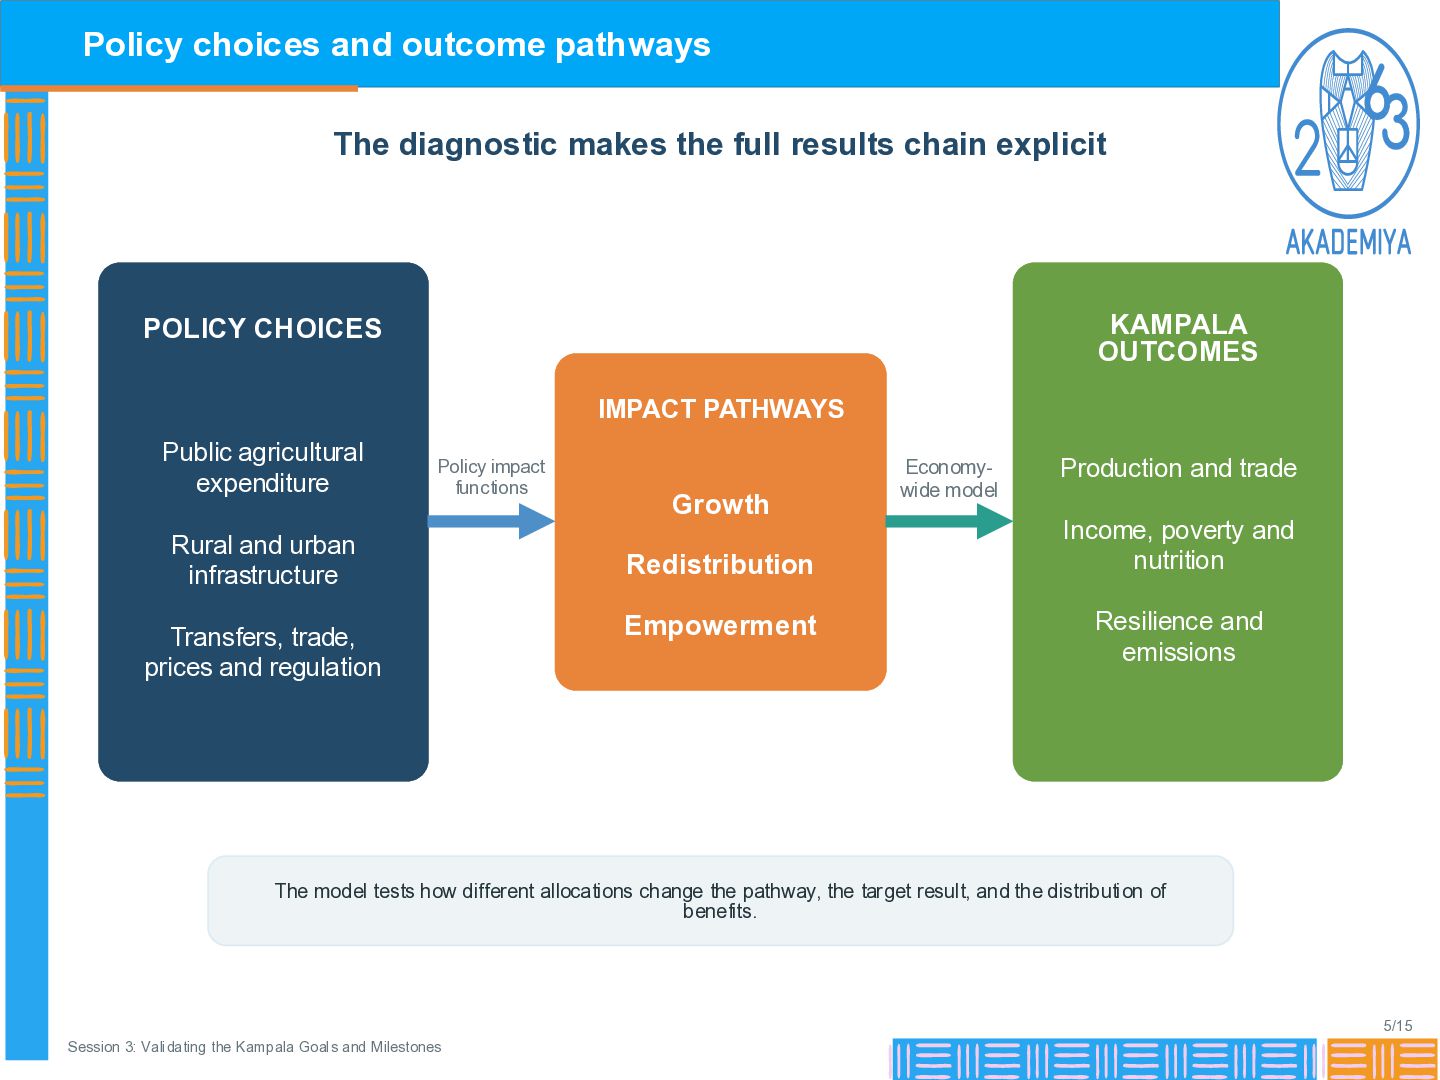
results chain explicit KAMPALA OUTCOMES POLICY CHOICES IMPACT PATHWAYS Public agricultural expenditure Policy impact functions Rural and urban infrastructure Transfers, trade, prices and regulation Growth Redistribution Empowerment Economywide model Production and trade Income, poverty and nutrition Resilience and emissions The model tests how different allocations change the pathway, the target result, and the distribution of benefits. 5/15 Session 3: Validating the Kampala Goals and Milestones
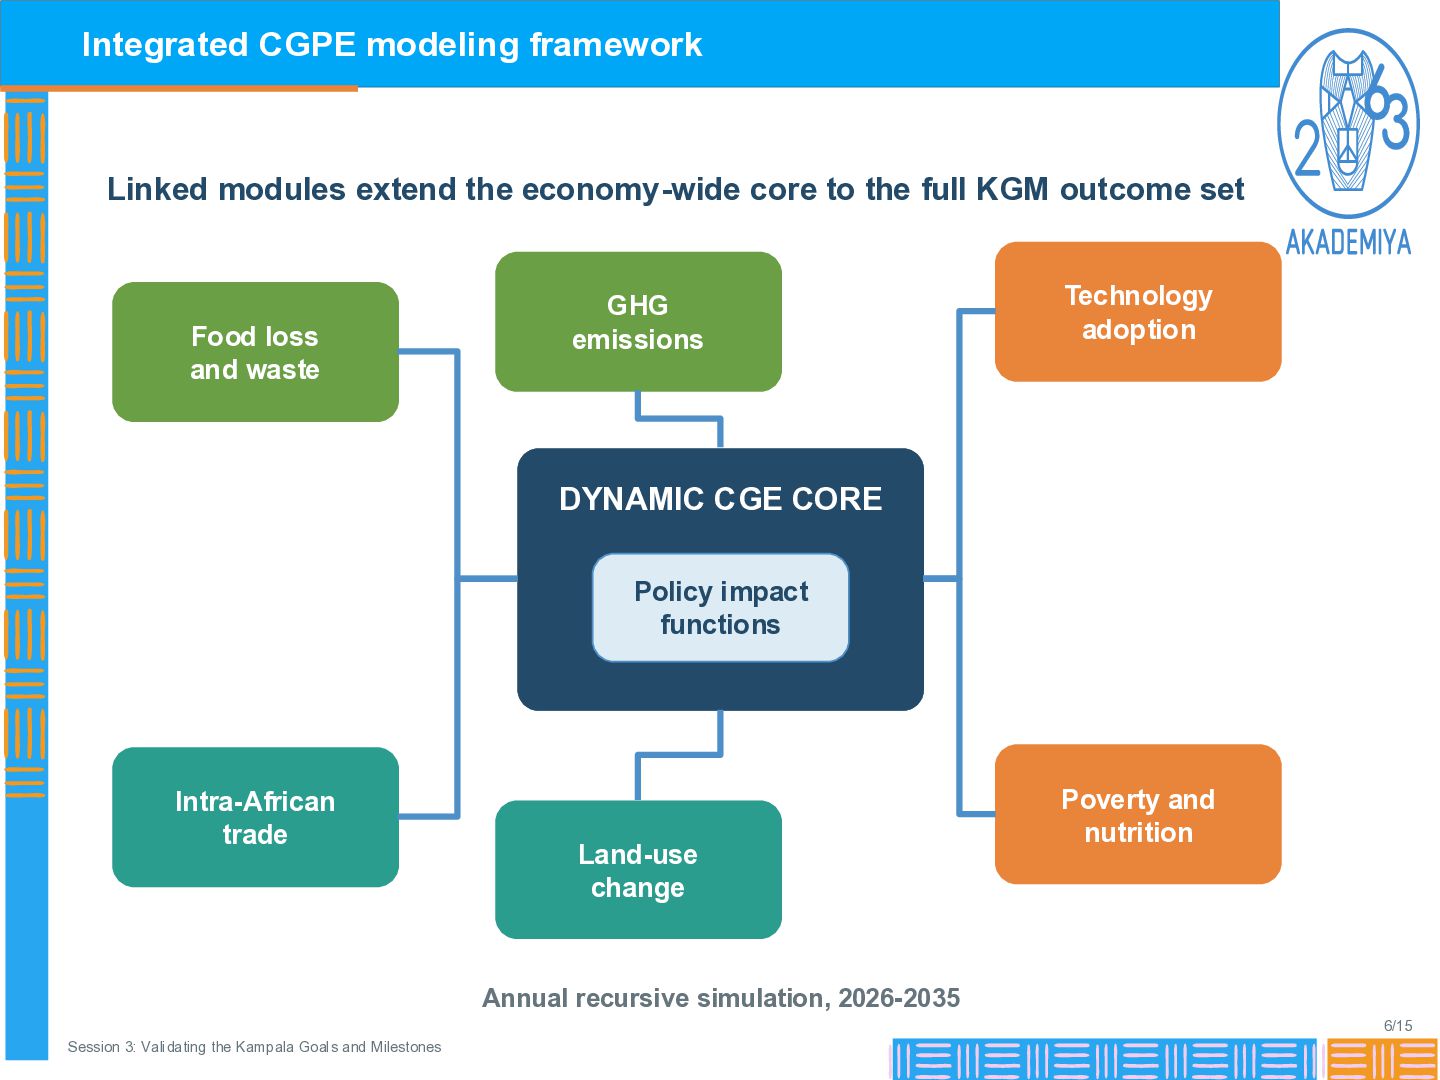
to the full KGM outcome set Food loss and waste GHG emissions Technology adoption DYNAMIC CGE CORE Policy impact functions Intra-African trade Land-use change Poverty and nutrition Annual recursive simulation, 2026-2035 6/15 Session 3: Validating the Kampala Goals and Milestones
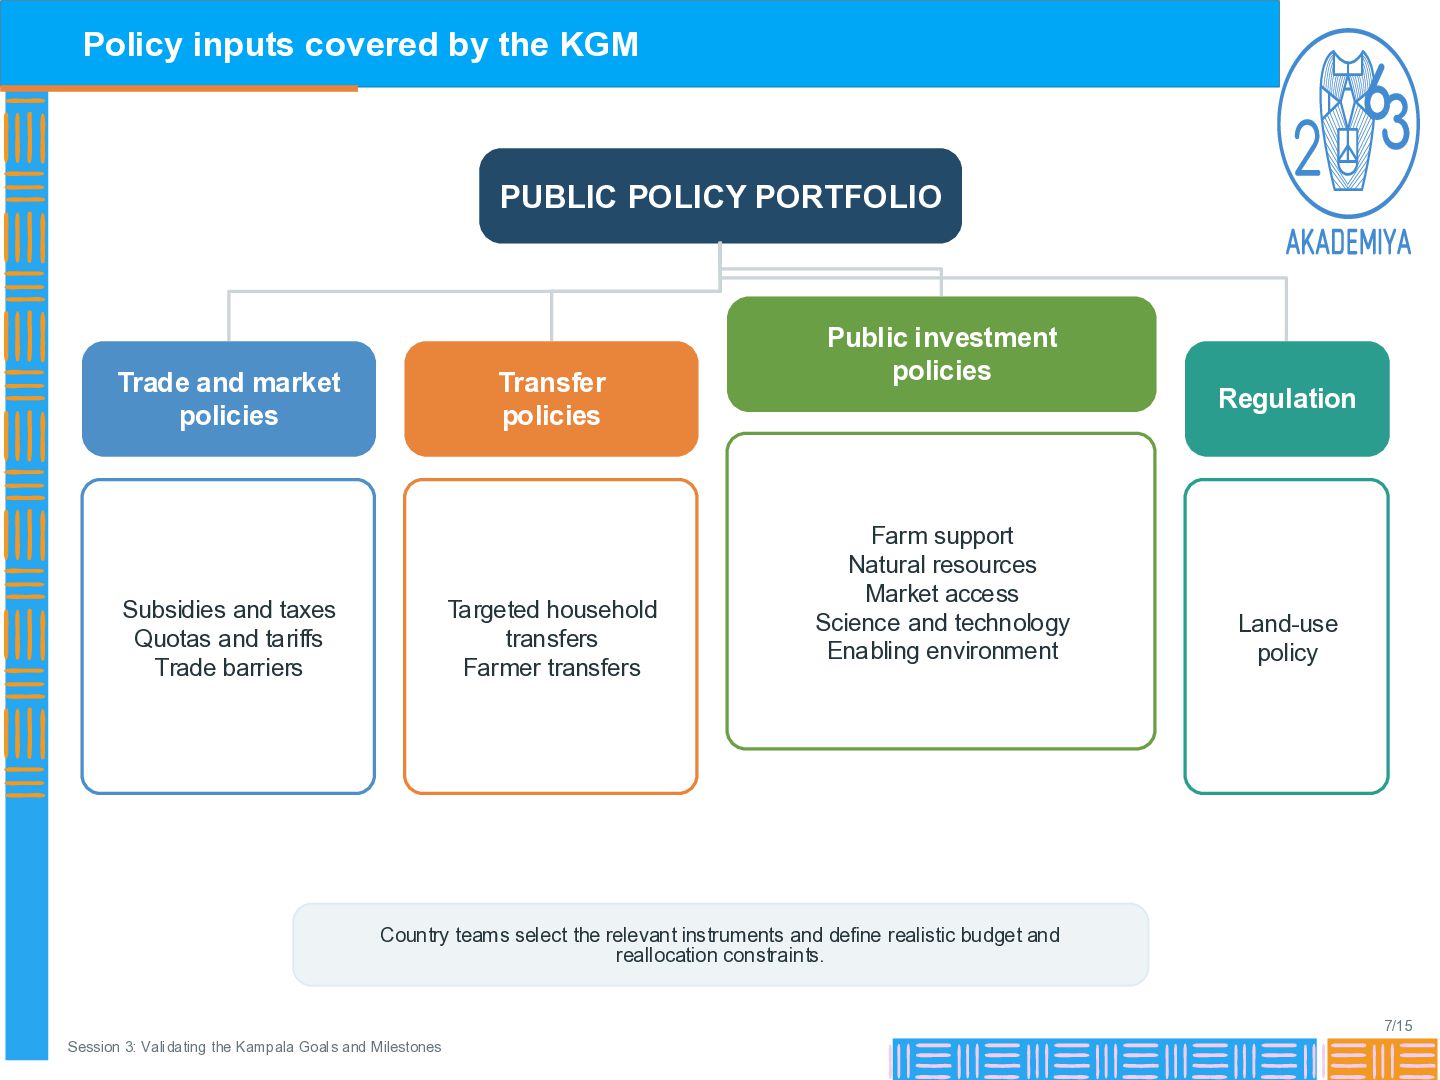
and market policies Transfer policies Subsidies and taxes Quotas and tariffs Trade barriers Targeted household transfers Farmer transfers Public investment policies Farm support Natural resources Market access Science and technology Enabling environment Regulation Land-use policy Country teams select the relevant instruments and define realistic budget and reallocation constraints. 7/15 Session 3: Validating the Kampala Goals and Milestones
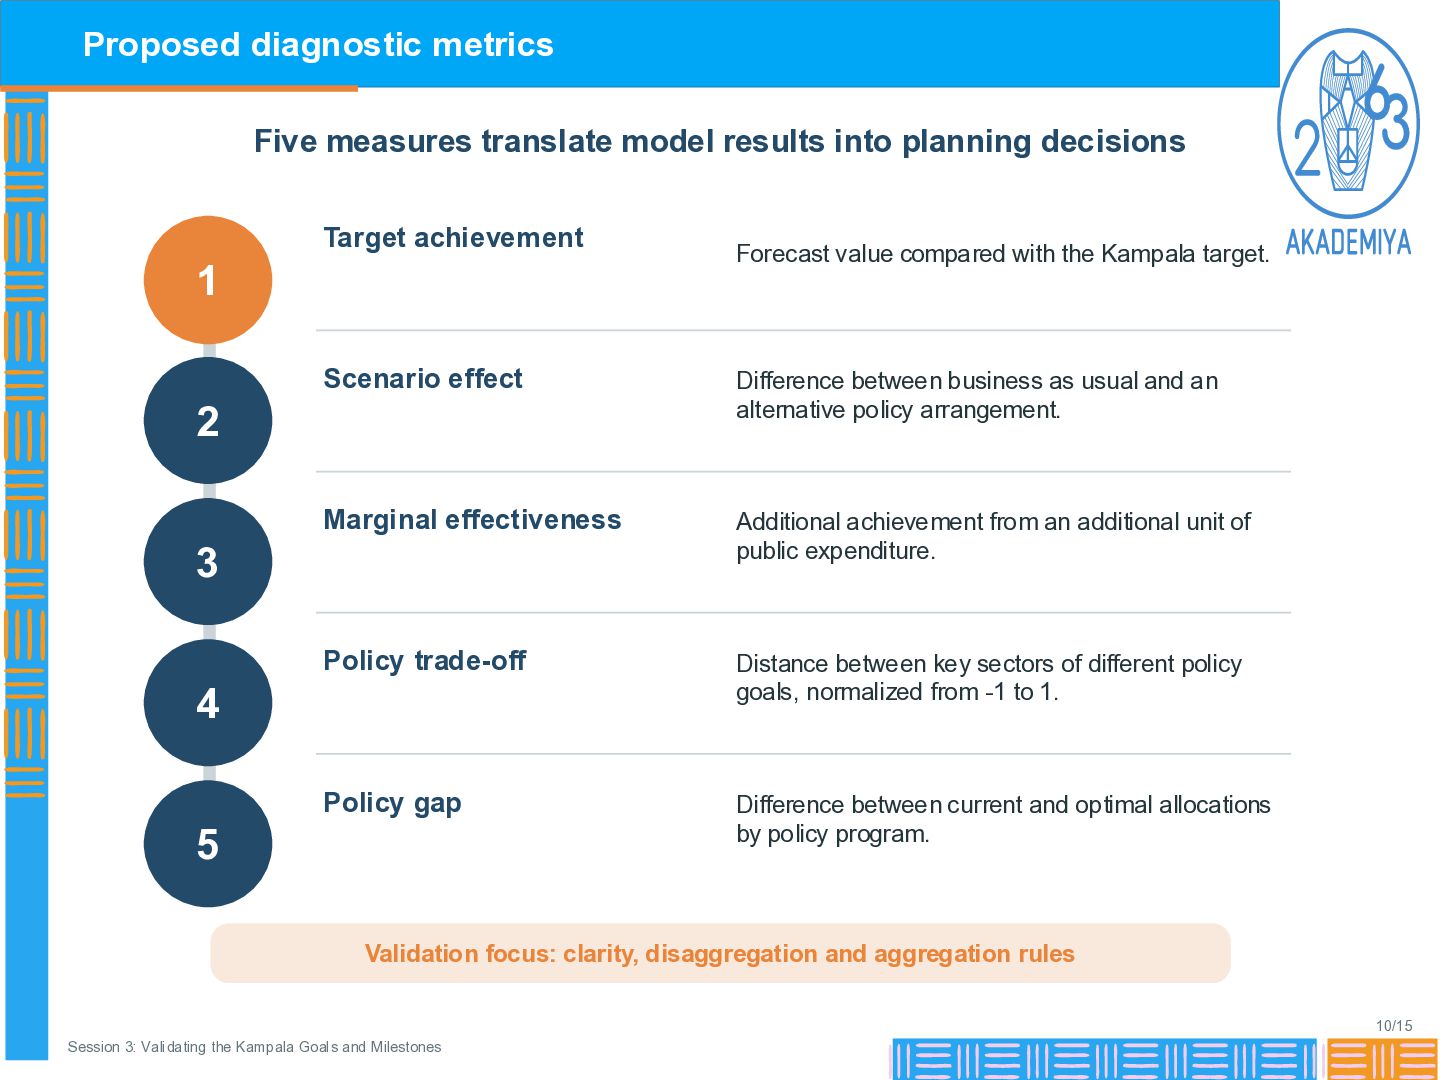
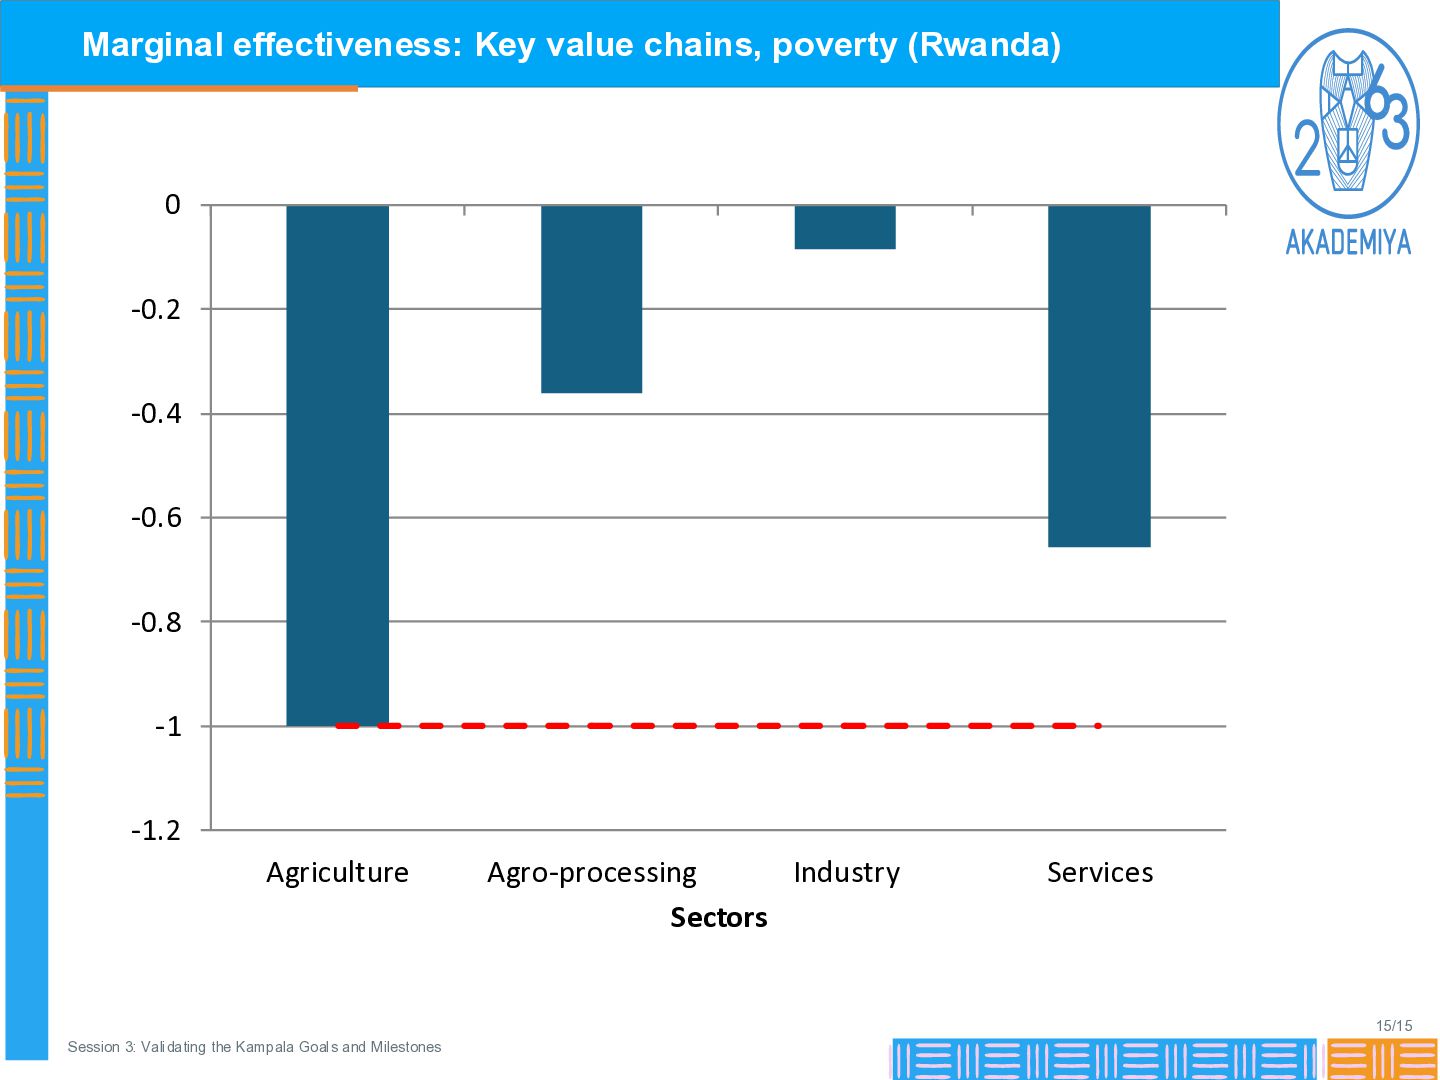
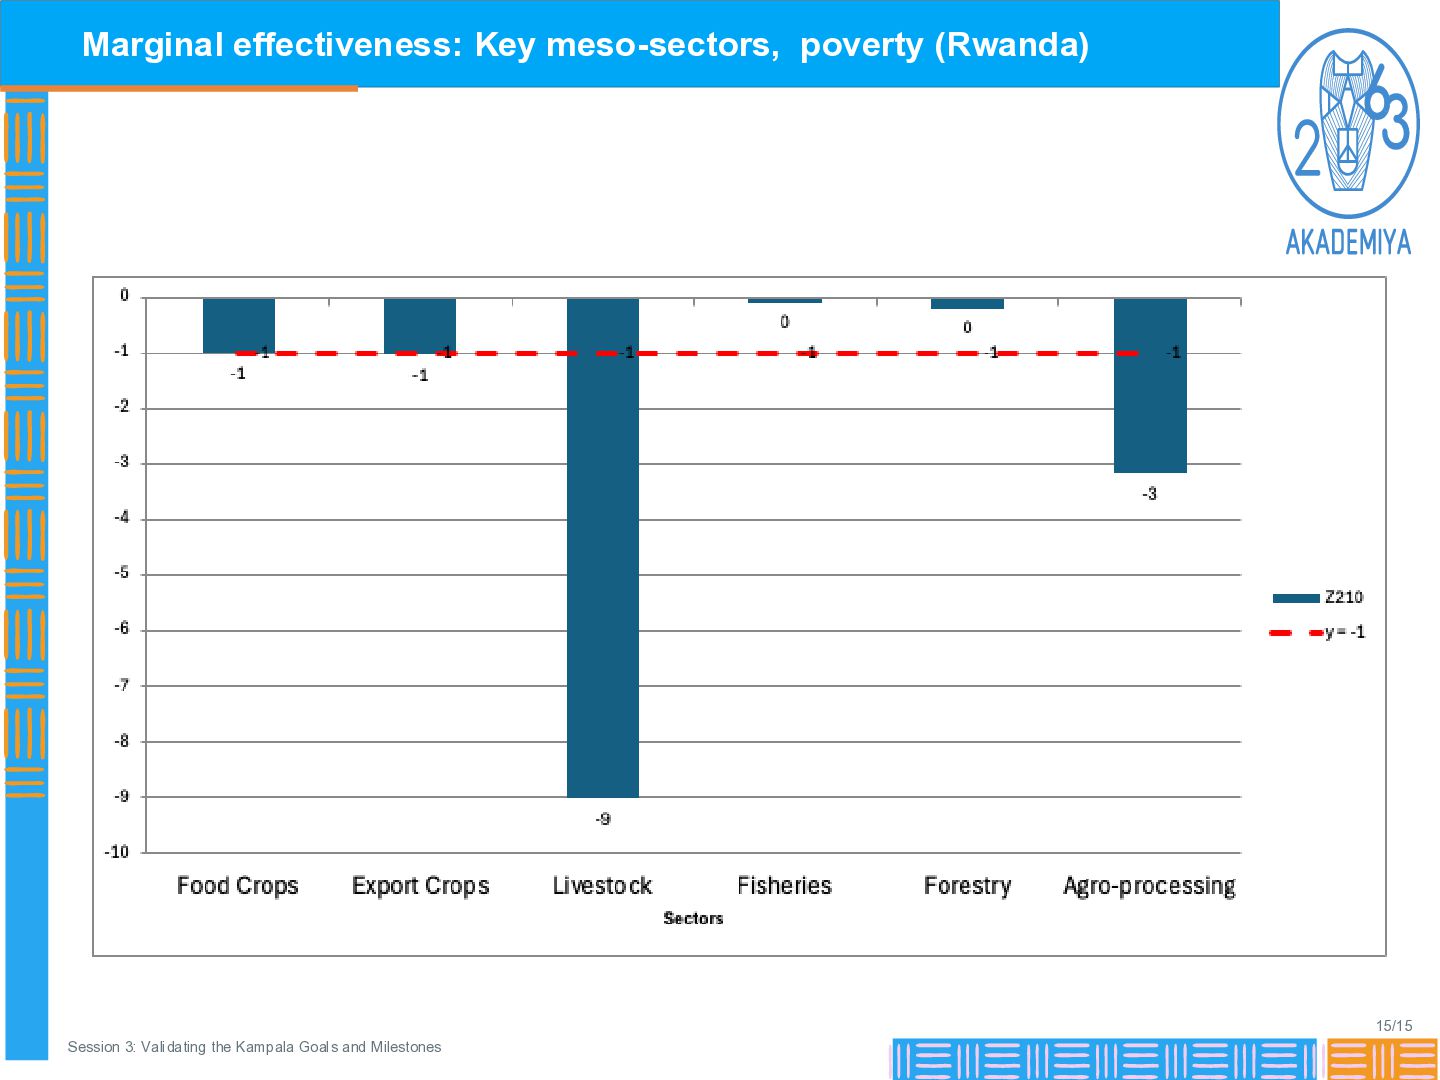
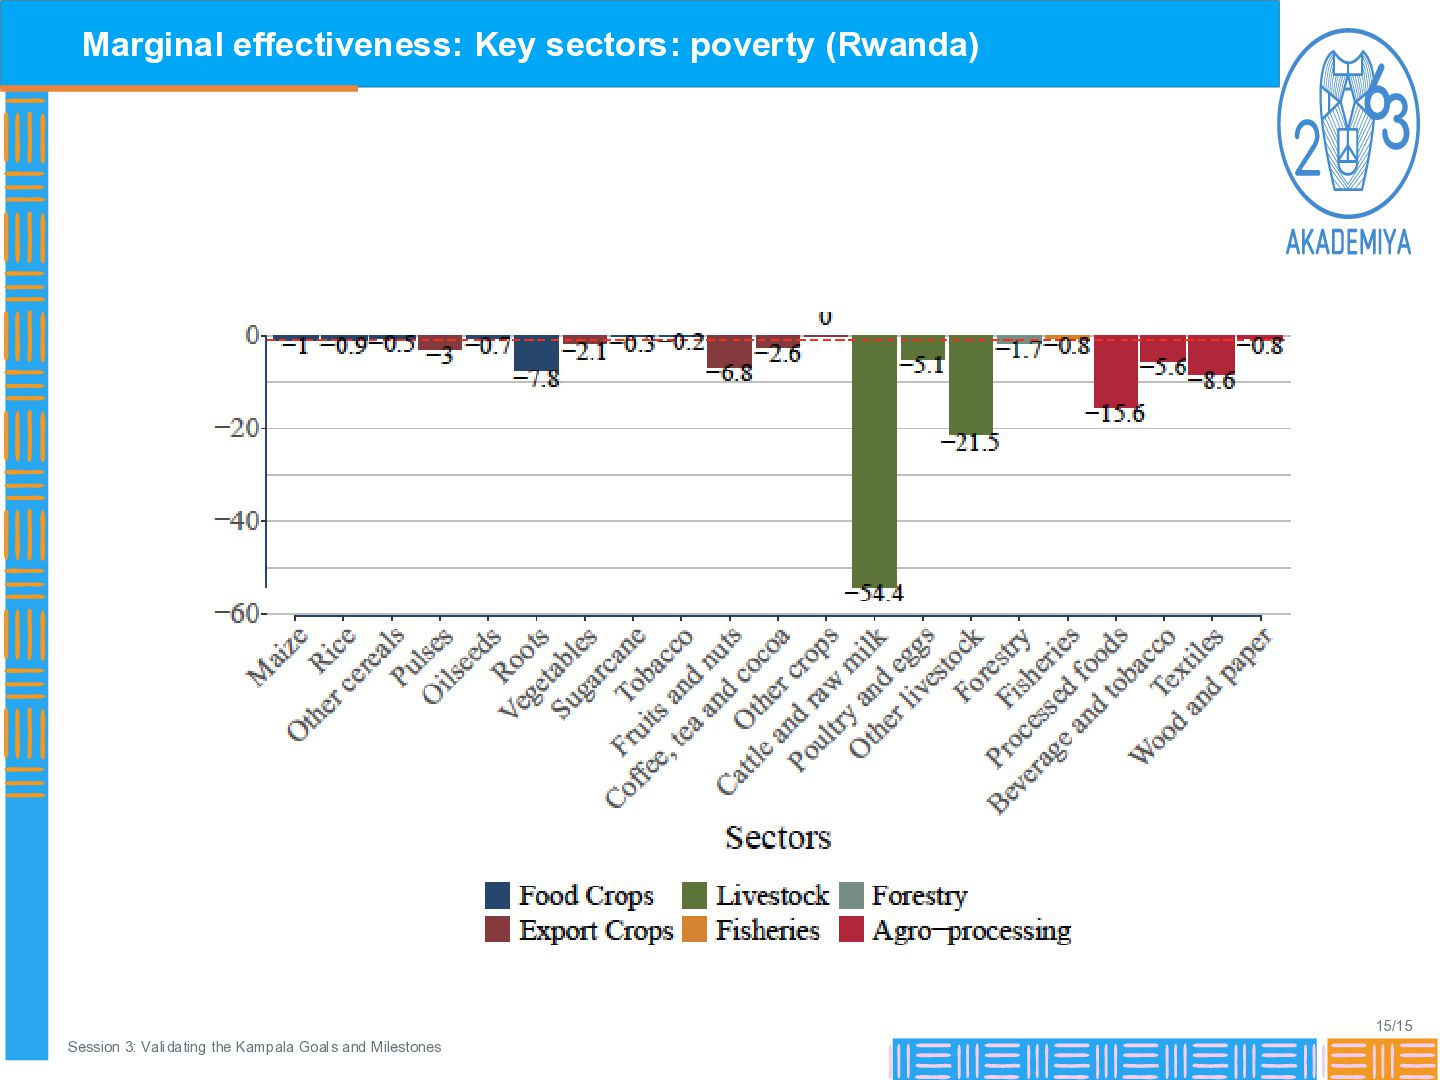
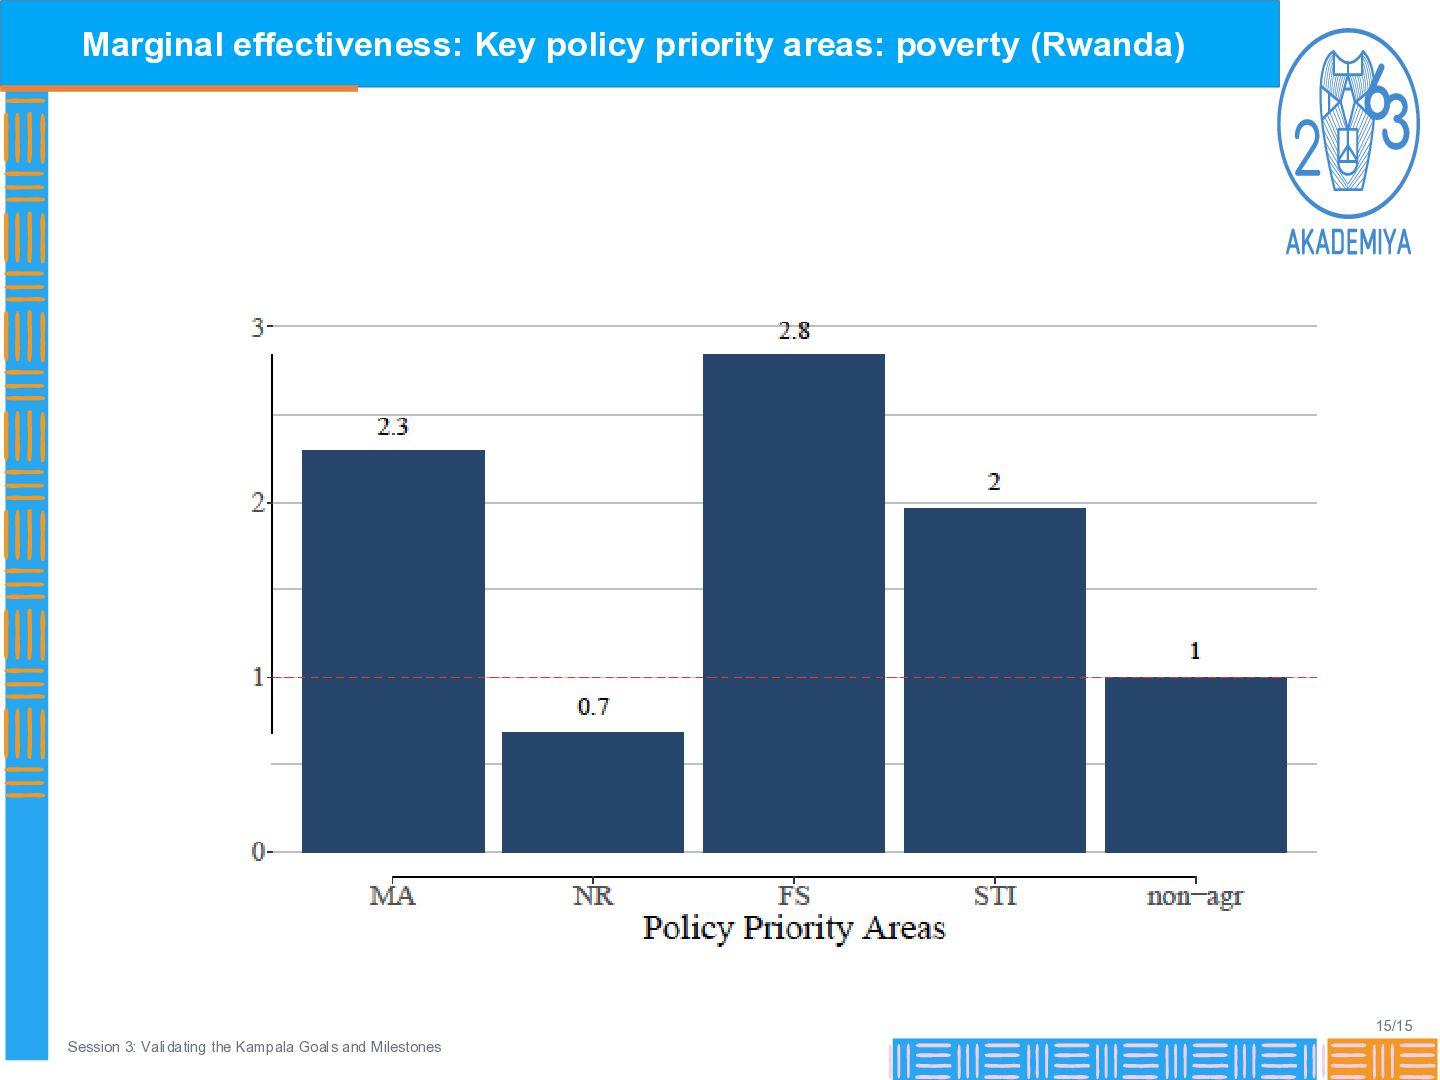
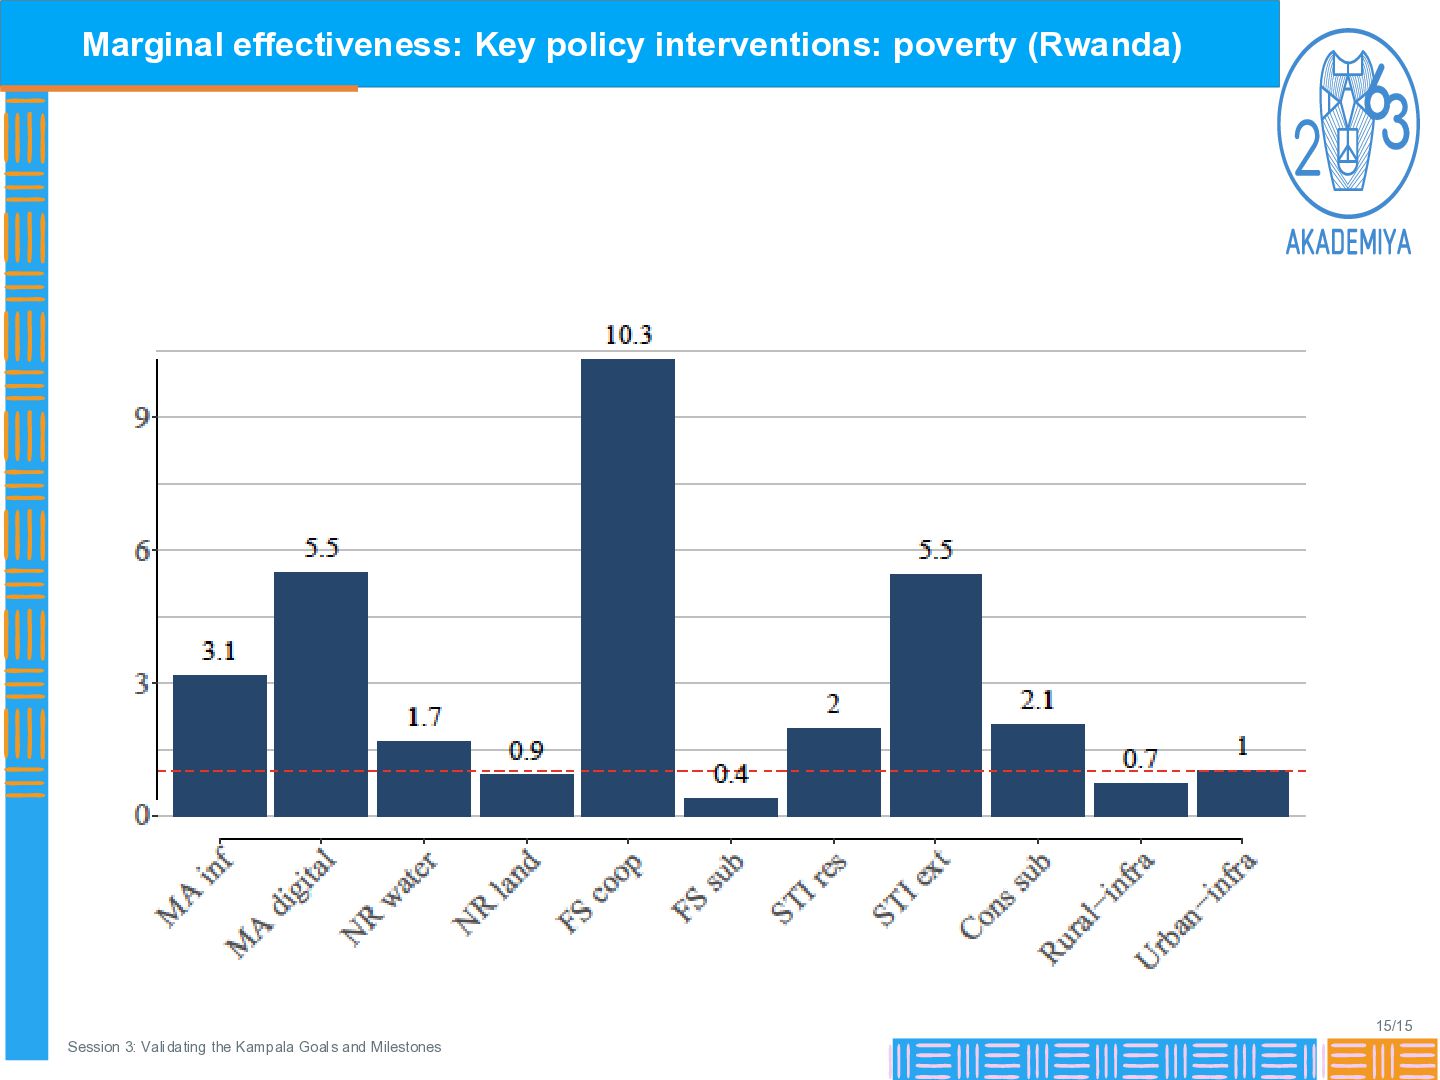
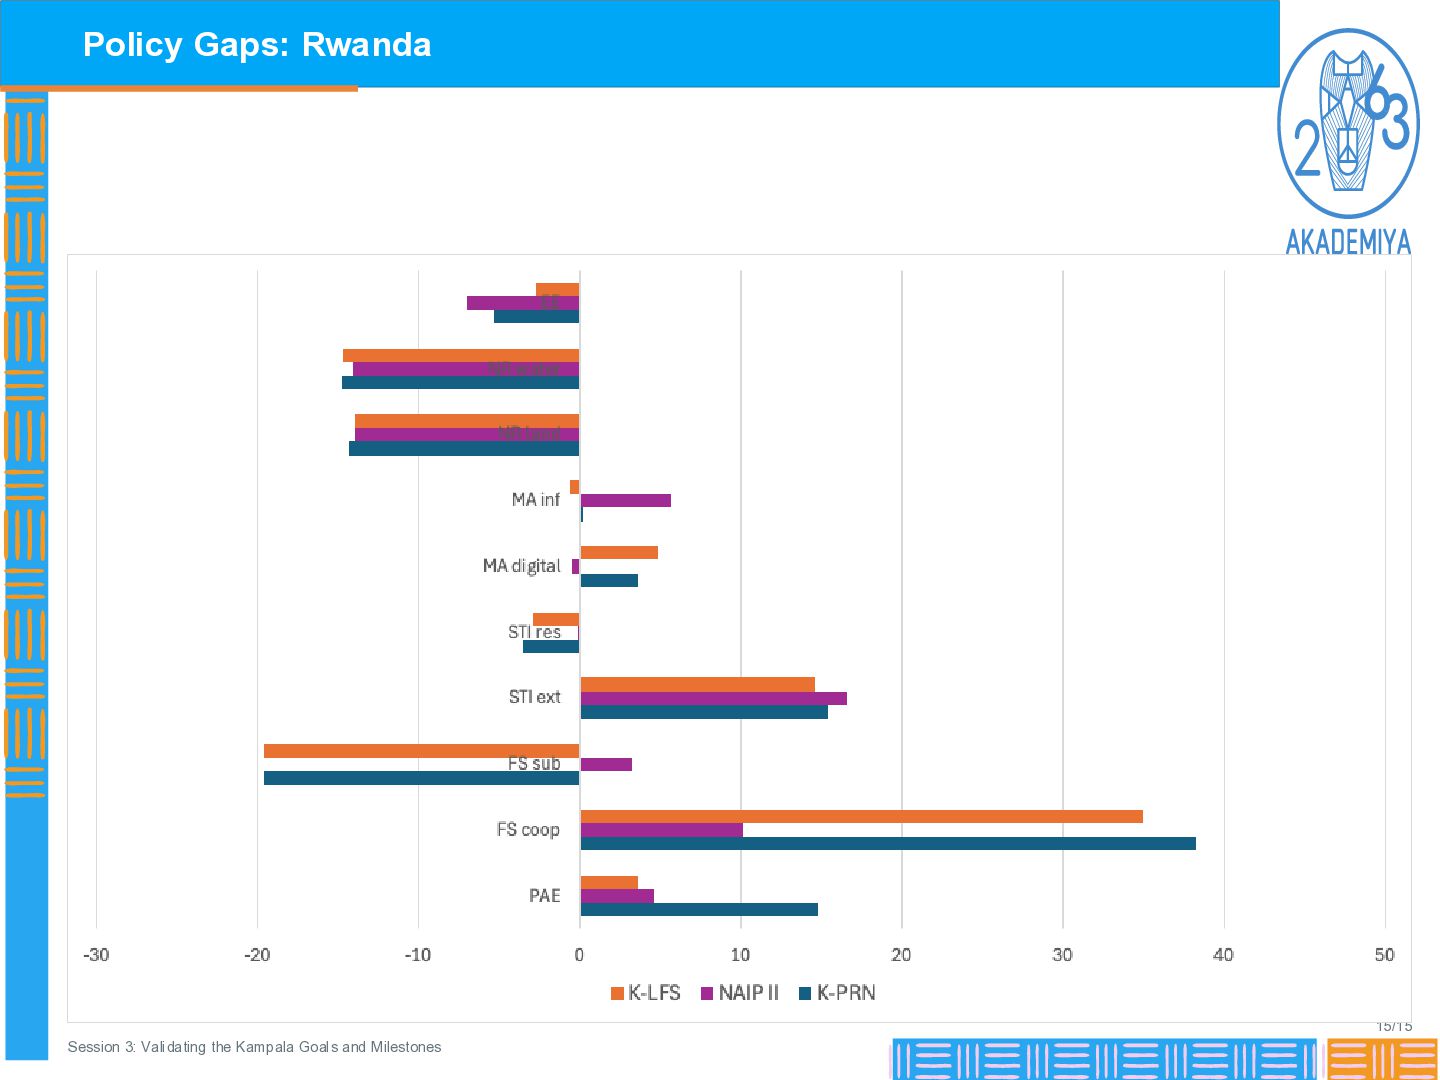
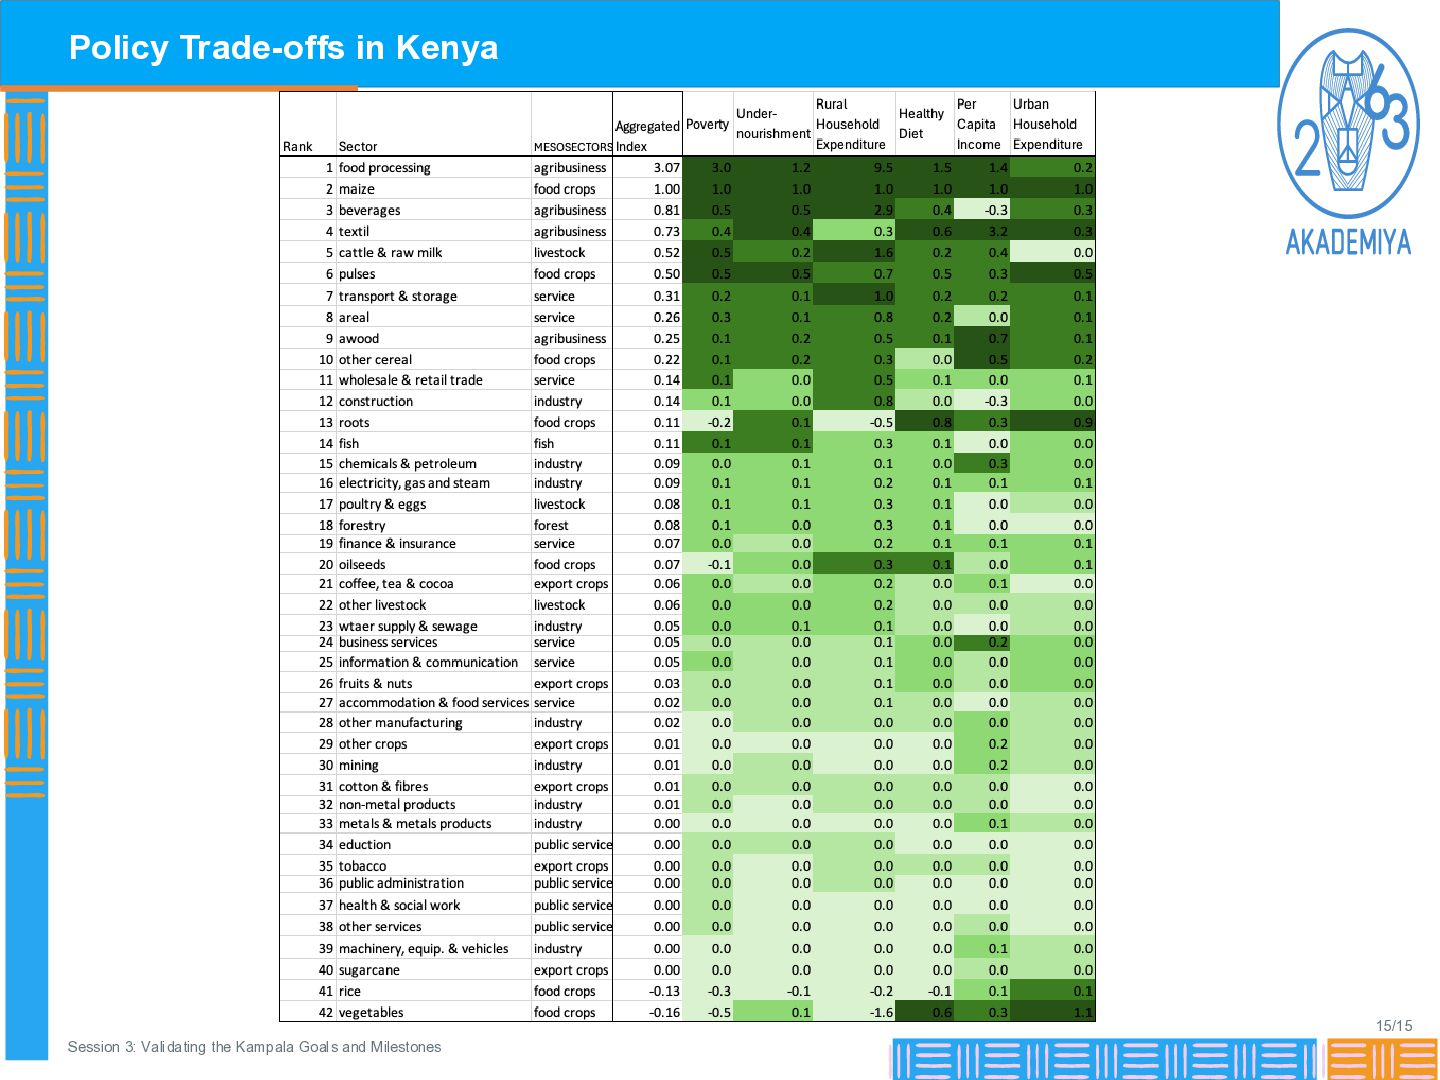
decisions Target achievement 1 Forecast value compared with the Kampala target. Scenario effect Difference between business as usual and an alternative policy arrangement. Marginal effectiveness Additional achievement from an additional unit of public expenditure. Policy trade-off Distance between key sectors of different policy goals, normalized from -1 to 1. Policy gap Difference between current and optimal allocations by policy program. 2 3 4 5 Validation focus: clarity, disaggregation and aggregation rules 10/15 Session 3: Validating the Kampala Goals and Milestones
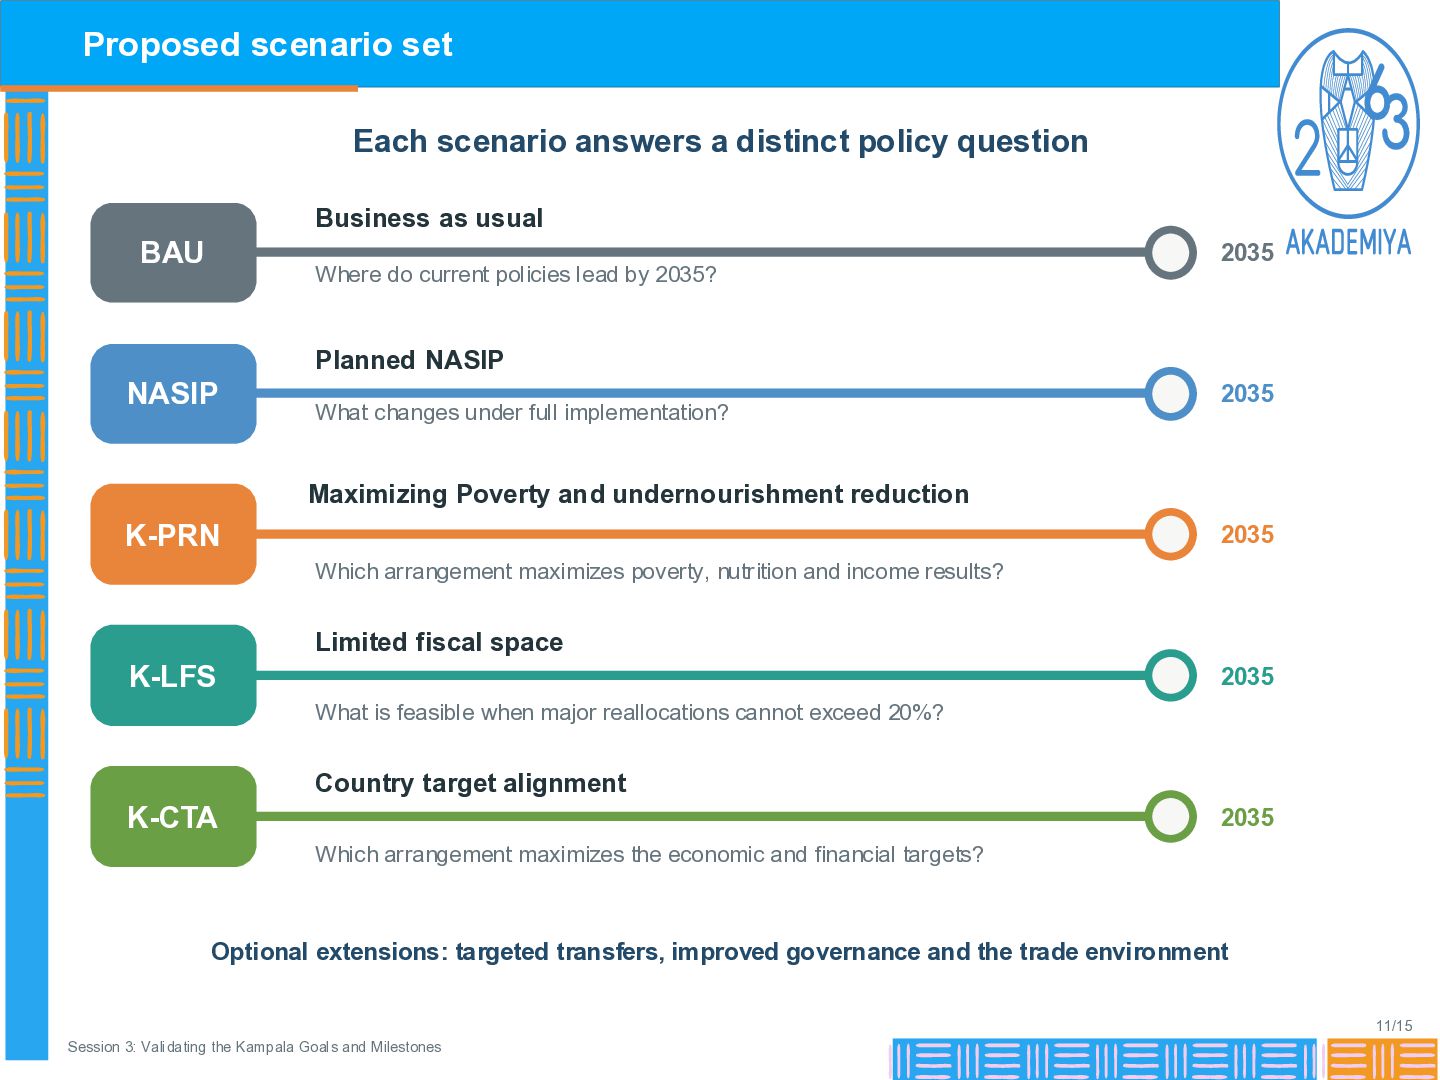
Business as usual BAU Where do current policies lead by 2035? 2035 Planned NASIP NASIP What changes under full implementation? 2035 Maximizing Poverty and undernourishment reduction K-PRN 2035 Which arrangement maximizes poverty, nutrition and income results? Limited fiscal space K-LFS 2035 What is feasible when major reallocations cannot exceed 20%? Country target alignment K-CTA 2035 Which arrangement maximizes the economic and financial targets? Optional extensions: targeted transfers, improved governance and the trade environment 11/15 Session 3: Validating the Kampala Goals and Milestones
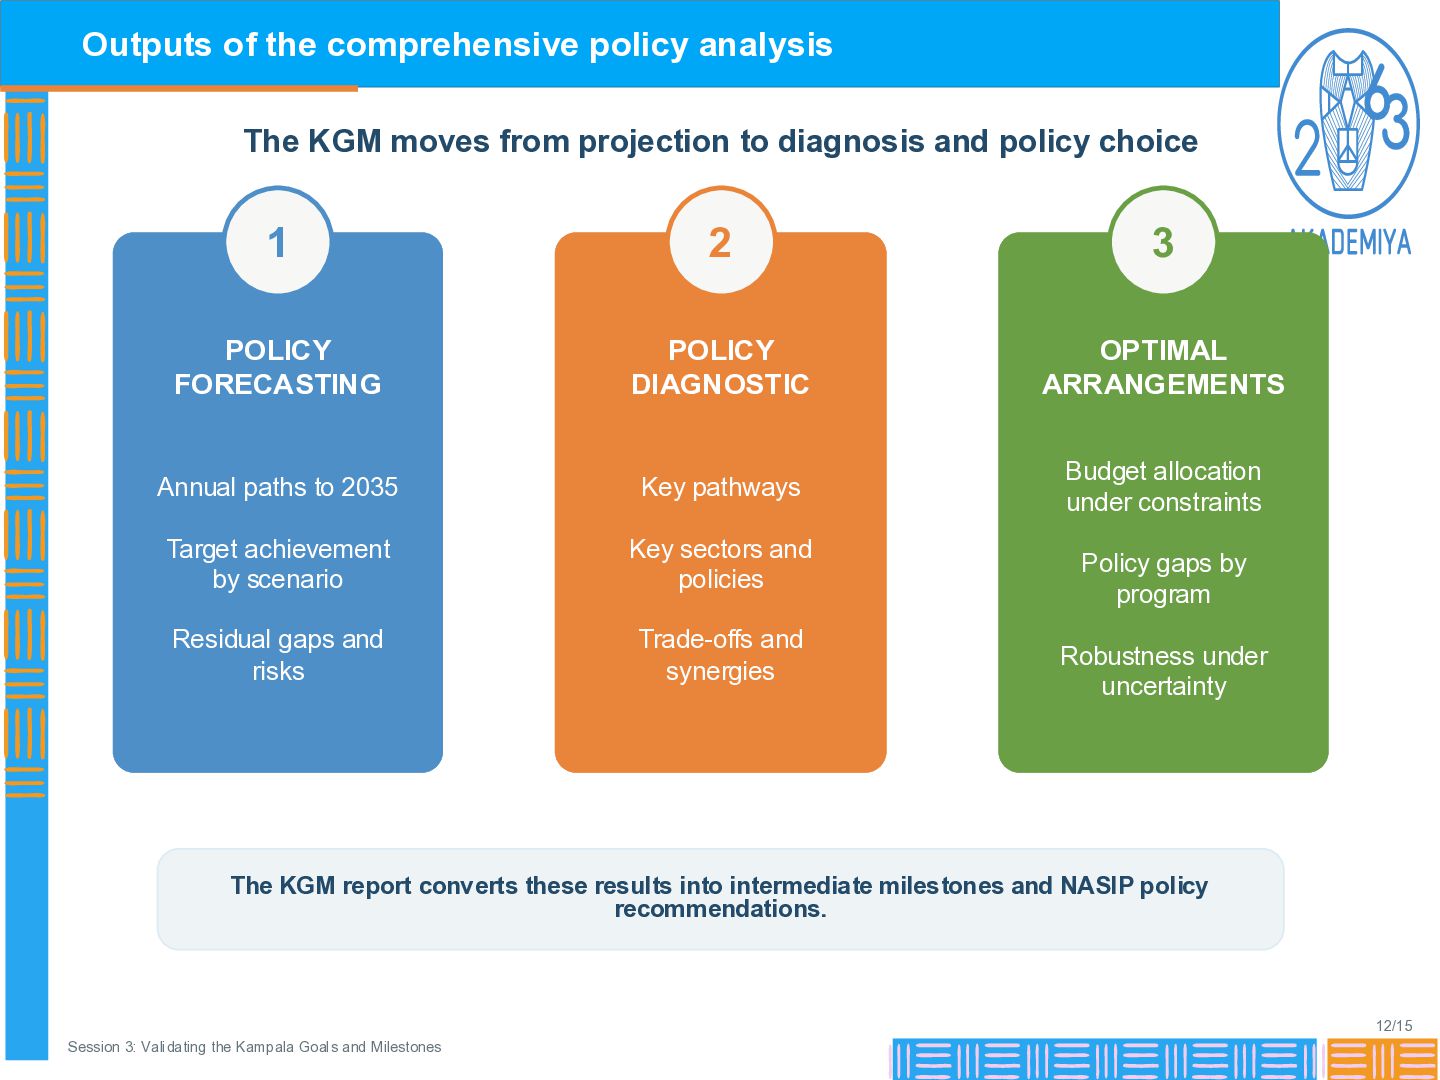
projection to diagnosis and policy choice 1 2 3 POLICY FORECASTING POLICY DIAGNOSTIC OPTIMAL ARRANGEMENTS Annual paths to 2035 Key pathways Budget allocation under constraints Target achievement by scenario Key sectors and policies Residual gaps and risks Trade-offs and synergies Policy gaps by program Robustness under uncertainty The KGM report converts these results into intermediate milestones and NASIP policy recommendations. 12/15 Session 3: Validating the Kampala Goals and Milestones
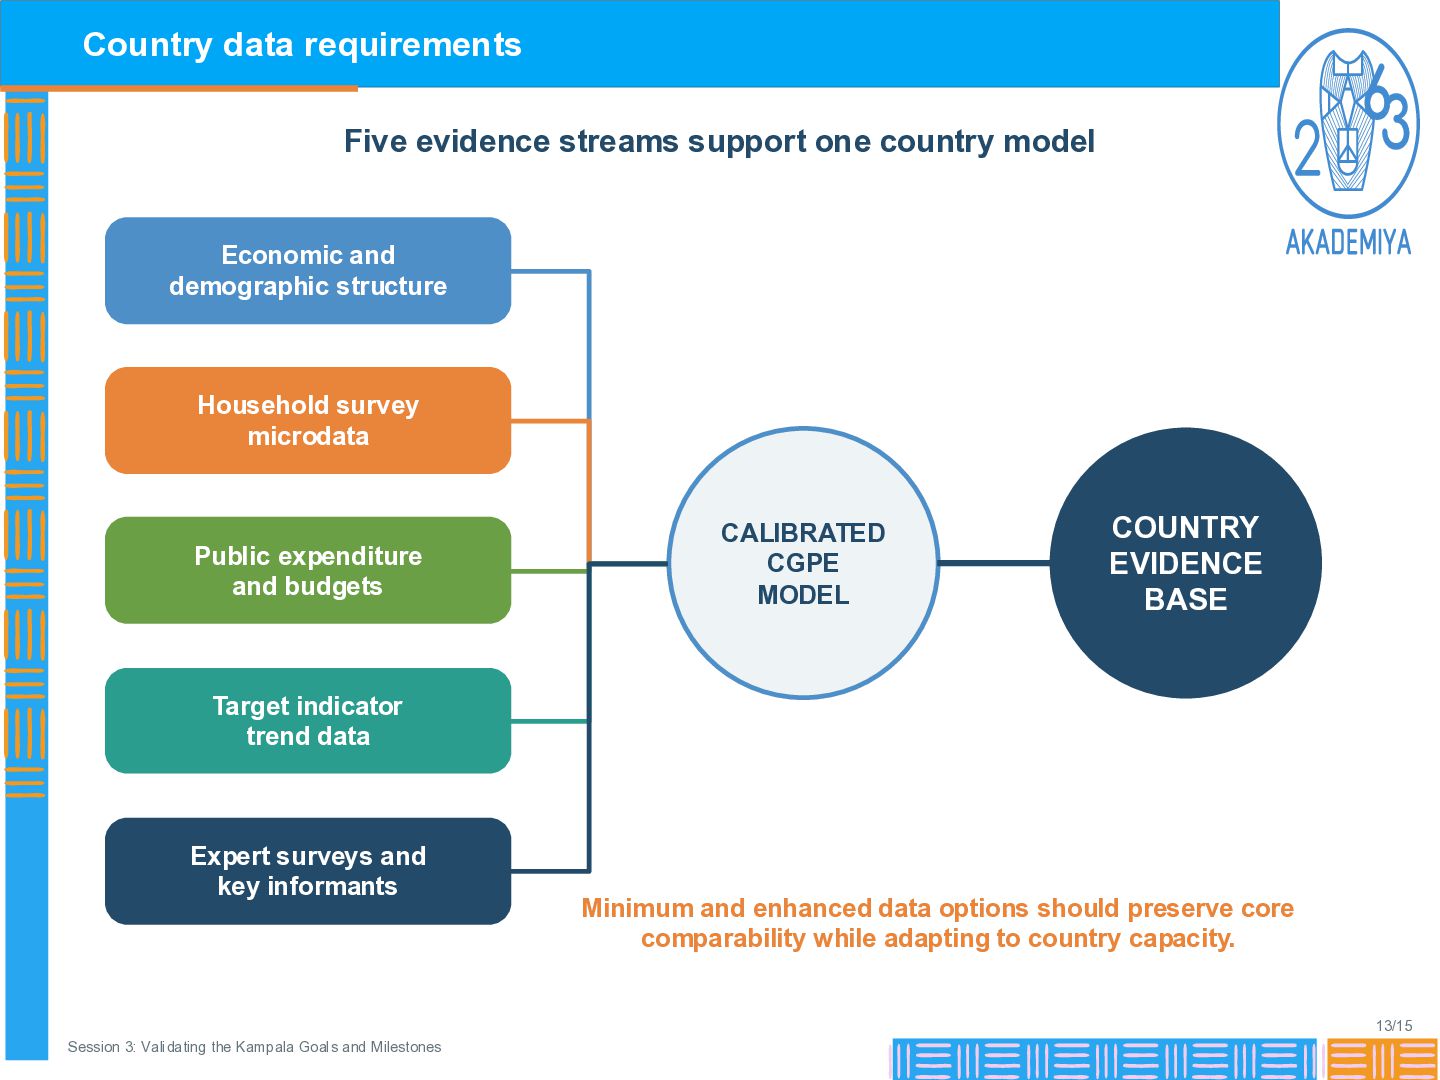
Economic and demographic structure Household survey microdata Public expenditure and budgets CALIBRATED CGPE MODEL COUNTRY EVIDENCE BASE Target indicator trend data Expert surveys and key informants Minimum and enhanced data options should preserve core comparability while adapting to country capacity. 13/15 Session 3: Validating the Kampala Goals and Milestones
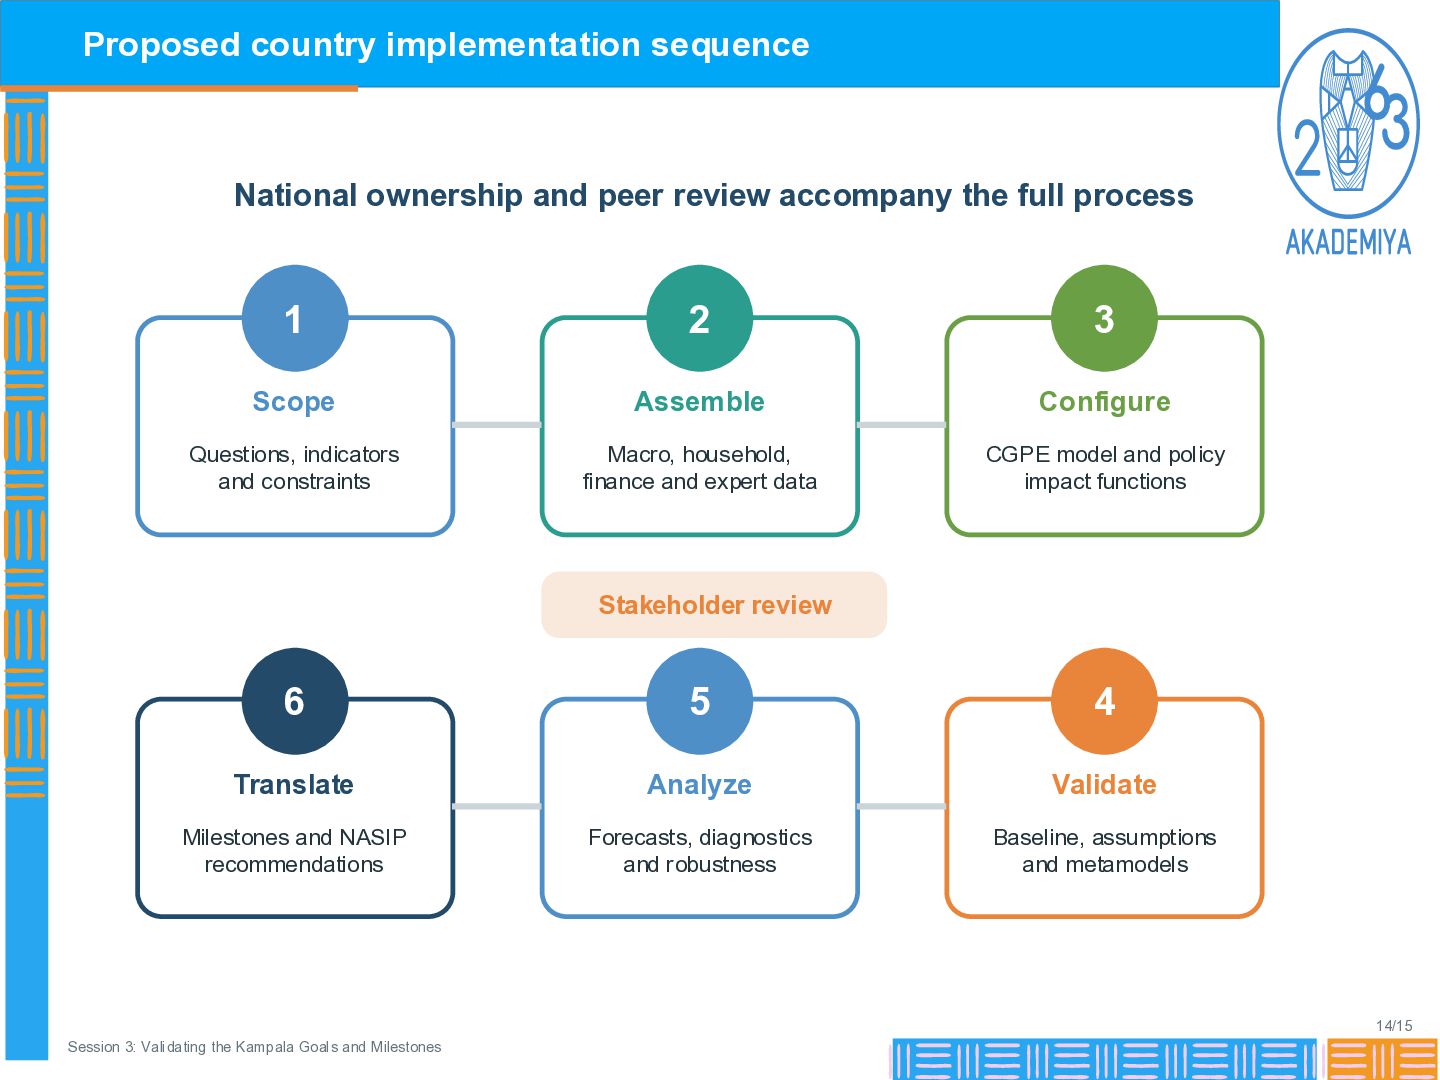
the full process 1 2 3 Scope Assemble Configure Questions, indicators and constraints Macro, household, finance and expert data CGPE model and policy impact functions Stakeholder review 6 5 4 Translate Analyze Validate Milestones and NASIP recommendations Forecasts, diagnostics and robustness Baseline, assumptions and metamodels 14/15 Session 3: Validating the Kampala Goals and Milestones
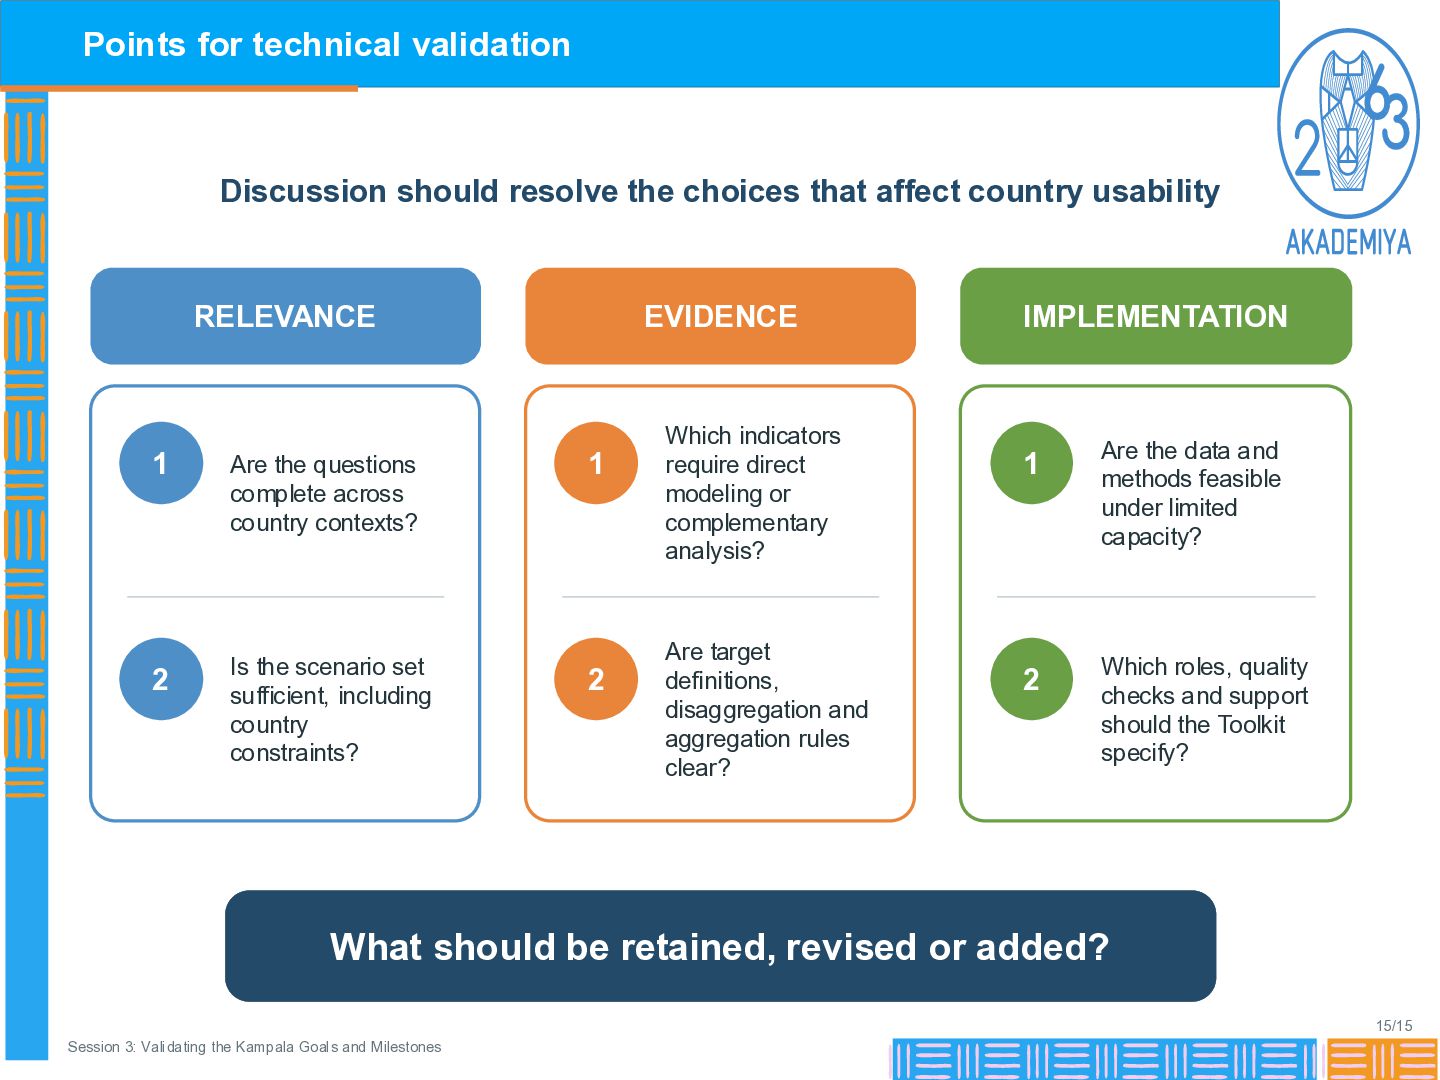
affect country usability RELEVANCE 1 Are the questions complete across country contexts? 2 Is the scenario set sufficient, including country constraints? EVIDENCE 1 2 Which indicators require direct modeling or complementary analysis? Are target definitions, disaggregation and aggregation rules clear? IMPLEMENTATION 1 Are the data and methods feasible under limited capacity? 2 Which roles, quality checks and support should the Toolkit specify? What should be retained, revised or added? 15/15 Session 3: Validating the Kampala Goals and Milestones


 akademiya2063
 naok615
 eumesy
 fkske
fkske
 rikkabotan7
 koide3
 datascientistsociety
 mickey_0226
 institutdelelevage
 yukiar
 takehaya
 enochan
 pman0214
 aarron
 bkeepers
 kimpetersen
 honzajavorek
 akashhashmi
 watany
 ryanjones
 eileencodes
 deanohume
 sergeychernyshev
 nmsamuel
 palkan