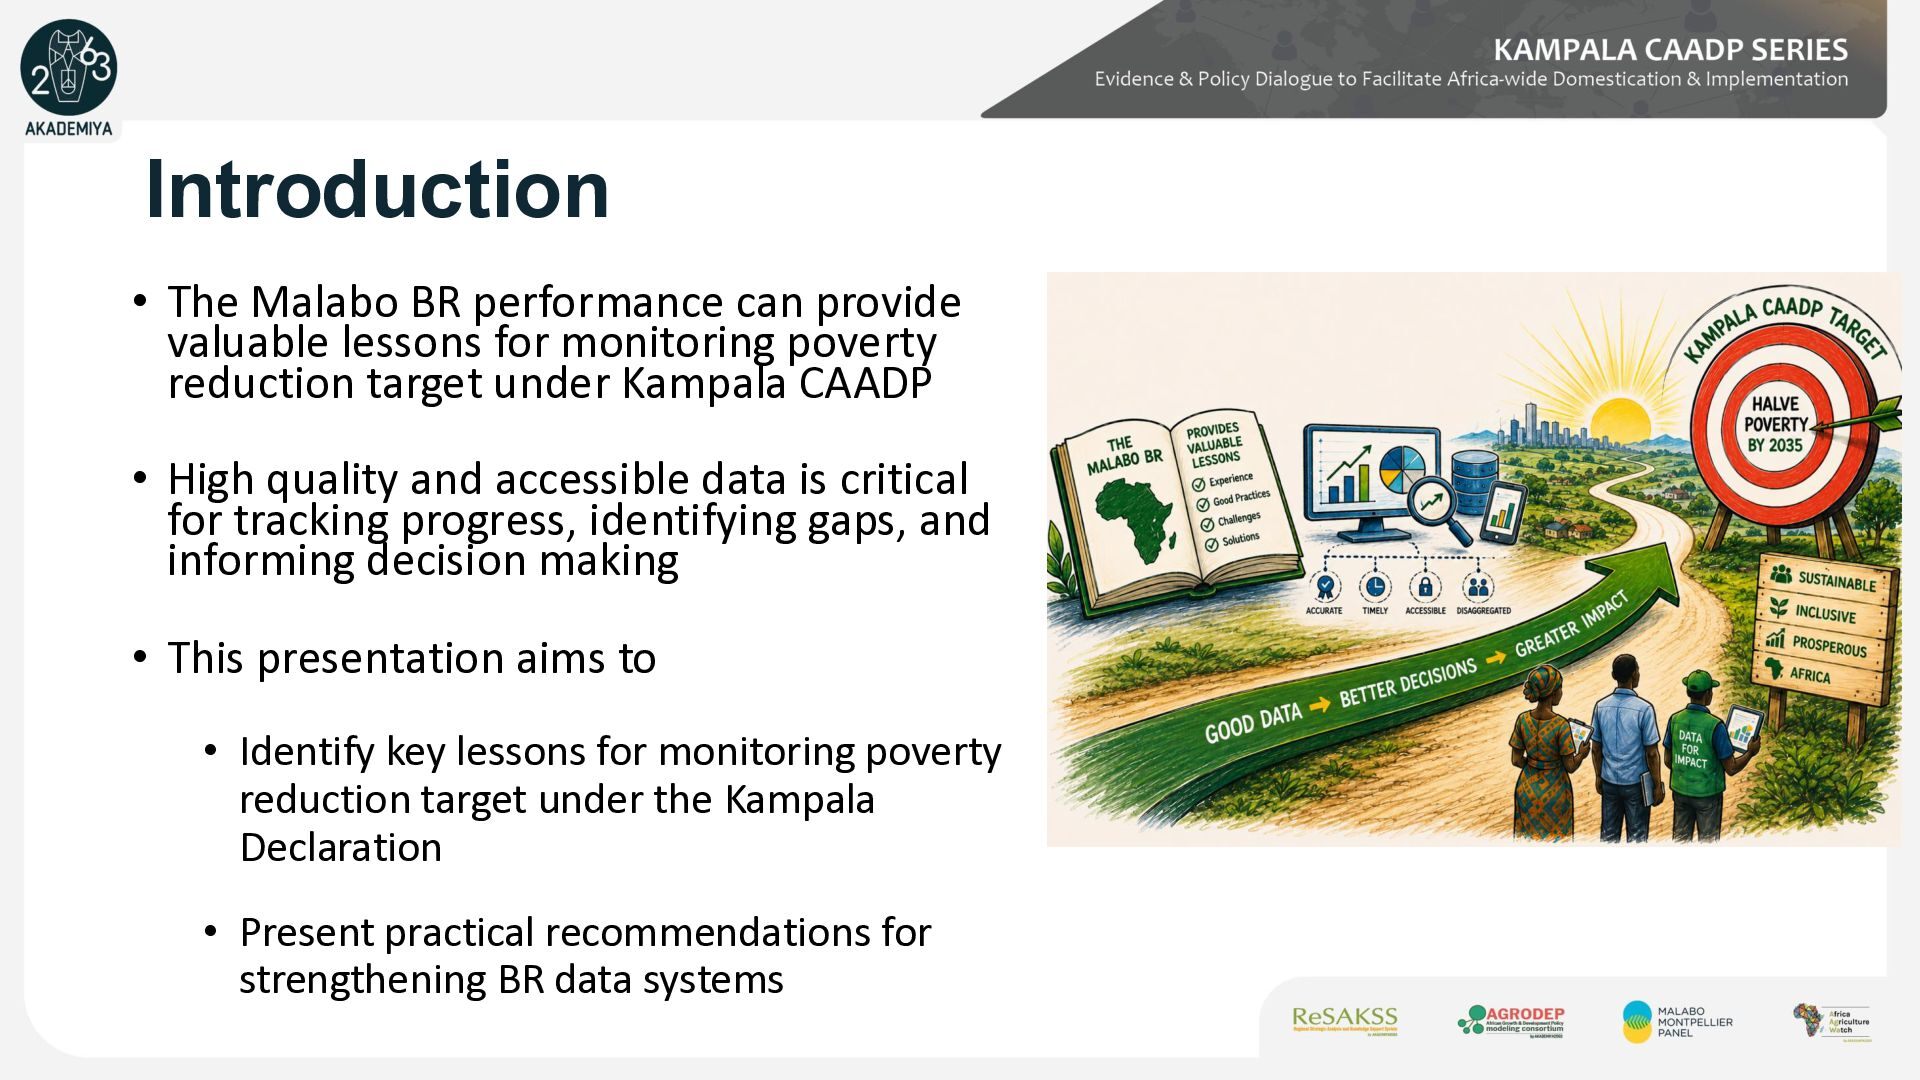
KAMPALA CAADP SERIES Introduction • The Malabo BR performance can provide valuable lessons for monitoring poverty reduction target under Kampala CAADP • High quality and accessible data is critical for tracking progress, identifying gaps, and informing decision making • This presentation aims to • Identify key lessons for monitoring poverty reduction target under the Kampala Declaration • Present practical recommendations for strengthening BR data systems
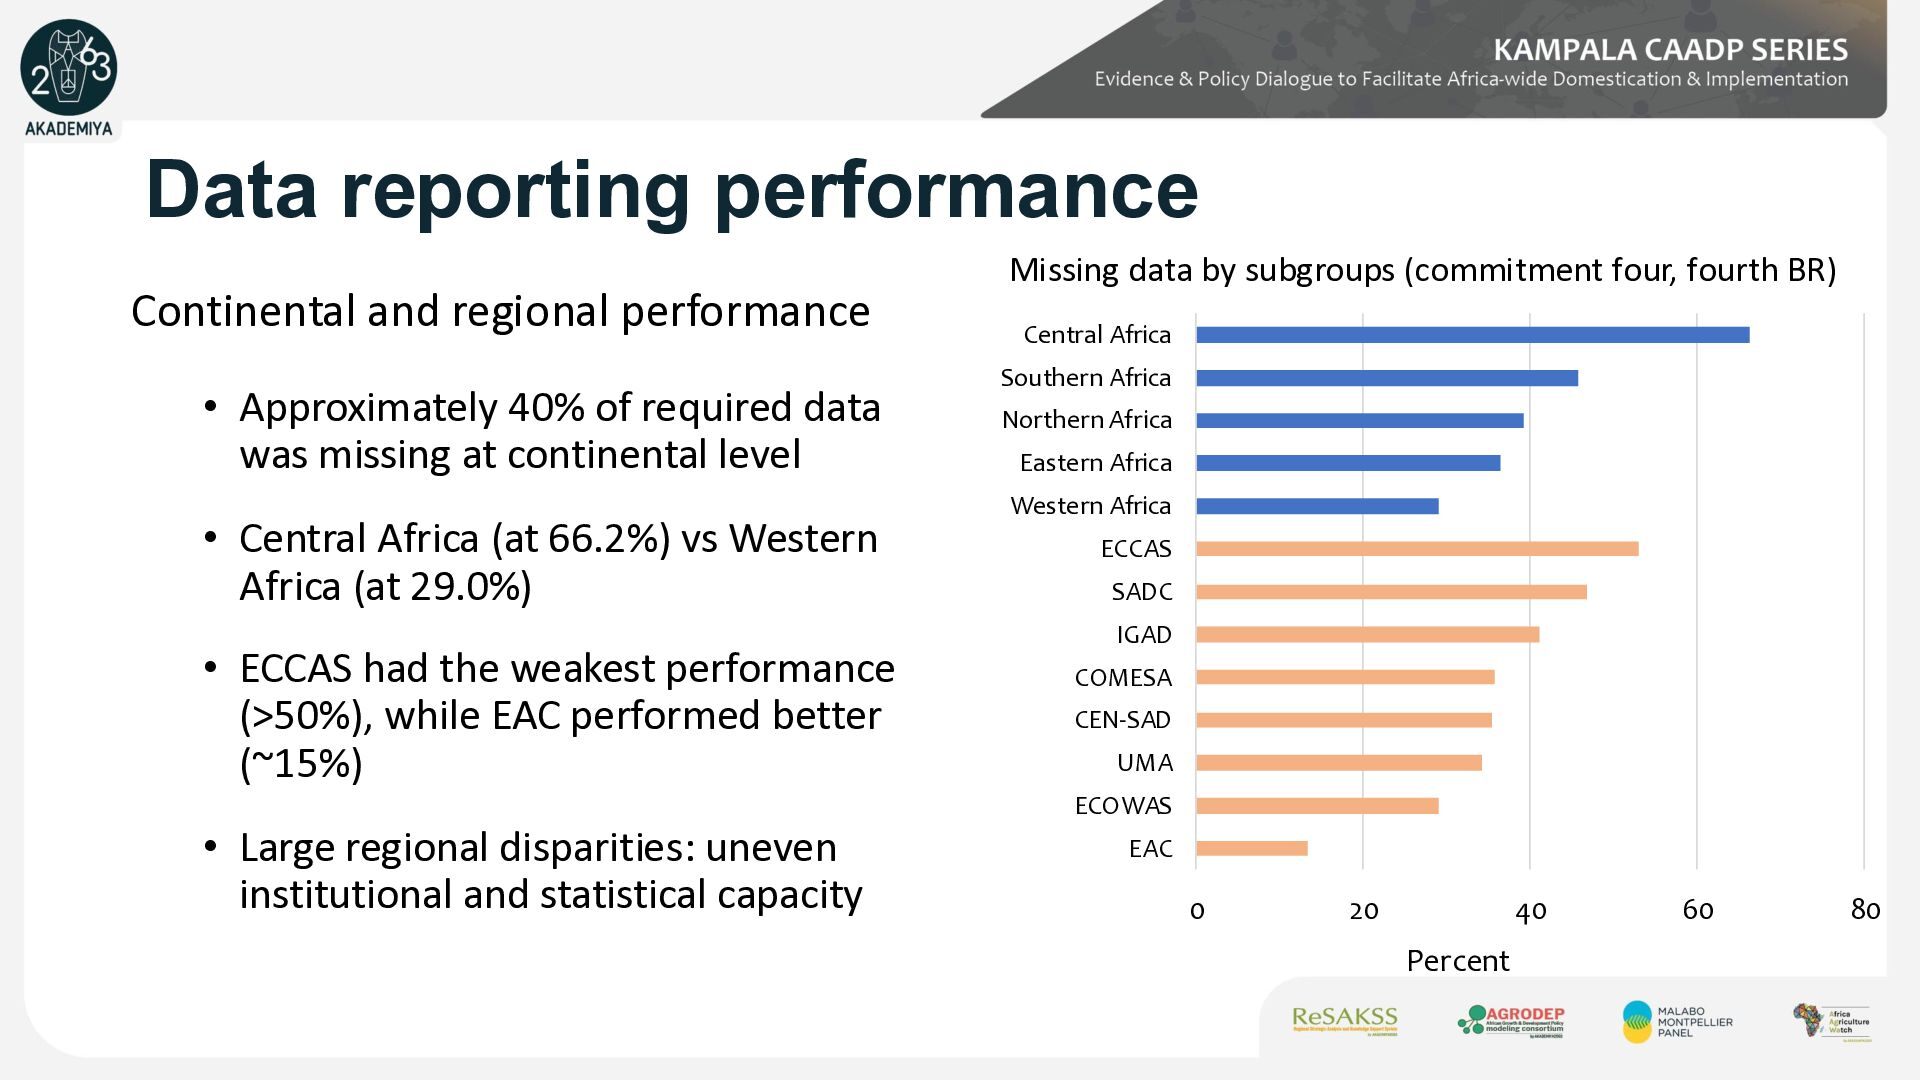
KAMPALA CAADP SERIES Data reporting performance Continental and regional performance • Approximately 40% of required data was missing at continental level • Central Africa (at 66.2%) vs Western Africa (at 29.0%) • ECCAS had the weakest performance (>50%), while EAC performed better (~15%) • Large regional disparities: uneven institutional and statistical capacity 0 20 40 60 80 EAC ECOWAS UMA CEN-SAD COMESA IGAD SADC ECCAS Western Africa Eastern Africa Northern Africa Southern Africa Central Africa Percent Missing data by subgroups (commitment four, fourth BR)
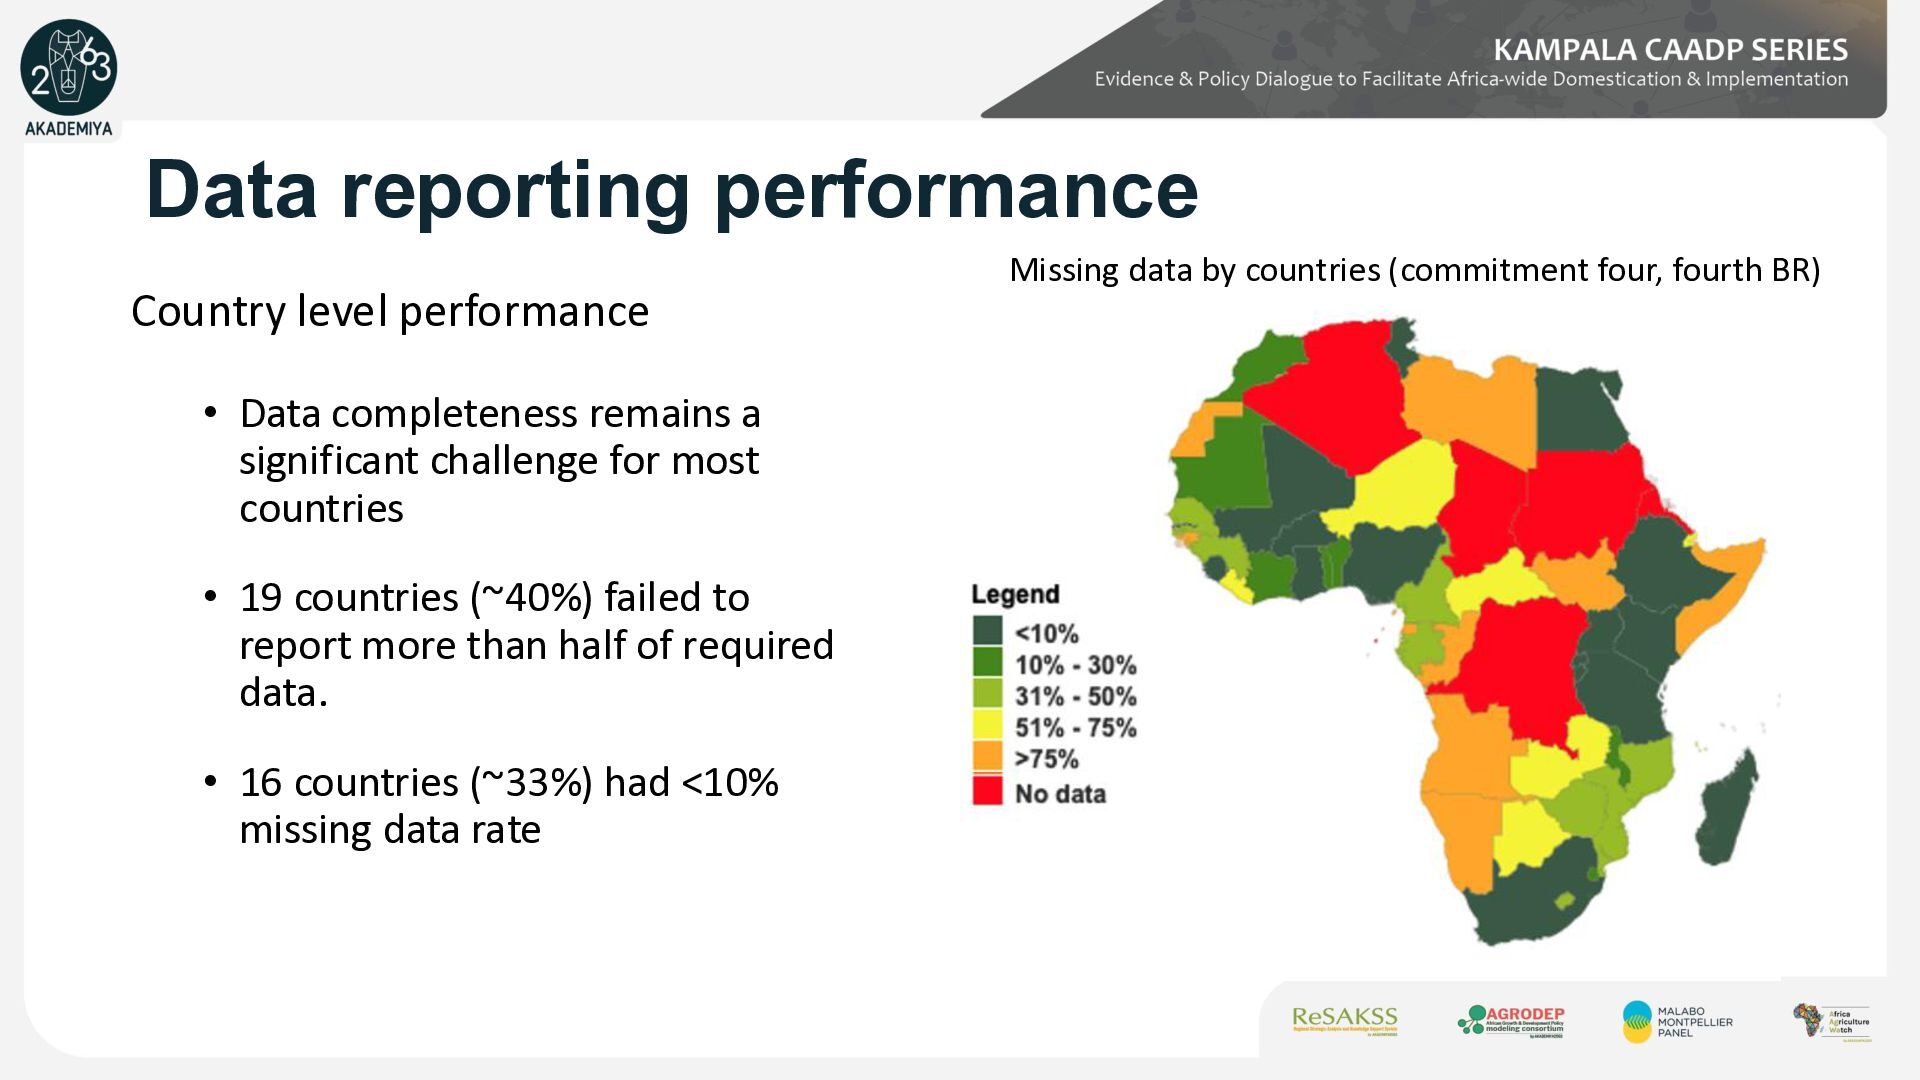
KAMPALA CAADP SERIES Data reporting performance Country level performance • Data completeness remains a significant challenge for most countries • 19 countries (~40%) failed to report more than half of required data. • 16 countries (~33%) had <10% missing data rate Missing data by countries (commitment four, fourth BR)
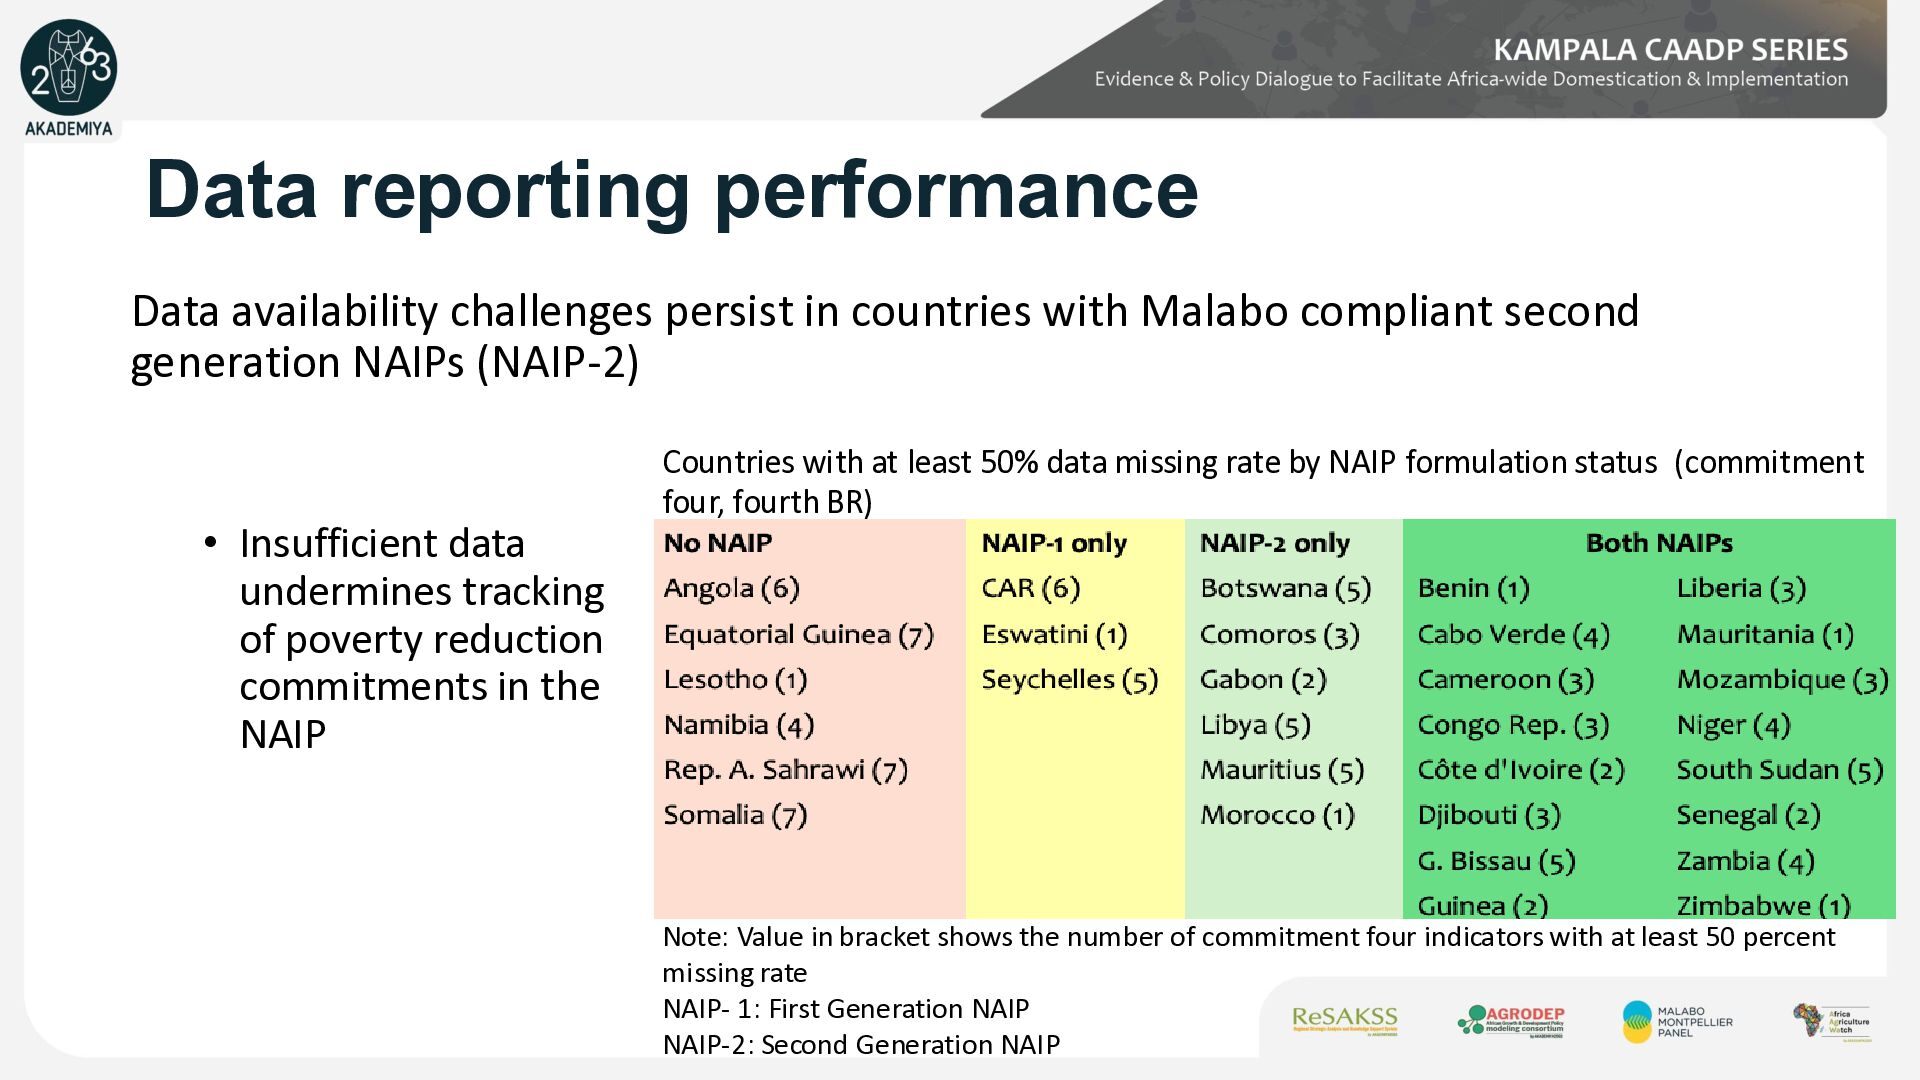
KAMPALA CAADP SERIES Data reporting performance Data availability challenges persist in countries with Malabo compliant second generation NAIPs (NAIP-2) Countries with at least 50% data missing rate by NAIP formulation status (commitment four, fourth BR) • Insufficient data undermines tracking of poverty reduction commitments in the NAIP Note: Value in bracket shows the number of commitment four indicators with at least 50 percent missing rate NAIP- 1: First Generation NAIP NAIP-2: Second Generation NAIP
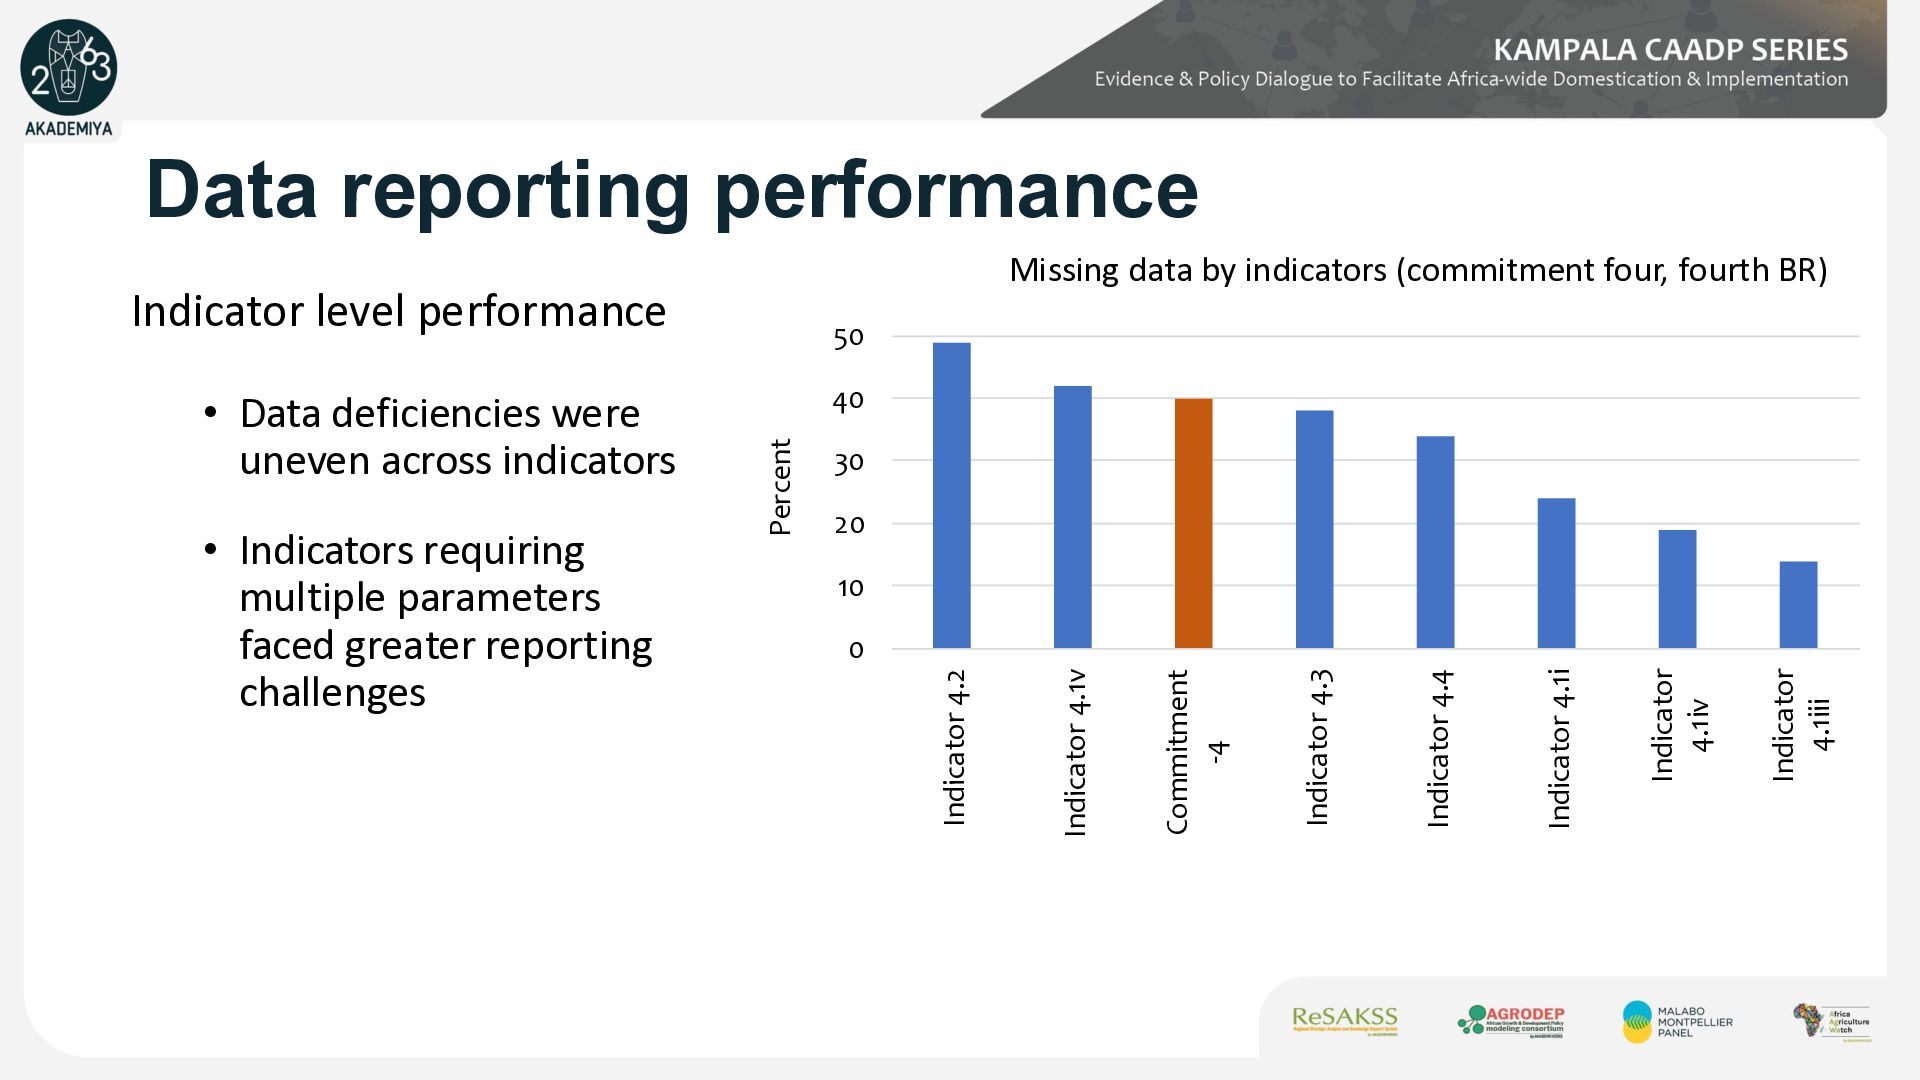
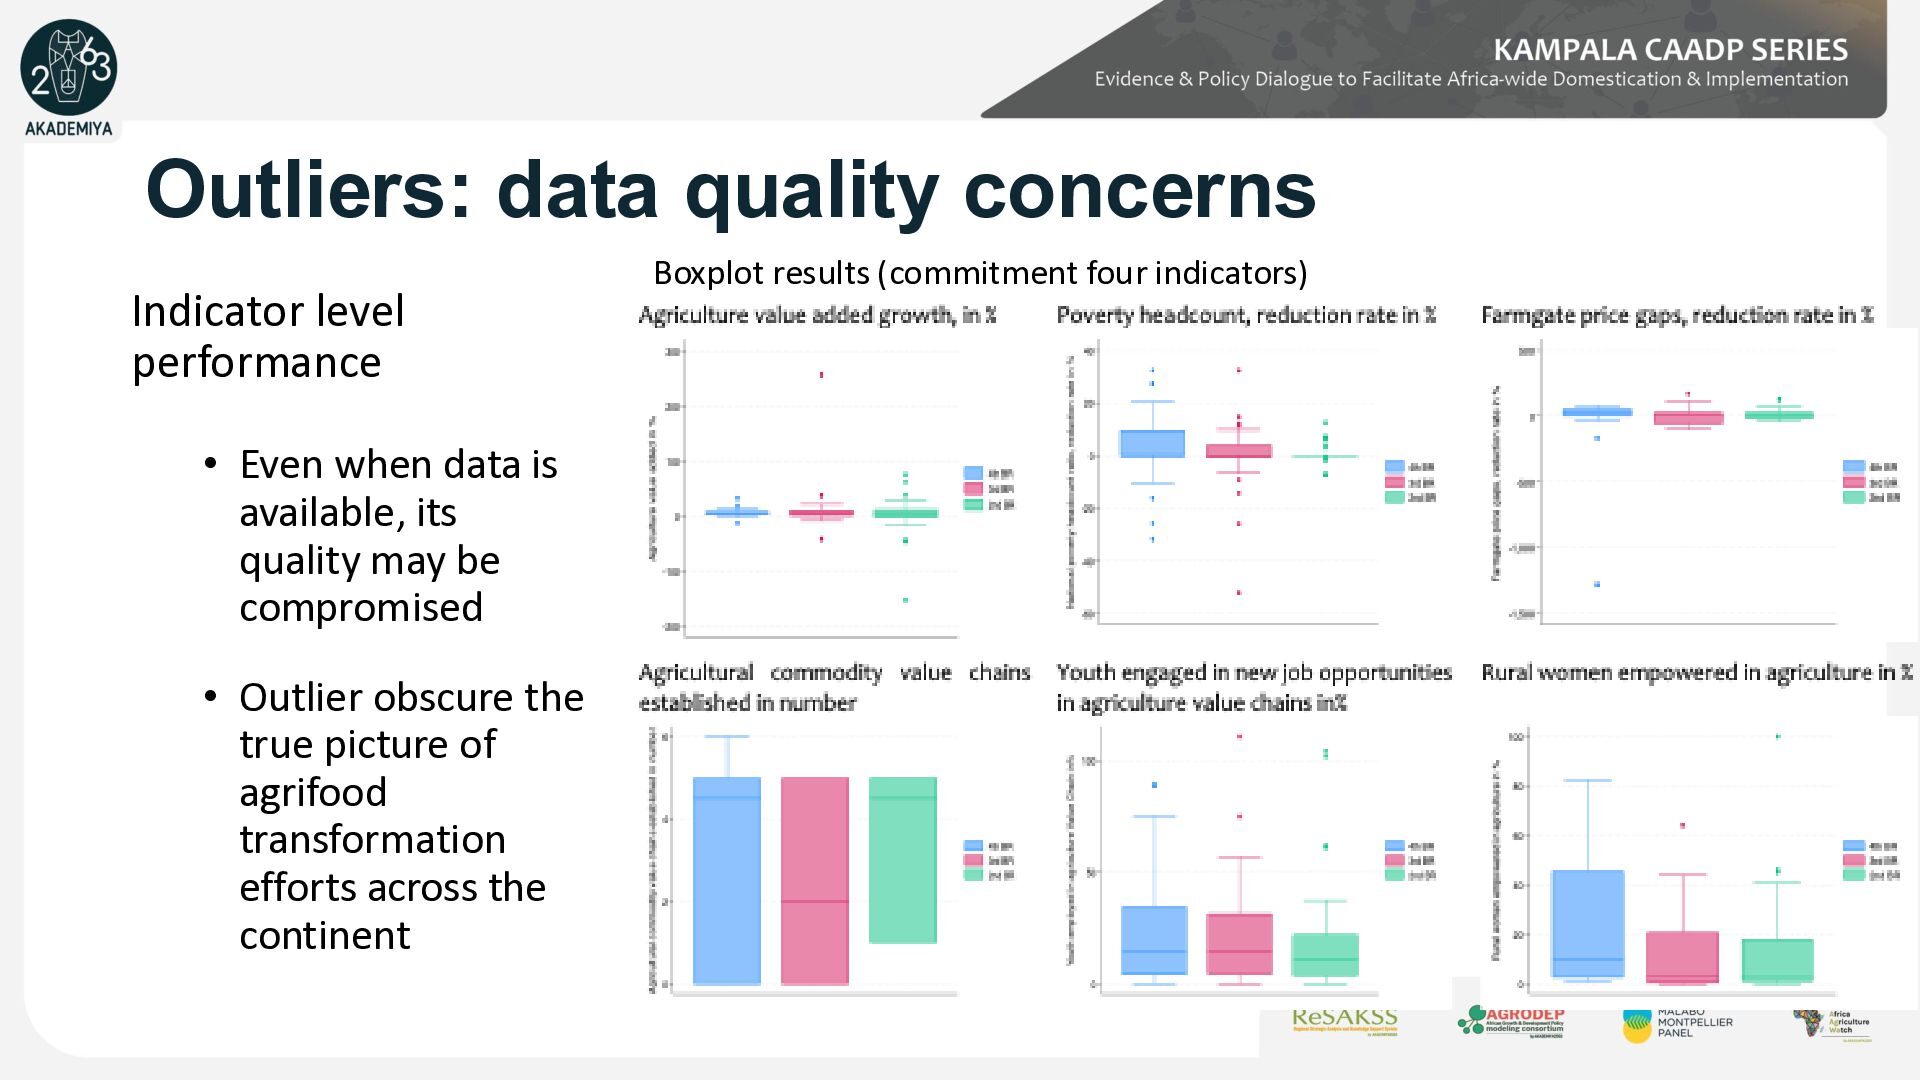
KAMPALA CAADP SERIES Outliers: data quality concerns Indicator level performance • Even when data is available, its quality may be compromised • Outlier obscure the true picture of agrifood transformation efforts across the continent Boxplot results (commitment four indicators)
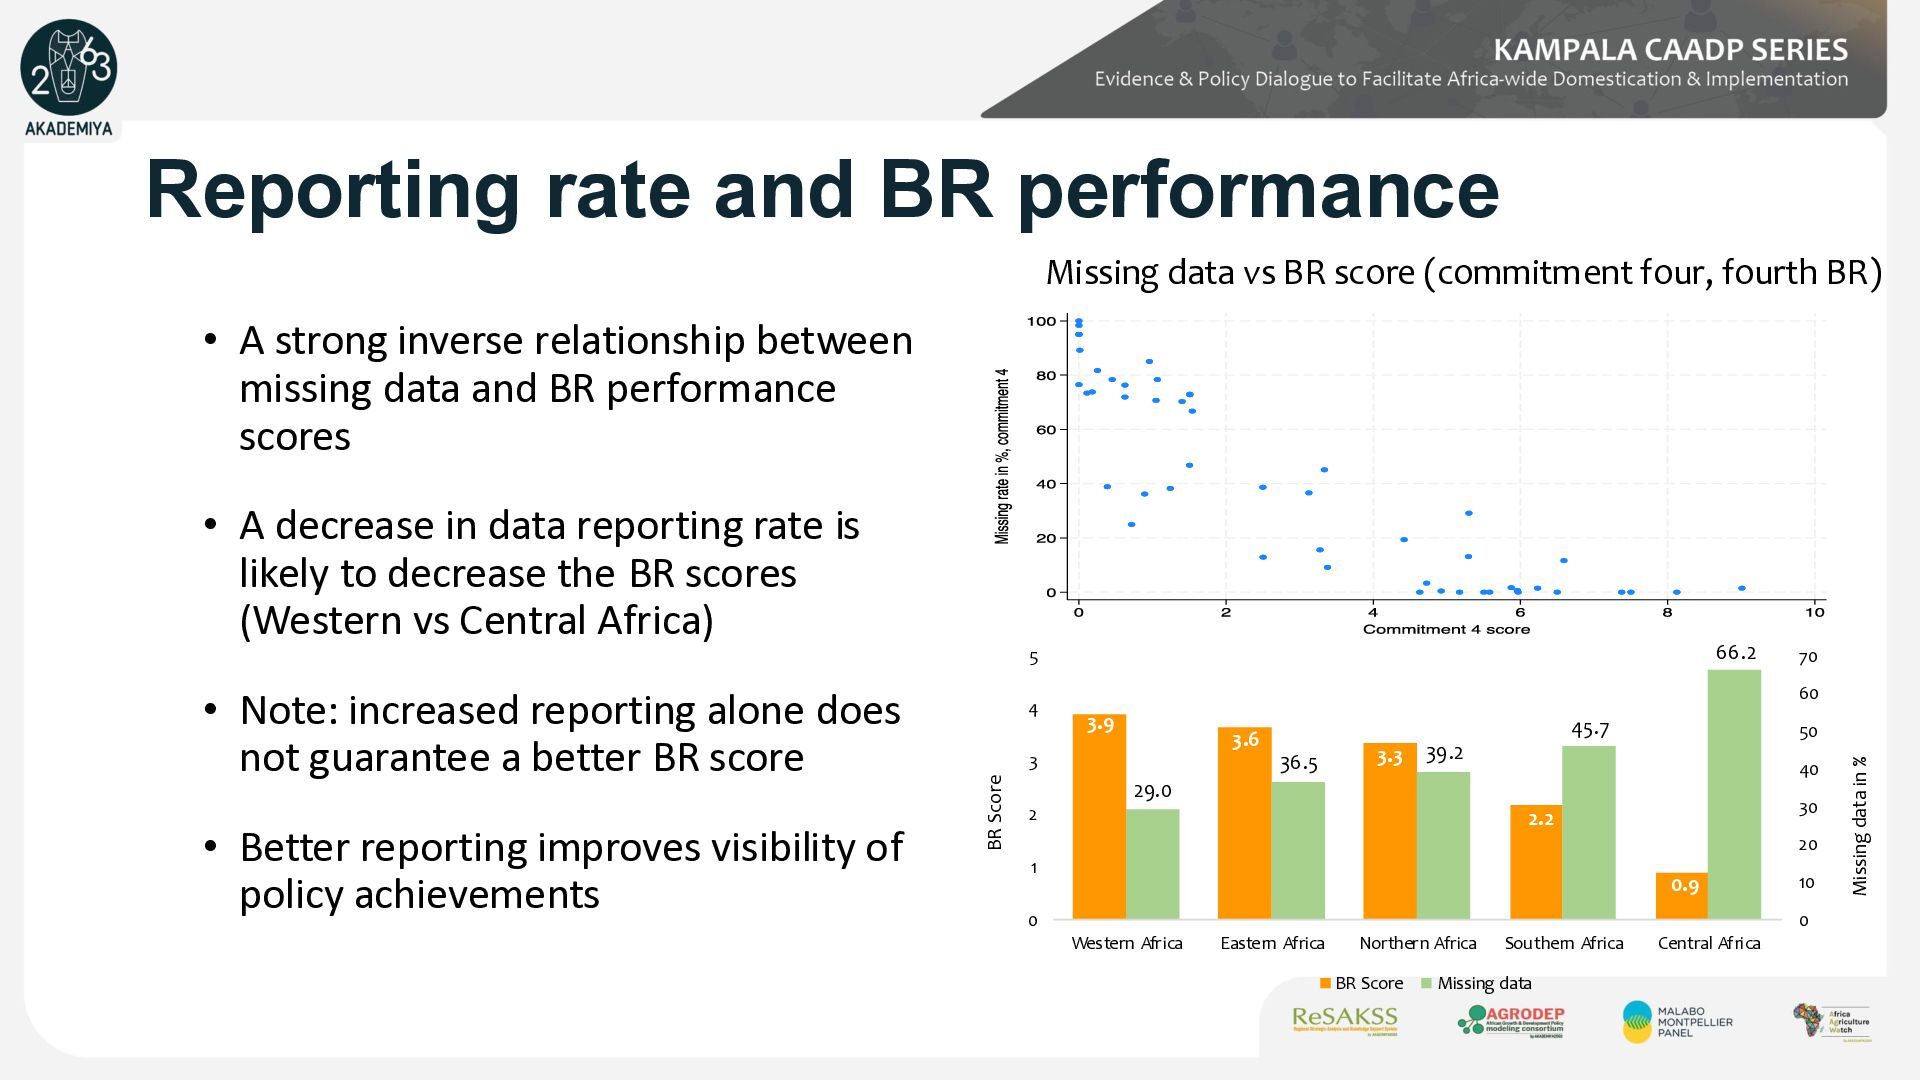
KAMPALA CAADP SERIES Reporting rate and BR performance • A strong inverse relationship between missing data and BR performance scores • A decrease in data reporting rate is likely to decrease the BR scores (Western vs Central Africa) • Note: increased reporting alone does not guarantee a better BR score • Better reporting improves visibility of policy achievements Missing data vs BR score (commitment four, fourth BR) 3.9 3.6 3.3 2.2 0.9 29.0 36.5 39.2 45.7 66.2 0 10 20 30 40 50 60 70 0 1 2 3 4 5 Western Africa Eastern Africa Northern Africa Southern Africa Central Africa Missing data in % BR Score BR Score Missing data
KAMPALA CAADP SERIES Summary and implications for Kampala Summary: Data gaps weaken effective MEL of CAADP implementation • Data reporting remains a major challenge limiting the ability to accurately track progress toward poverty reduction targets • Data quality concerns persist which can compromise the reliability and credibility of performance assessments • Data gaps limit visibility of policy achievements
KAMPALA CAADP SERIES Summary and implications for Kampala • Establish and operationalize commitment specific data clusters • Build technical capacity of data providers through regular and targeted training • Provide continuous technical backstopping throughout the BR process Implications for Kampala: Strengthening national statistical systems is as critical as strengthening policies and investments to achieve Kampala CAADP targets • Explore innovative solutions to address missing data and outlier challenges