Upgrade to Pro — share decks privately, control downloads, hide ads and more …

GEOG 315, GIS Programming, Fall 2020; Lecture 9

alan.kasprak
October 23, 2020
50

GEOG 315, GIS Programming, Fall 2020; Lecture 9

alan.kasprak

October 23, 2020
Tweet

Transcript

  1. For today… GEOG 315: GIS Programming and Web Mapping Lecture

    9 – Raster Geoprocessing 1. A review of the SearchCursor homework from Week 8 2. An introduction to raster data and geoprocessing, this week’s topic
  2. What’s a Raster? [our practical definition] A raster is a

    regularly spaced grid of cells, or pixels. -Me Raster data models define space as discrete cells, in which each cell has a value associated with it that represents certain characteristics of that area. - Bolstad, GIS Fundamentals
  3. But wait, there’s more! In Intro GIS, you might have

    discussed two data types, raster and vector What’s the difference? Rasters represent the world as a continuous grid of cells Vectors represent the world as points, lines, and polygons [we’ve been working with these!]
  4. Is this a raster or vector data model? Rasters represent

    the world as a continuous grid of cells Vectors represent the world as points, lines, and polygons You’ll get really good at doing this quickly, but the most intuitive way? Just zoom in. Vectors are discrete points or connected points, so they’ll always be sharp Rasters are pixels of a given size, so they’ll get “pixelated” or blurry up close. Shutterstock Adobe
  5. Cool, then why not always just use vectors? And often,

    rasters just make more sense to answer certain questions. How big is the patch of pine forest in the map? What if the house was twice as large? What’s the area of water in the map?
  6. Raster Considerations 1: Format Raster data come in many formats;

    here are a few you might see regularly JPEG (.jpg); developed by joint photographic experts group; your standard phone/camera format PDF (.pdf); can house either raster or vector data, so be careful here!; used for many old topo maps PNG (.png); ‘portable network graphics’; low file sizes, used for many web images IMG (.img) TIFF (.tif); ‘tagged image file format’; many air photos and elevation rasters ESRI GRID (no extension); beware of many file name constraints TEXT BASED RASTERS (.asc, .txt); useful for data storage, human-readable, but require some pre-processing for display and often aren’t georeferenced
  7. Raster Considerations 2: Resolution Raster resolution is a delicate balancing

    act between the information you want to convey and the size (and processing time) of the file you’re dealing with.
  8. Raster Considerations 2: Resolution Raster resolution is a delicate balancing

    act between the information you want to convey and the size (and processing time) of the file you’re dealing with. “1 m resolution” “0.5 m resolution” 1 m 1 m 1 m 1 m To DOUBLE the resolution, we have to QUADRUPLE the cells So be very careful, because files can get really big, really fast.
  9. Raster Considerations 3: Data Type Discrete (or thematic, or categorical)

    rasters divide the world into a number of categories, which are assigned different symbologies
  10. Raster Considerations 3: Data Type Continuous (or field, or surface)

    rasters display a continuous gradient of information across a color ramp
  11. The information held in each cell, and its precision, varies

    between different raster types. What might a cell’s value be in each of these rasters? Raster Considerations 3: Data Type
  12. The information held in each cell, and its precision, varies

    between different raster types. What might a cell’s value be in each of these rasters? Value = 921.24 m Raster Considerations 3: Data Type
  13. The information held in each cell, and its precision, varies

    between different raster types. What might a cell’s value be in each of these rasters? Value = 921.24 m Raster Considerations 3: Data Type
  14. The information held in each cell, and its precision, varies

    between different raster types. What might a cell’s value be in each of these rasters? Value = 921.24 m Value = ‘Mixed Forest’ or Value = 22 Raster Considerations 3: Data Type
  15. The information held in each cell, and its precision, varies

    between different raster types. What might a cell’s value be in each of these rasters? Value = 921.24 m Value = ‘Mixed Forest’ or Value = 22 Raster Considerations 3: Data Type
  16. The information held in each cell, and its precision, varies

    between different raster types. What might a cell’s value be in each of these rasters? Value = 921.24 m Value = ‘Mixed Forest’ or Value = 22 Value = 1 or 0 (stream or not stream) Raster Considerations 3: Data Type
  17. BIT DEPTH CELL RESOLUTION Number of memory bits used to

    store color data for each pixel in a raster image All pixels require the same number of bits The number of bits determines the range of colors the image may have The dimension of the cell size representing the area covered on the ground Resolution is constant across a raster (with very few exceptions) Resolution balances the size of features that can be represented with file size, processing time “A 32-bit integer raster” “A 5-meter resolution raster” Raster Considerations 4: Bit Depth
  18. BIT DEPTH What’s a bit? …much like a “bit” of

    salt, it’s a really small amount. Bit: short for ‘binary digit’: the smallest unit of measurement used to quantify computer data. It contains a single value, either 1 or 0 (or true/false, or +/-, or on/off. 0 0 1 0 1 0 0 0 0 1 0 0 1 0 …is 14 bits of information.
  19. BIT DEPTH What’s a bit? …much like a “bit” of

    salt, it’s a really small amount. Bit: short for ‘binary digit’: the smallest unit of measurement used to quantify computer data. It contains a single value, either 1 or 0 (or true/false, or +/-, or on/off. 0 0 1 0 1 0 0 0 0 1 0 0 1 0 …is 14 bits of information. The range of values that a raster file can store is determined by its “bit depth”
  20. BIT DEPTH The range of values that a raster file

    can store is determined by its “bit depth” How many values can we represent with: One bit? 0 or 1
  21. BIT DEPTH The range of values that a raster file

    can store is determined by its “bit depth” How many values can we represent with: One bit? 0 or 1 2 VALUES [ONE OR ZERO]
  22. BIT DEPTH The range of values that a raster file

    can store is determined by its “bit depth” How many values can we represent with: One bit? 0 or 1 Two bits? 2 VALUES [ONE OR ZERO]
  23. BIT DEPTH The range of values that a raster file

    can store is determined by its “bit depth” How many values can we represent with: One bit? 0 or 1 Two bits? 0,0 or 1,0 or 0,1 or 1,1 2 VALUES [ONE OR ZERO] 4 VALUES
  24. BIT DEPTH The range of values that a raster file

    can store is determined by its “bit depth” How many values can we represent with: One bit? 0 or 1 Two bits? 0,0 or 1,0 or 0,1 or 1,1 Three bits? 2 VALUES [ONE OR ZERO] 4 VALUES
  25. BIT DEPTH The range of values that a raster file

    can store is determined by its “bit depth” How many values can we represent with: One bit? 0 or 1 Two bits? 0,0 or 1,0 or 0,1 or 1,1 Three bits? 0,0,0 or 0,0,1 or 0,1,1 or 1,1,1 or 1,0,0 or 1,1,0 or 1,0,1 or 0,1,0 2 VALUES [ONE OR ZERO] 4 VALUES 8 VALUES
  26. BIT DEPTH The range of values that a raster file

    can store is determined by its “bit depth” 1 bit = 2 unique values 2 bits = 4 unique values 3 bits = 8 unique values The number of unique values = 2n where n is the bit depth of the data 4 bits = ? unique values 5 bits = ? unique values
  27. BIT DEPTH The range of values that a raster file

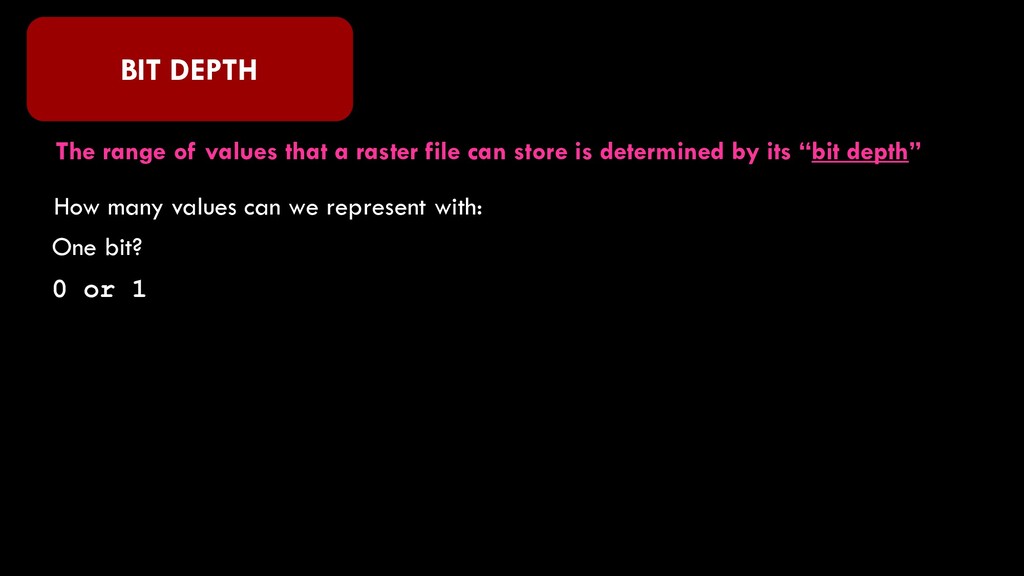
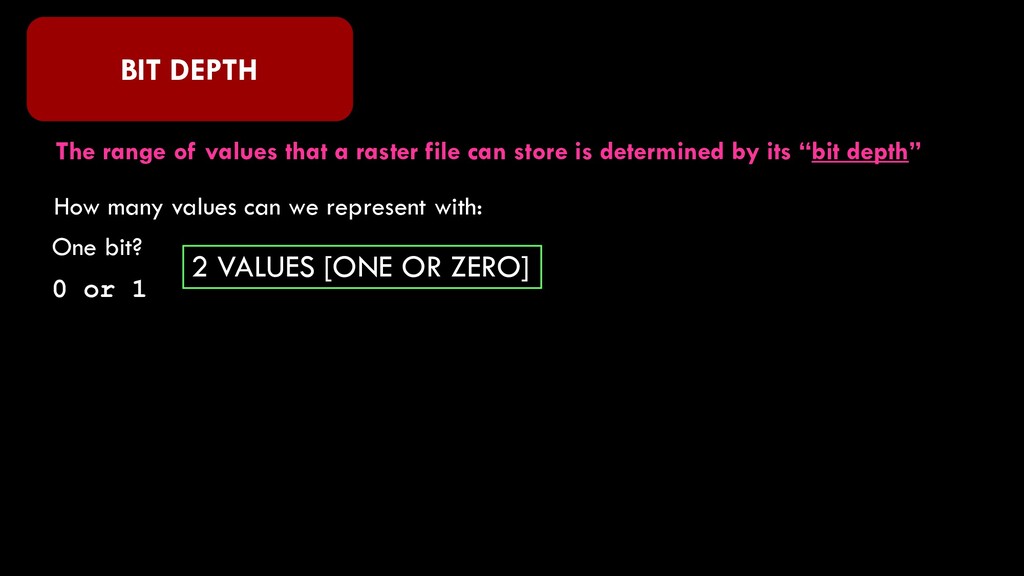
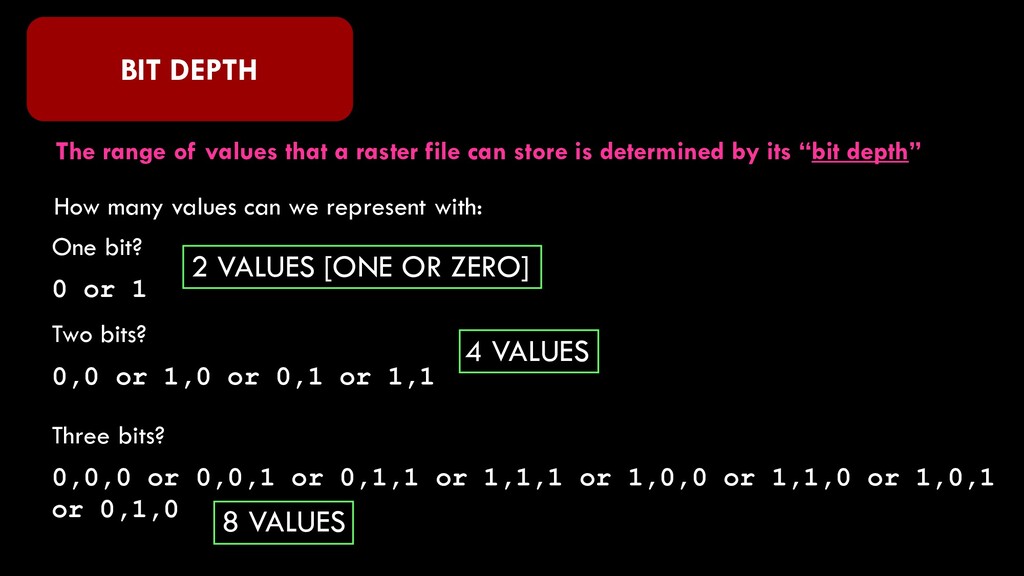
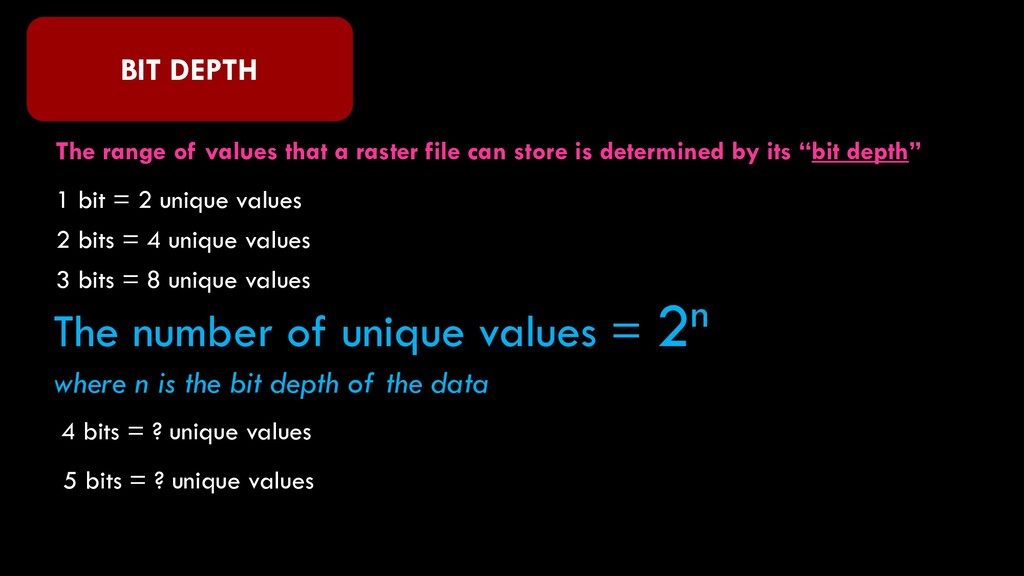
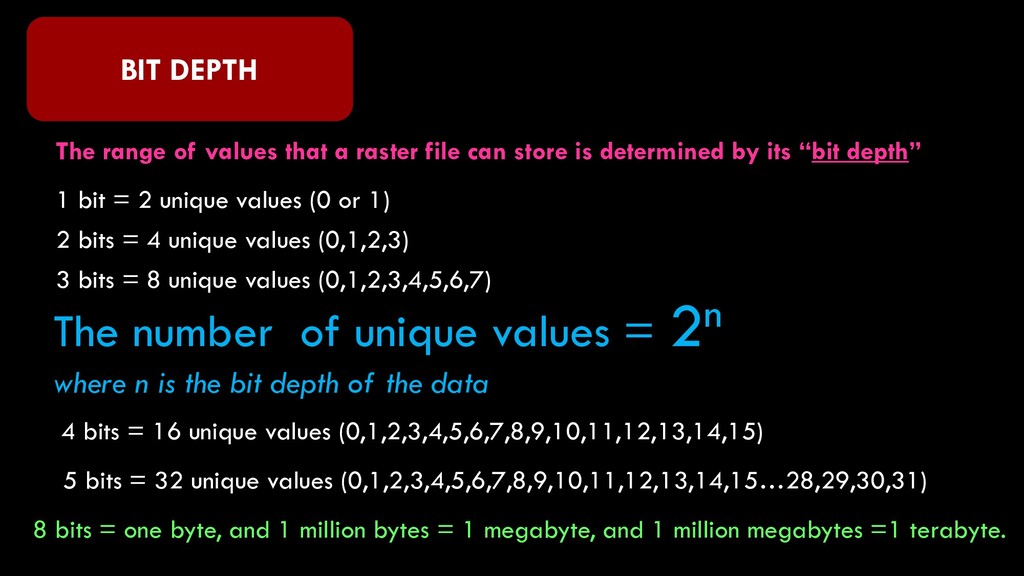
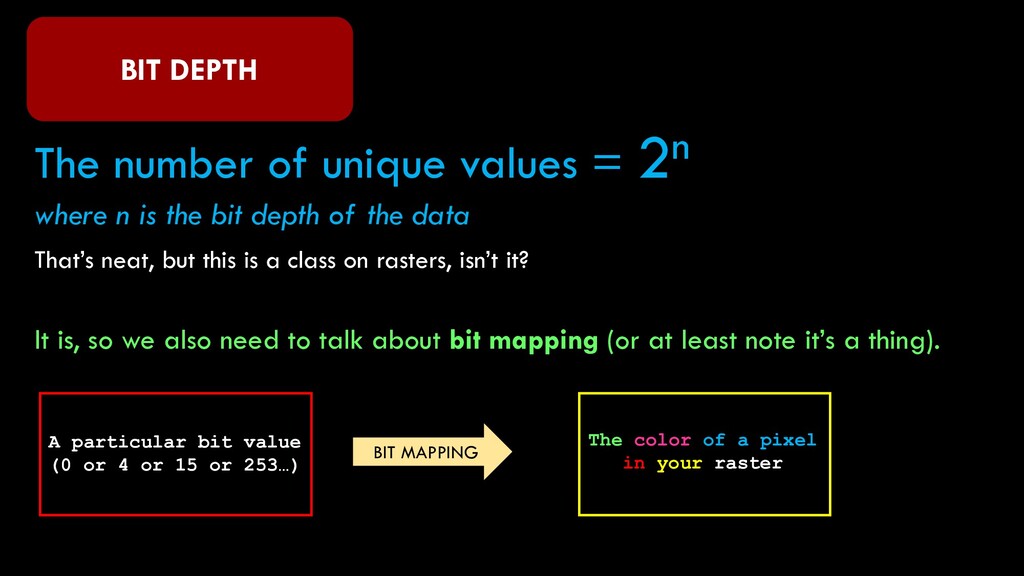
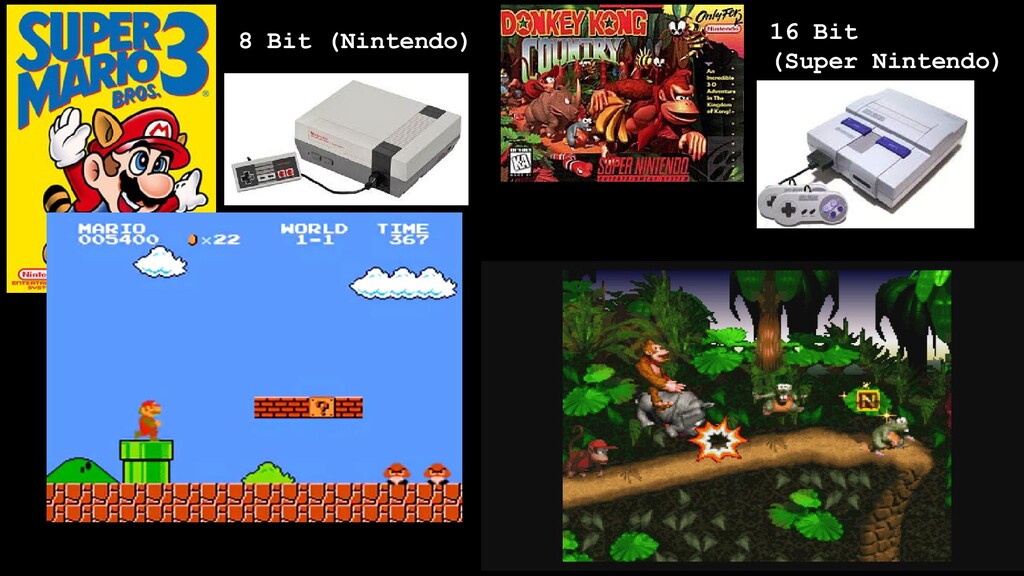
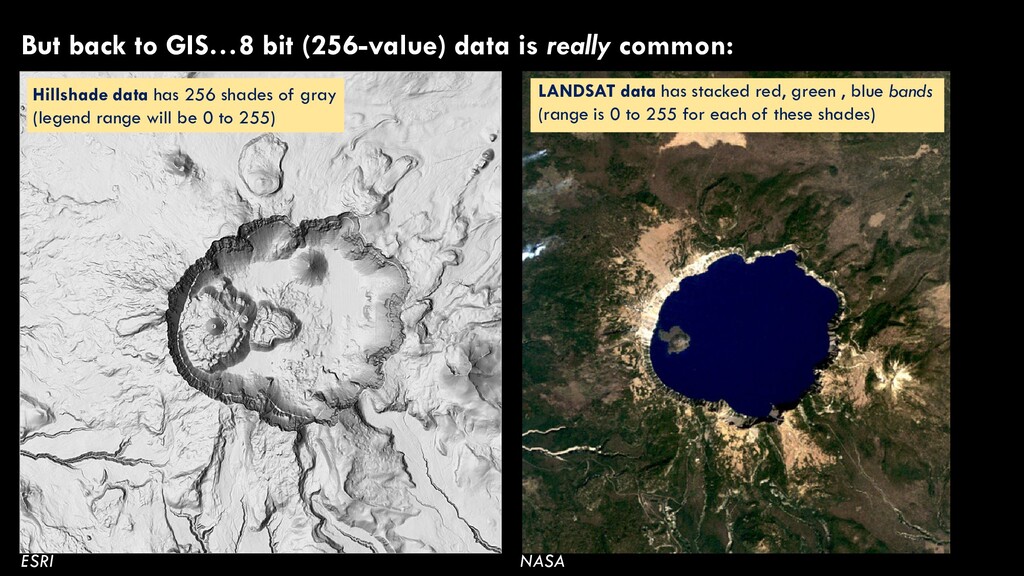
    can store is determined by its “bit depth” 1 bit = 2 unique values (0 or 1) 2 bits = 4 unique values (0,1,2,3) 3 bits = 8 unique values (0,1,2,3,4,5,6,7) The number of unique values = 2n where n is the bit depth of the data 4 bits = 16 unique values (0,1,2,3,4,5,6,7,8,9,10,11,12,13,14,15) 5 bits = 32 unique values (0,1,2,3,4,5,6,7,8,9,10,11,12,13,14,15…28,29,30,31) 8 bits = one byte, and 1 million bytes = 1 megabyte, and 1 million megabytes =1 terabyte.
  28. BIT DEPTH The number of unique values = 2n where

    n is the bit depth of the data That’s neat, but this is a class on rasters, isn’t it? It is, so we also need to talk about bit mapping (or at least note it’s a thing). A particular bit value (0 or 4 or 15 or 253…) The color of a pixel in your raster BIT MAPPING
  29. BIT DEPTH …and we also need to talk about the

    types of numbers. 1. INTEGERS are whole numbers, including zero 2. SIGNED INTEGERS are positive and negative whole numbers, including zero 3. FLOATING POINTS are numbers with decimal places 4. SIGNED FLOATING POINTS are positive and negative numbers with decimal places 1, 35, 0, 16, 4, 4872349876 -1, 35, 0, -16, -4, 4872349876 1.2, 45.5, 78.0, 8988972987.1, 23.0982340723987 1.2, 45.5, -78.0, 8988972987.1, -23.0982340723987
  30. But back to GIS…8 bit (256-value) data is really common:

    Hillshade data has 256 shades of gray (legend range will be 0 to 255) LANDSAT data has stacked red, green , blue bands (range is 0 to 255 for each of these shades) ESRI NASA
  31. USGS Digital Elevation Models are generally 32-bit floating point Basin

    and range province, near Elko, Nevada Raster Considerations 4: Bit Depth
  32. USGS Digital Elevation Models are generally 32-bit floating point Basin

    and range province, near Elko, Nevada Raster Considerations 4: Bit Depth
  33. Slide #43 81 59 2 65 35 50 53 73

    82 23 97 47 48 72 39 38 input raster operation [mean] output raster 53.6 neighborhood 2. Focal analyses A spatial/mathematical operation is performed on every single cell, individually, based on some pre-defined neighborhood Raster Considerations 5: Raster Math (specifically Focal Analysis)
  34. • Focal analysis tools • Focal Statistics • Two most

    important parameters: Neighborhood and Statistics type Slide #44 Raster Considerations 5: Raster Math (specifically Focal Analysis)
  35. • Focal analysis tools • Focal Statistics • Statistics type

    • Which of these statistics are primarily aimed at analyzing discrete raster data? • Majority, minority, variety • Which of these statistics are primarily aimed at analyzing continuous raster data? • Mean, maximum, median, minimum, range, standard deviation, sum Slide #45 Raster Considerations 5: Raster Math (specifically Focal Analysis)
  36. Focal Operations in ArcGIS • Focal analysis tools • Focal

    Statistics • Statistics type • Discrete statistics • Majority • Determines, within the defined neighborhood, what discrete cell value is most common • If a tie, then resulting value is NA Slide #46 G S S S F F W W S F G G G F F W W S F G G G S W W W S F S G G W W W F F S S G W W W G F F F S W W W G G F F S G W W G G S S F S W W W G S S F F W W W G S S S F F G G G G NA W W W W G G G G W W W W W G G G G W W W W W G G G G W W W W F NA G NA W W W W F F S W W W W W F F F W W W W W NA F F F W W W W W S NA F F W W W W S S S S F G grass S shrub F forest W water raw land cover dataset 5x5 rectangle majority filtered land cover dataset edge cell-inclusive edge cell-exclusive
  37. Focal Operations in ArcGIS • Focal analysis tools • Focal

    Statistics • Statistics type • Continuous statistics • Mean • Determines, within the defined neighborhood, the average of continuous cell values • Smooths out your data • e.g. removing artifacts from a bad DEM Slide #47 raw elevation dataset 5x5 rectangle elevation mean filter edge cell-inclusive edge cell-exclusive elevation (m) 26.3 30.1 27.0 28.1 28.1 28.2 29.1 29.2 29.7 29.7 30.1 26.6 27.4 28.1 28.5 29.1 29.9 29.6 29.3 29.6 27.0 27.5 27.6 28.3 29.3 29.2 29.0 28.4 29.1 27.7 28.4 28.7 29.3 28.5 28.2 28.1 28.1 29.2 28.9 29.7 30.0 29.5 28.2 27.8 27.6 28.5 29.6 29.6 29.8 29.8 29.4 27.8 27.1 27.5 28.2 28.9 29.2 29.5 29.5 28.6 27.5 26.9 27.3 27.5 28.6 28.7 29.0 29.2 28.8 27.2 26.7 26.7 27.9 28.4 28.3 28.3 28.4 28.2 27.5 26.3 26.6 27.7 28.0 27.5 27.7 28.0 28.5 28.9 29.1 29.3 29.4 29.4 27.7 27.9 28.1 28.5 28.8 28.9 29.1 29.1 29.1 28.1 28.2 28.4 28.6 28.8 28.8 29.0 29.0 29.0 28.5 28.6 28.6 28.7 28.6 28.6 28.6 28.6 28.7 28.9 28.9 28.8 28.6 28.4 28.2 28.2 28.2 28.4 29.2 29.2 28.9 28.6 28.2 28.0 27.9 27.9 28.1 29.2 29.1 28.8 28.4 28.0 27.7 27.7 27.7 27.9 29.1 29.0 28.7 28.3 27.8 27.6 27.5 27.5 27.8 28.9 28.8 28.5 28.1 27.7 27.4 27.4 27.4 27.6
  38. Focal Operations in ArcGIS • Focal analysis tools • Focal

    Statistics • Statistics type • Continuous statistics • Maximum • Determines, within the defined neighborhood, the maximum of continuous cell values • e.g. finding the highest snow totals in the mountains Slide #48 raw elevation dataset 5x5 rectangle elevation maximum filter edge cell-inclusive edge cell-exclusive elevation (m) 26.3 30.1 27.0 28.1 28.1 28.2 29.1 29.2 29.7 29.7 30.1 26.6 27.4 28.1 28.5 29.1 29.9 29.6 29.3 29.6 27.0 27.5 27.6 28.3 29.3 29.2 29.0 28.4 29.1 27.7 28.4 28.7 29.3 28.5 28.2 28.1 28.1 29.2 28.9 29.7 30.0 29.5 28.2 27.8 27.6 28.5 29.6 29.6 29.8 29.8 29.4 27.8 27.1 27.5 28.2 28.9 29.2 29.5 29.5 28.6 27.5 26.9 27.3 27.5 28.6 28.7 29.0 29.2 28.8 27.2 26.7 26.7 27.9 28.4 28.3 28.3 28.4 28.2 27.5 26.3 26.6 27.7 28.0 28.1 28.5 29.3 29.9 29.9 29.9 30.1 30.1 30.1 28.7 29.3 29.3 29.9 29.9 29.9 30.1 30.1 30.1 30.0 30.0 30.0 30.0 30.0 29.9 30.1 30.1 30.1 30.0 30.0 30.0 30.0 30.0 29.9 29.9 29.9 29.6 30.0 30.0 30.0 30.0 30.0 29.5 29.6 29.6 29.6 30.0 30.0 30.0 30.0 30.0 29.5 29.6 29.6 29.6 30.0 30.0 30.0 30.0 30.0 29.5 29.6 29.6 29.6 29.8 29.8 29.8 29.8 29.8 29.4 28.9 28.9 28.9 29.5 29.5 29.5 29.5 29.5 28.8 28.6 28.6 28.6
  39. Raster Considerations 6: Bands Multi-Band Raster (e.g., Satellite Image) Single

    Band Raster (e.g., Digital Elevation Model) Think of bands as individual layers in a raster dataset
  40. Raster Considerations 6: Bands The most common multi-band raster we

    deal with is color imagery, which has three bands (red, green, blue)
  41. Raster Considerations 6: Bands LANDSAT orbits the earth every 16

    days, taking pictures with 30 m resolution… and collecting a bunch more bands of data, too.
  42. Raster Considerations 6: Bands LANDSAT orbits the earth every 16

    days, taking pictures with 30 m resolution… and collecting a bunch more bands of data, too.
  43. Lab this week will consist of Jupyter and a short

    Homework Two Homework Problems (1) Extracting Raster Data to Points, (2) Raster Math Four Jupyter Notebooks for Comprehension 1. Introduction to Rasters 2. Raster Geoprocessing 3. Map Algebra/Raster Calculator 4. Moving Windows and Focal Analysis Two Jupyter notebooks in a single .zip folder (for the homework assignment) Turn in your four notebooks as a single .zip folder (for the Jupyter Assignment)