acquisition of information about an object or phenomenon without making physical contact with the object and thus in contrast to on-site observation In-Situ measurements acquire information about an object when the distance between the object and the sensor is comparable to or smaller than any linear dimension of the sensor. Remote Sensing and In-Situ Surveying
acquisition of information about an object or phenomenon without making physical contact with the object and thus in contrast to on-site observation In-Situ measurements acquire information about an object when the distance between the object and the sensor is comparable to or smaller than any linear dimension of the sensor. Remote Sensing and In-Situ Surveying Spatial Interpolation is the process by which we generate continuous raster data from discrete vector (i.e., point-based) measurements using remote and in-situ techniques. TODAY NEXT TIME This week (and really the next four weeks) will be focused on digital elevation models and terrain data.
and widely-used data in the GIS world Applications in… Geomorphology Geology Hydrology Landscape ecology Natural hazards Archaeology And many, many others…
but by far the most common is the digital elevation model (DEM) Rasterized representation of terrain where each grid cell contains an approximate elevation of that location You’ve all already worked with these Continuous raster data Every cell has its own, unique elevation measurement
Elevation Program Introduced in 2012 as a response to the National Enhanced Elevation Assessment (NEEA), which highlighted how outdated, inaccurate, and imprecise national elevation data were a detriment to many industries and entities e.g. flood risk management, agriculture, water supply, homeland security, renewable energy, aviation safety, wildland fire management, geologic resource assessment, forest resource management, infrastructure management, etc.
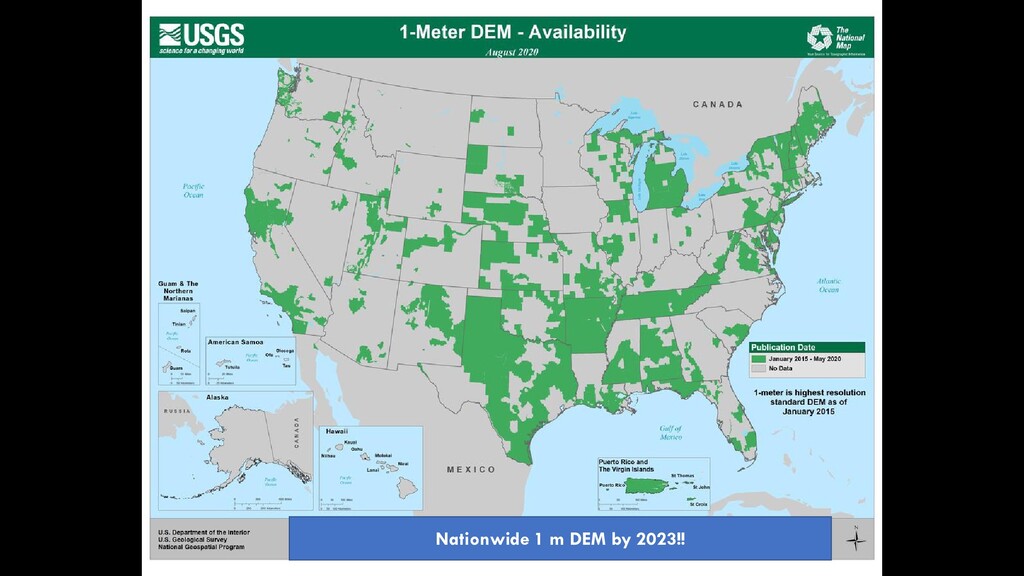
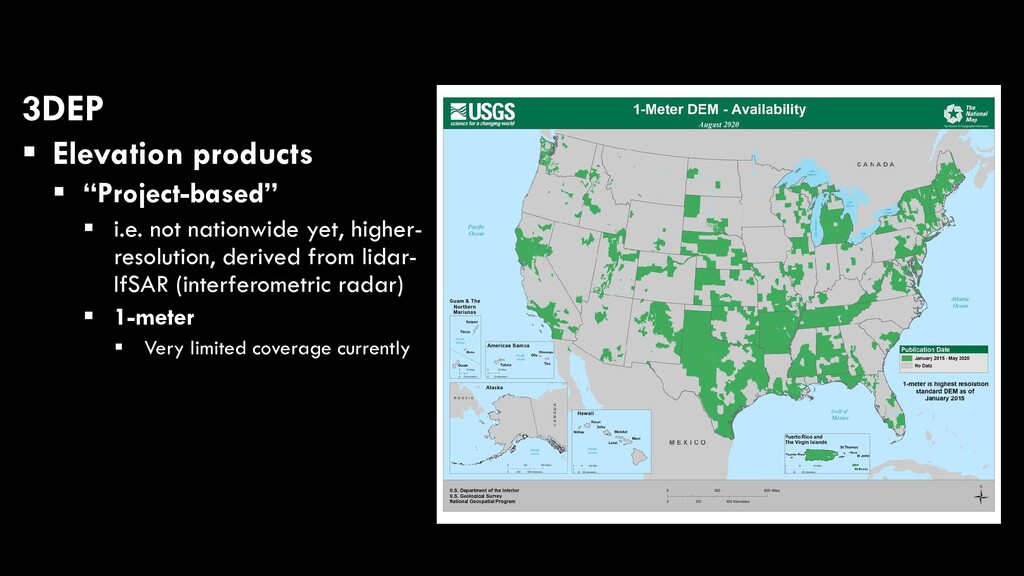
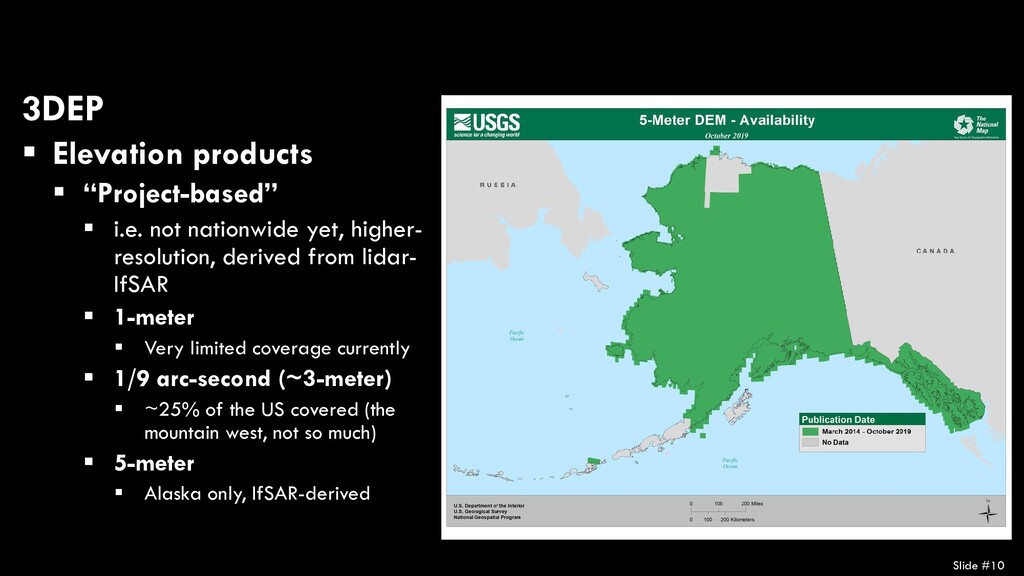
not nationwide yet, higher- resolution, derived from lidar- IfSAR 1-meter Very limited coverage currently 1/9 arc-second (~3-meter) ~25% of the US covered (the mountain west, not so much)
not nationwide yet, higher- resolution, derived from lidar- IfSAR 1-meter Very limited coverage currently 1/9 arc-second (~3-meter) ~25% of the US covered (the mountain west, not so much) 5-meter Alaska only, IfSAR-derived
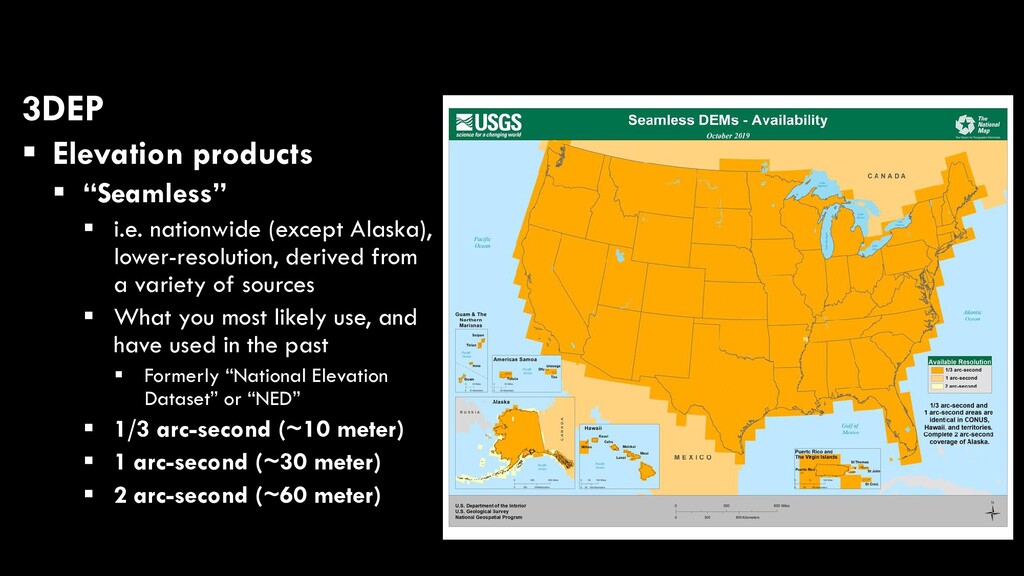
Alaska), lower-resolution, derived from a variety of sources What you most likely use, and have used in the past Formerly “National Elevation Dataset” or “NED” 1/3 arc-second (~10 meter) 1 arc-second (~30 meter) 2 arc-second (~60 meter)
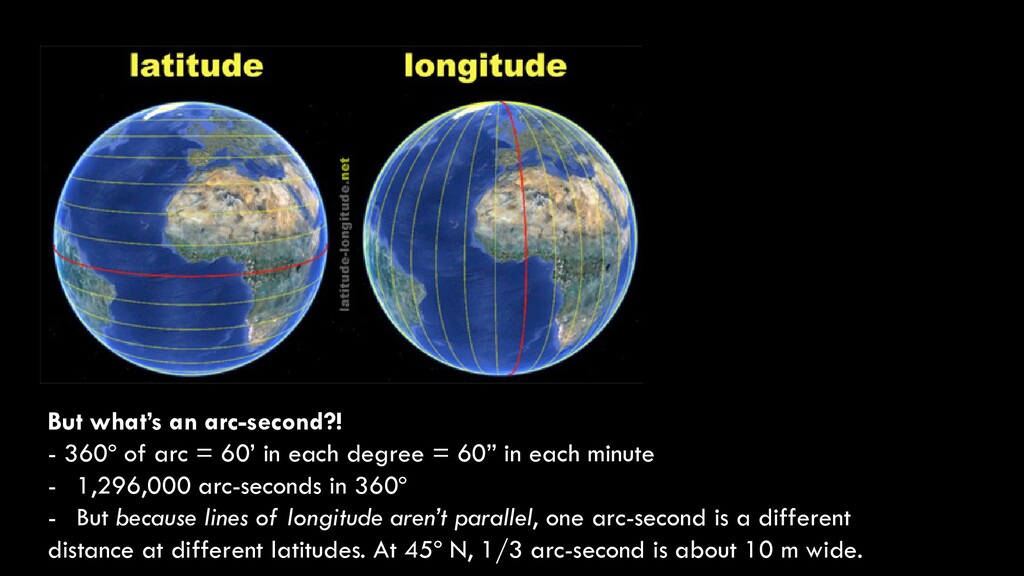
in each degree = 60” in each minute - 1,296,000 arc-seconds in 360º - But because lines of longitude aren’t parallel, one arc-second is a different distance at different latitudes. At 45º N, 1/3 arc-second is about 10 m wide.
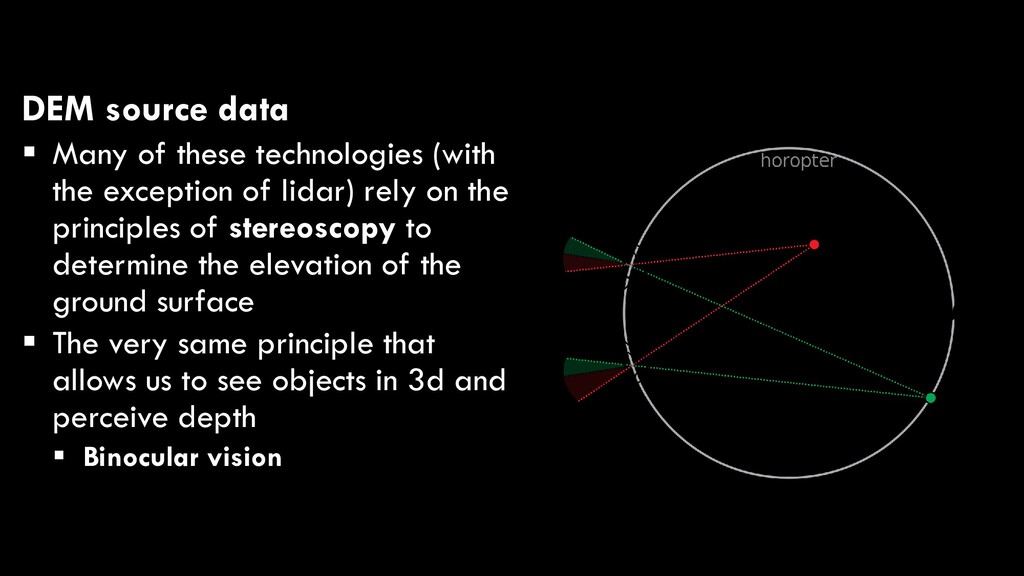
exception of lidar) rely on the principles of stereoscopy to determine the elevation of the ground surface The very same principle that allows us to see objects in 3d and perceive depth Binocular vision
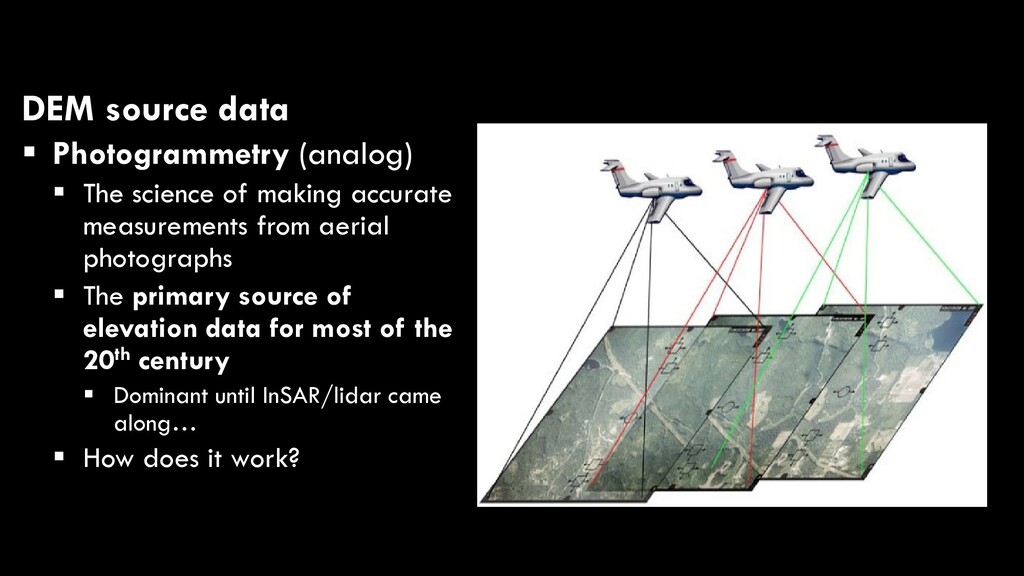
making accurate measurements from aerial photographs The primary source of elevation data for most of the 20th century Dominant until InSAR/lidar came along… How does it work?
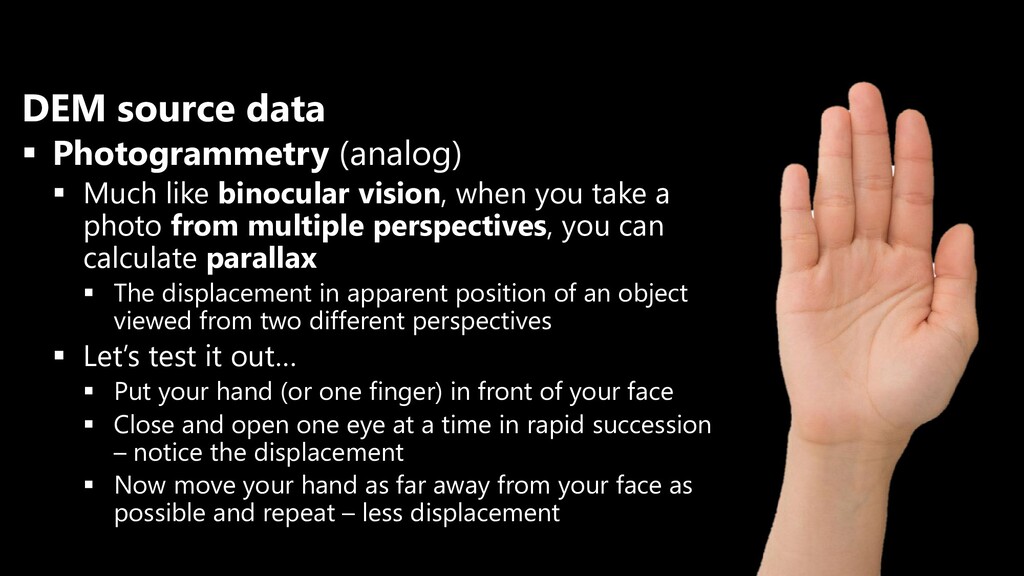
vision, when you take a photo from multiple perspectives, you can calculate parallax The displacement in apparent position of an object viewed from two different perspectives Let’s test it out… Put your hand (or one finger) in front of your face Close and open one eye at a time in rapid succession – notice the displacement Now move your hand as far away from your face as possible and repeat – less displacement
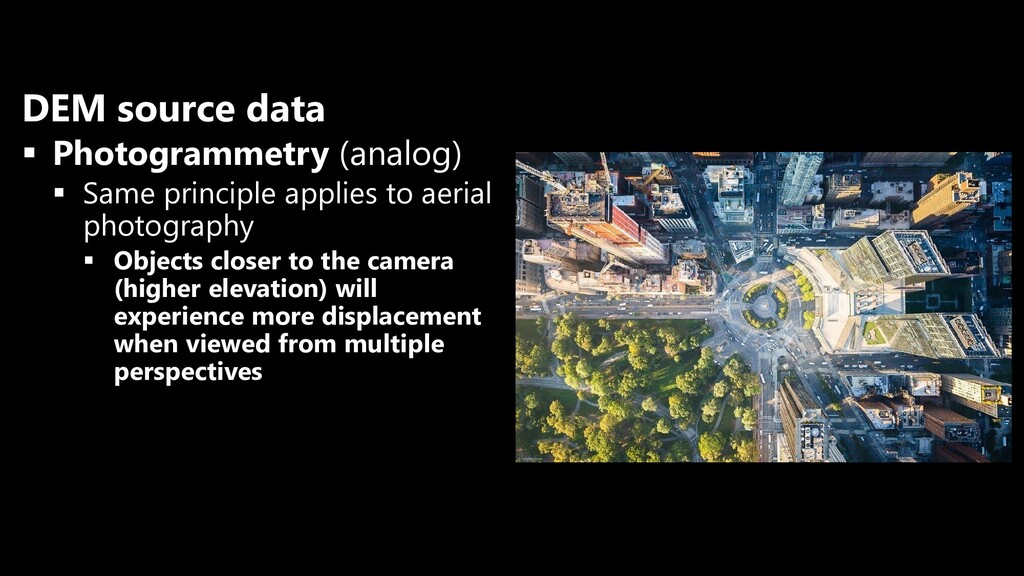
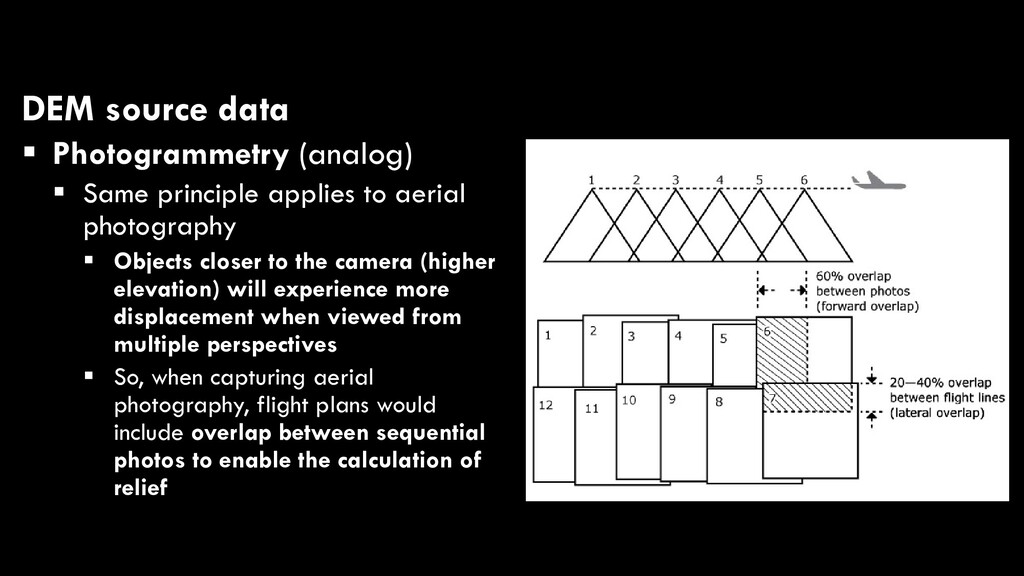
to aerial photography Objects closer to the camera (higher elevation) will experience more displacement when viewed from multiple perspectives So, when capturing aerial photography, flight plans would include overlap between sequential photos to enable the calculation of relief
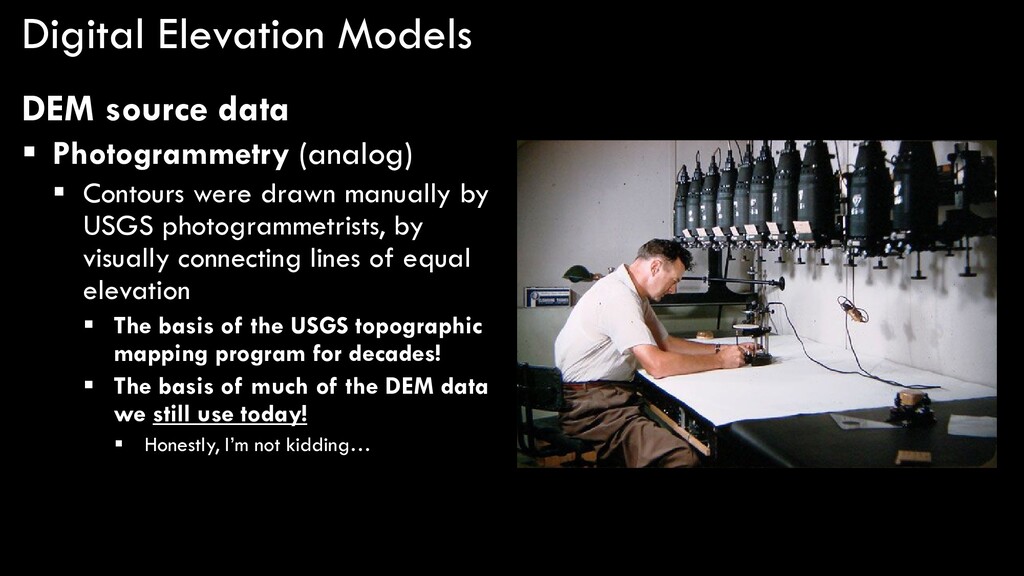
Contours were drawn manually by USGS photogrammetrists, by visually connecting lines of equal elevation The basis of the USGS topographic mapping program for decades! The basis of much of the DEM data we still use today! Honestly, I’m not kidding…
around since the early 20th century Then with the advent of more advanced mapping systems (InSAR, lidar), and the proliferation of digital mapping technology (GIS), photogrammetry’s popularity declined …until recently!!!
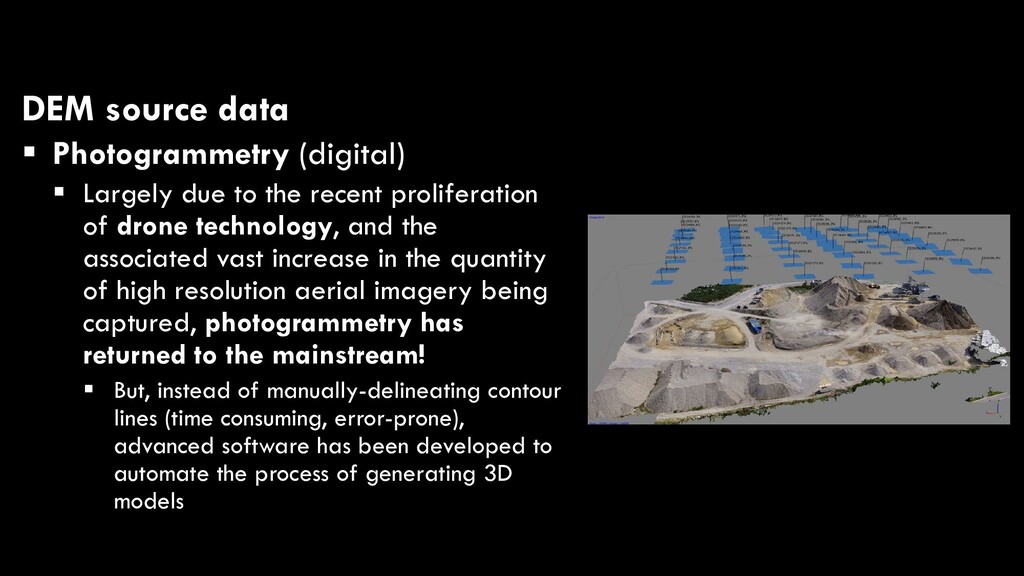
the recent proliferation of drone technology, and the associated vast increase in the quantity of high resolution aerial imagery being captured, photogrammetry has returned to the mainstream! But, instead of manually-delineating contour lines (time consuming, error-prone), advanced software has been developed to automate the process of generating 3D models
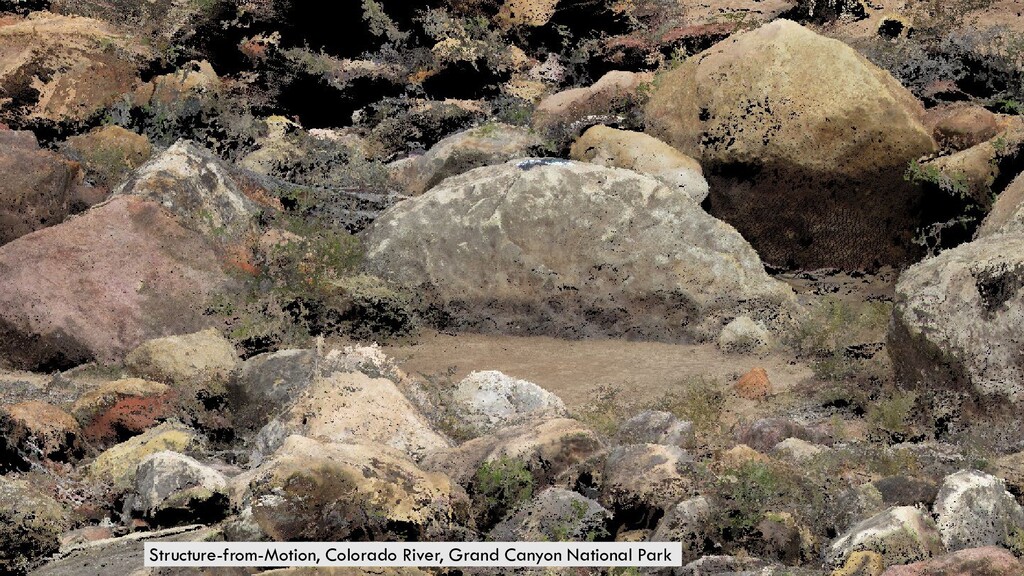
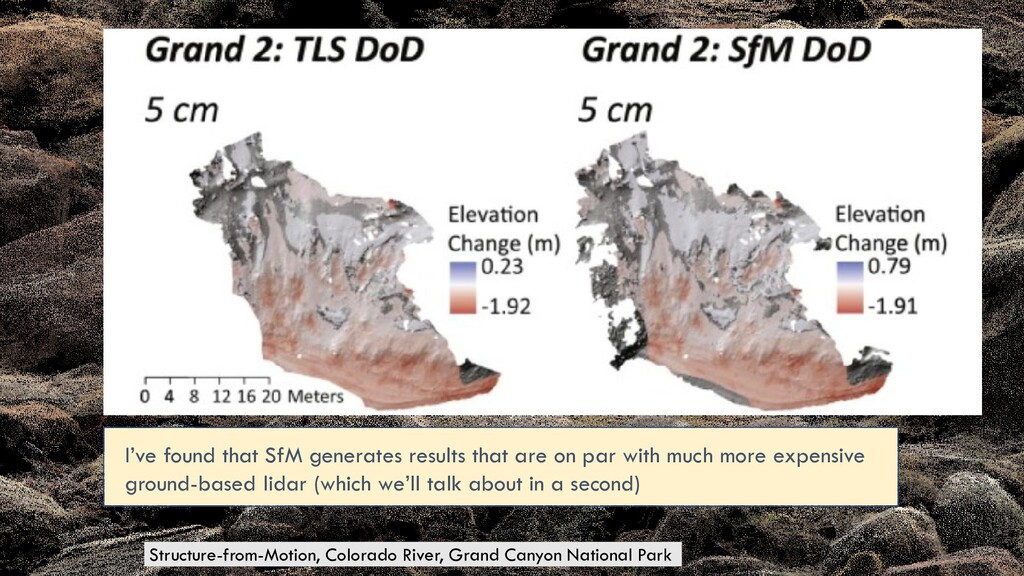
Though not as accurate/precise as lidar, “structure from motion (SFM)” or “digital photogrammetry” technology enables us to compute elevations without knowing camera positions
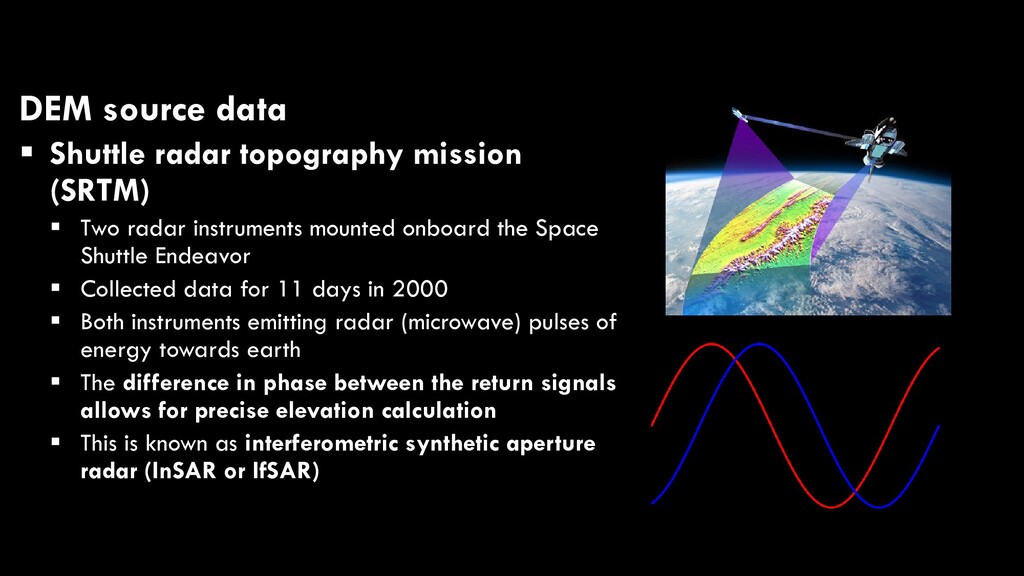
Two radar instruments mounted onboard the Space Shuttle Endeavor Collected data for 11 days in 2000 Both instruments emitting radar (microwave) pulses of energy towards earth The difference in phase between the return signals allows for precise elevation calculation This is known as interferometric synthetic aperture radar (InSAR or IfSAR)
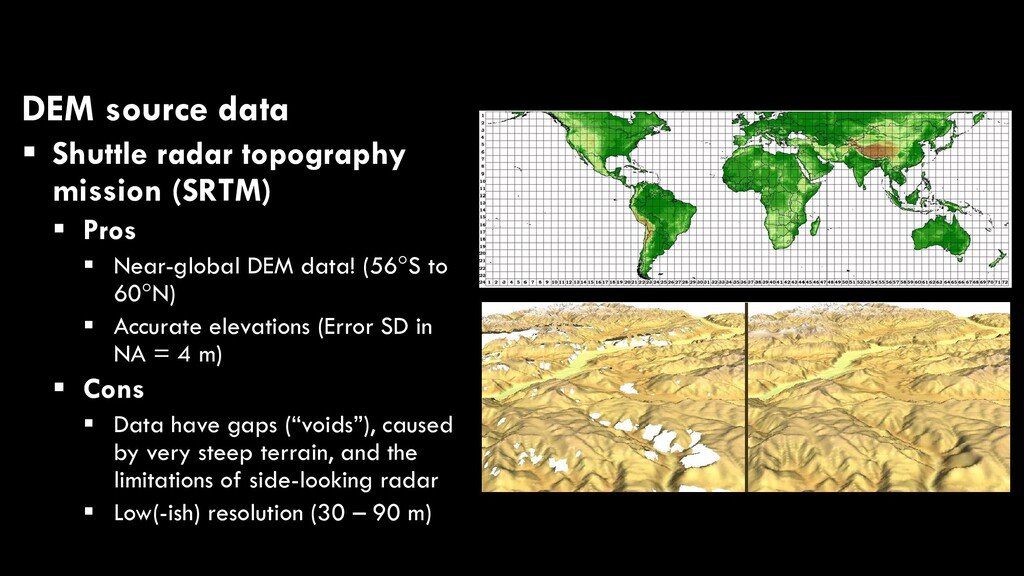
Pros Near-global DEM data! (56°S to 60°N) Accurate elevations (Error SD in NA = 4 m) Cons Data have gaps (“voids”), caused by very steep terrain, and the limitations of side-looking radar Low(-ish) resolution (30 – 90 m)
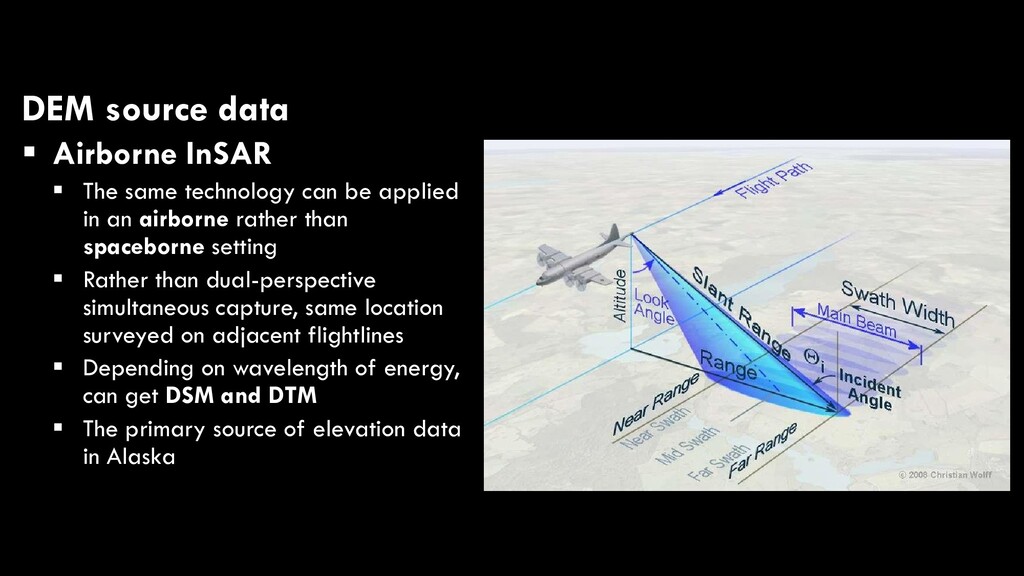
can be applied in an airborne rather than spaceborne setting Rather than dual-perspective simultaneous capture, same location surveyed on adjacent flightlines Depending on wavelength of energy, can get DSM and DTM The primary source of elevation data in Alaska
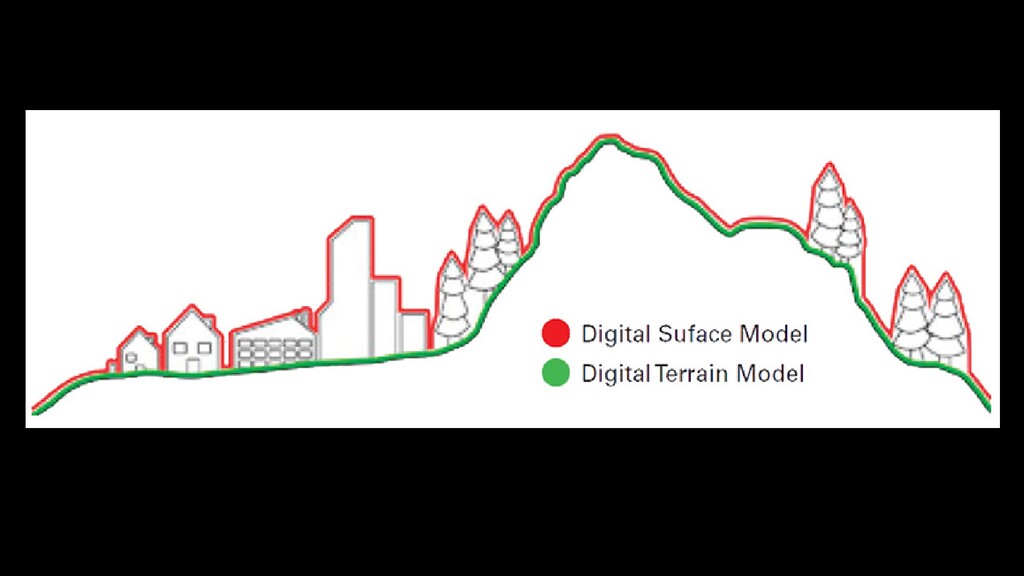
A digital elevation model (DEM) is a generic term for any rasterized representation of elevation A digital terrain model (DTM) is a type of DEM where the cells represent height of the terrain (the ground)
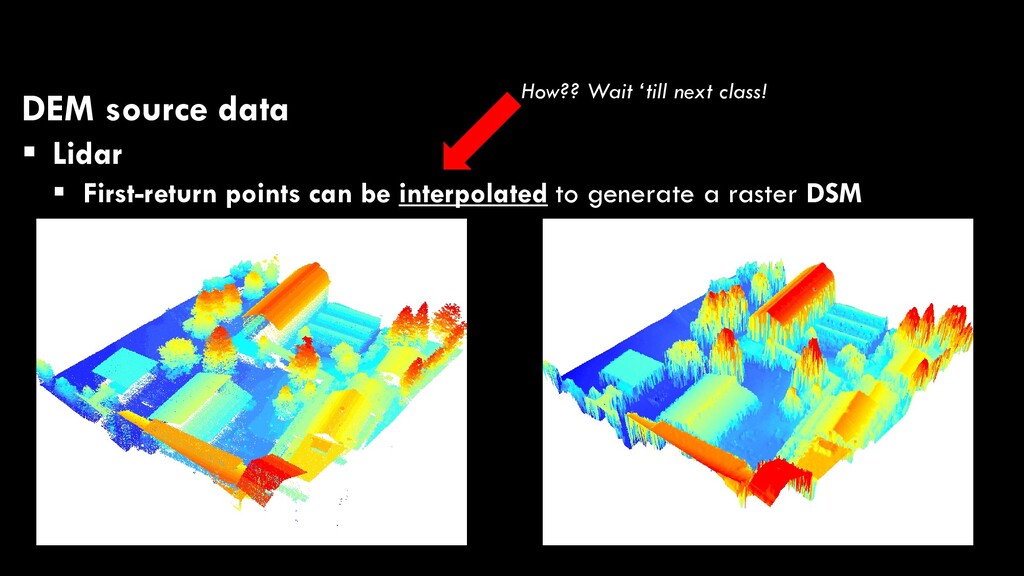
A digital elevation model (DEM) is a generic term for any rasterized representation of elevation A digital terrain model (DTM) is a type of DEM where the cells represent height of the terrain (the ground) A digital surface model (DSM) is a type of DEM where the cells represent height of the surface of the Earth (including natural and artificial features above the ground level)
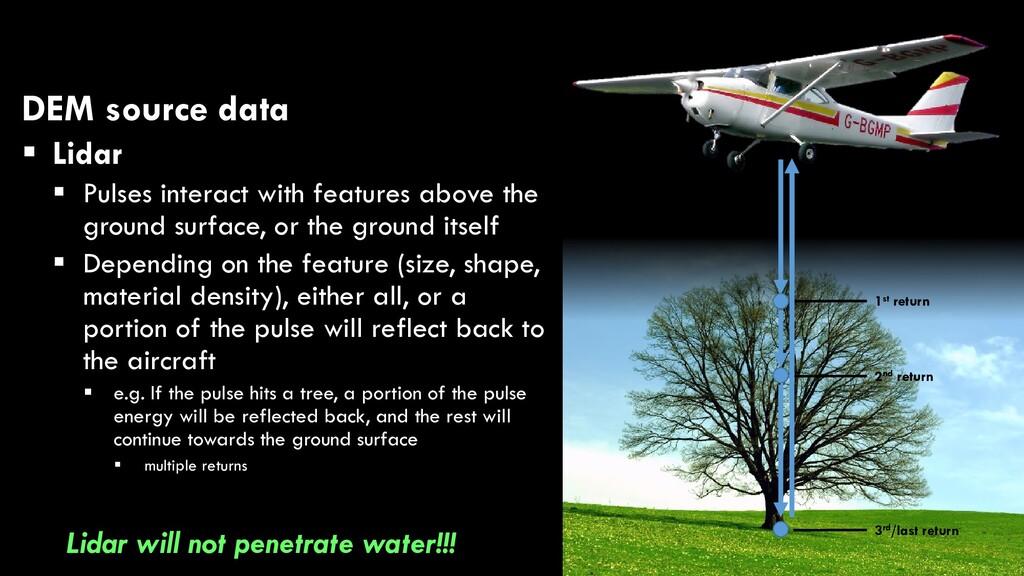
with features above the ground surface, or the ground itself Depending on the feature (size, shape, material density), either all, or a portion of the pulse will reflect back to the aircraft e.g. If the pulse hits a building roof, or a road, the entire pulse will reflect back to the sensor single return single return
with features above the ground surface, or the ground itself Depending on the feature (size, shape, material density), either all, or a portion of the pulse will reflect back to the aircraft e.g. If the pulse hits a tree, a portion of the pulse energy will be reflected back, and the rest will continue towards the ground surface multiple returns 1st return 2nd return 3rd/last return Lidar will not penetrate water!!!
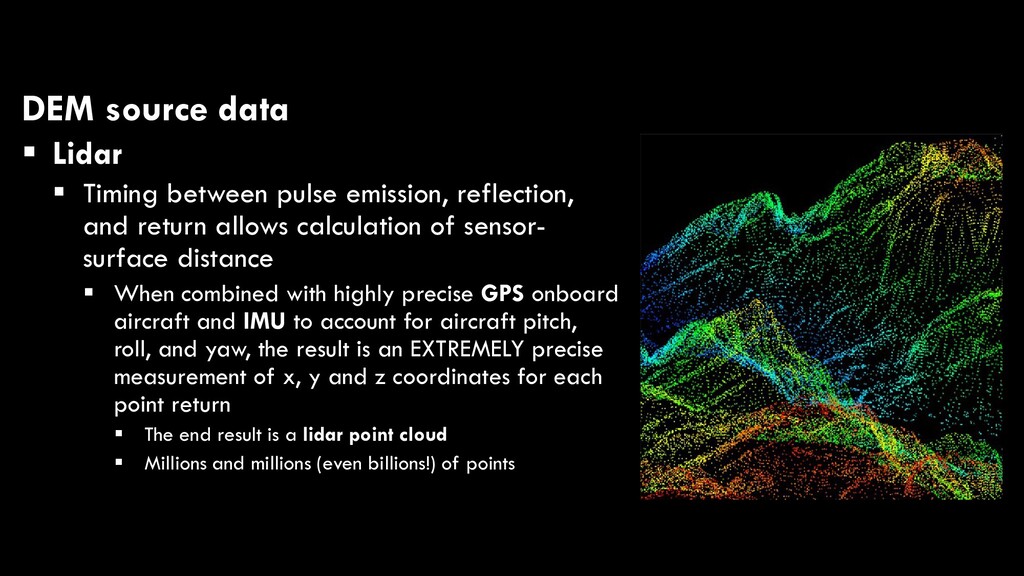
reflection, and return allows calculation of sensor- surface distance When combined with highly precise GPS onboard aircraft and IMU to account for aircraft pitch, roll, and yaw, the result is an EXTREMELY precise measurement of x, y and z coordinates for each point return The end result is a lidar point cloud Millions and millions (even billions!) of points
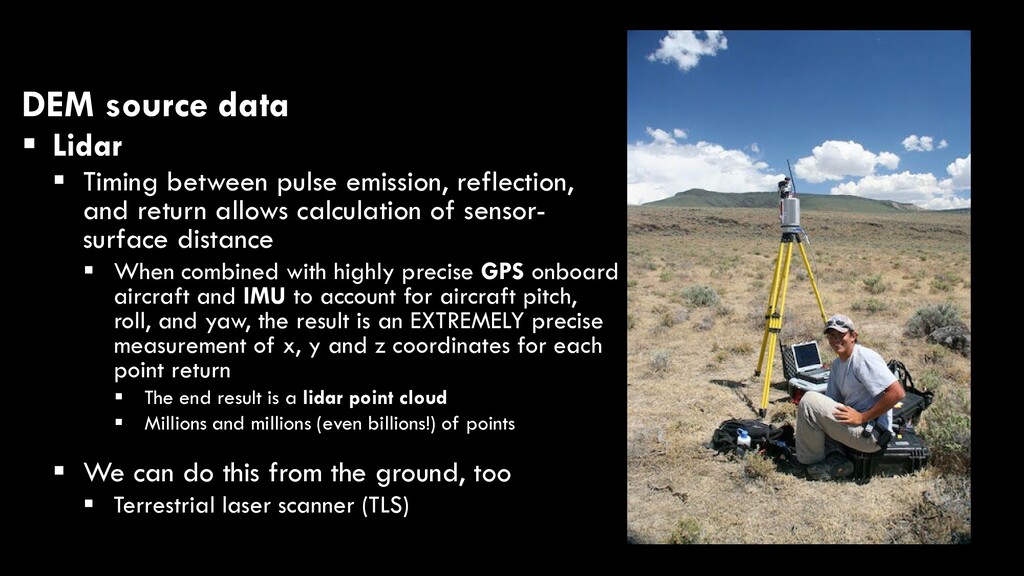
reflection, and return allows calculation of sensor- surface distance When combined with highly precise GPS onboard aircraft and IMU to account for aircraft pitch, roll, and yaw, the result is an EXTREMELY precise measurement of x, y and z coordinates for each point return The end result is a lidar point cloud Millions and millions (even billions!) of points We can do this from the ground, too Terrestrial laser scanner (TLS)
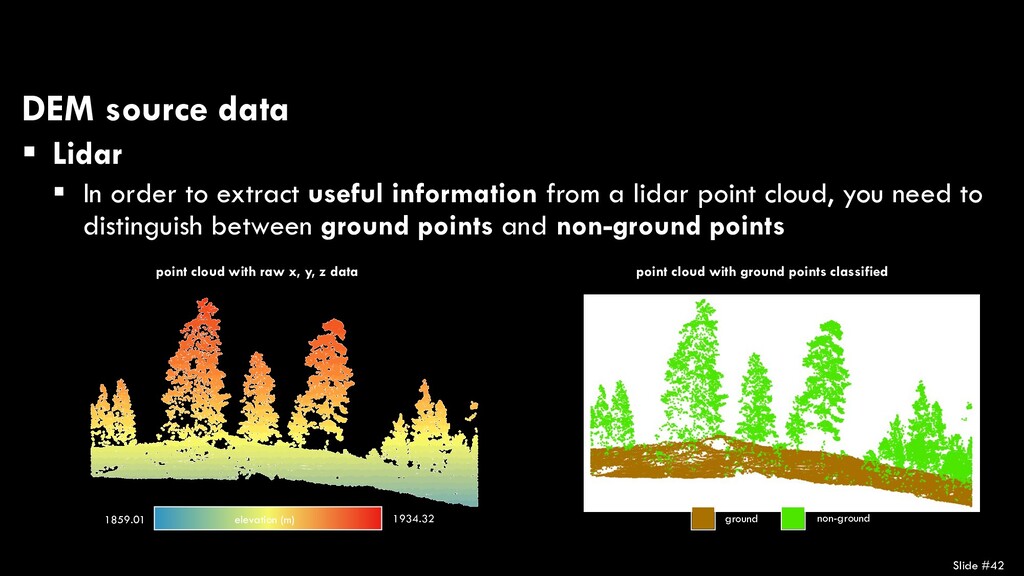
to extract useful information from a lidar point cloud, you need to distinguish between ground points and non-ground points point cloud with raw x, y, z data elevation (m) 1859.01 1934.32 point cloud with ground points classified ground non-ground
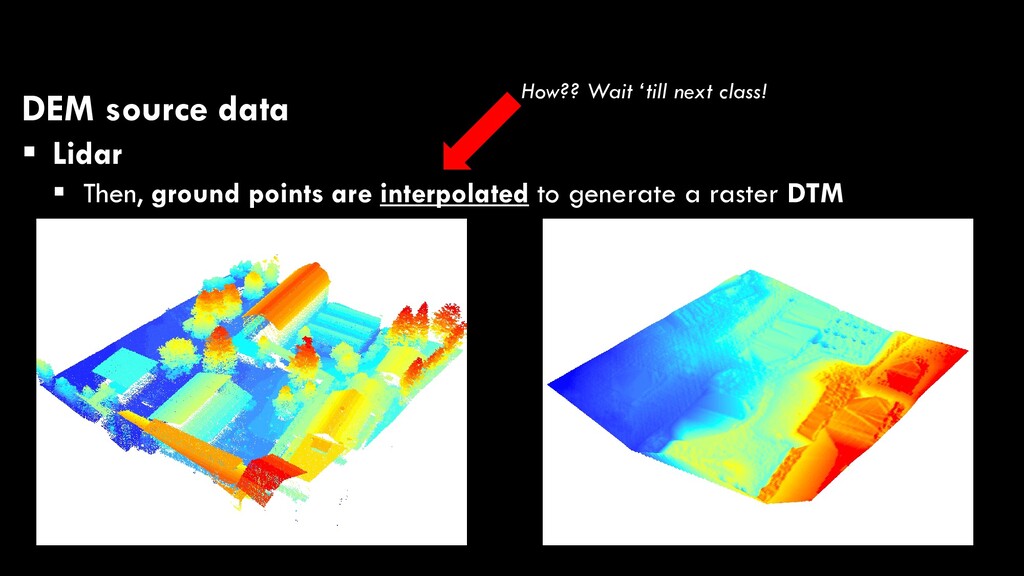
ground points 1. single/last returns 2. first ground point classification and TIN generation 3. evaluate candidates against TIN to determine distance above/below if distance < defined threshold, ground point if distance > defined threshold, non-ground point repeat step 3 until all points have been evaluated