Machine Learning With Scikit-Learn - Pydata Strata NYC 2015
Introduction to machine learning and scikit-learn, including basic API, grid-search, pipelines, model complexity and in-depth review of some supervised models.
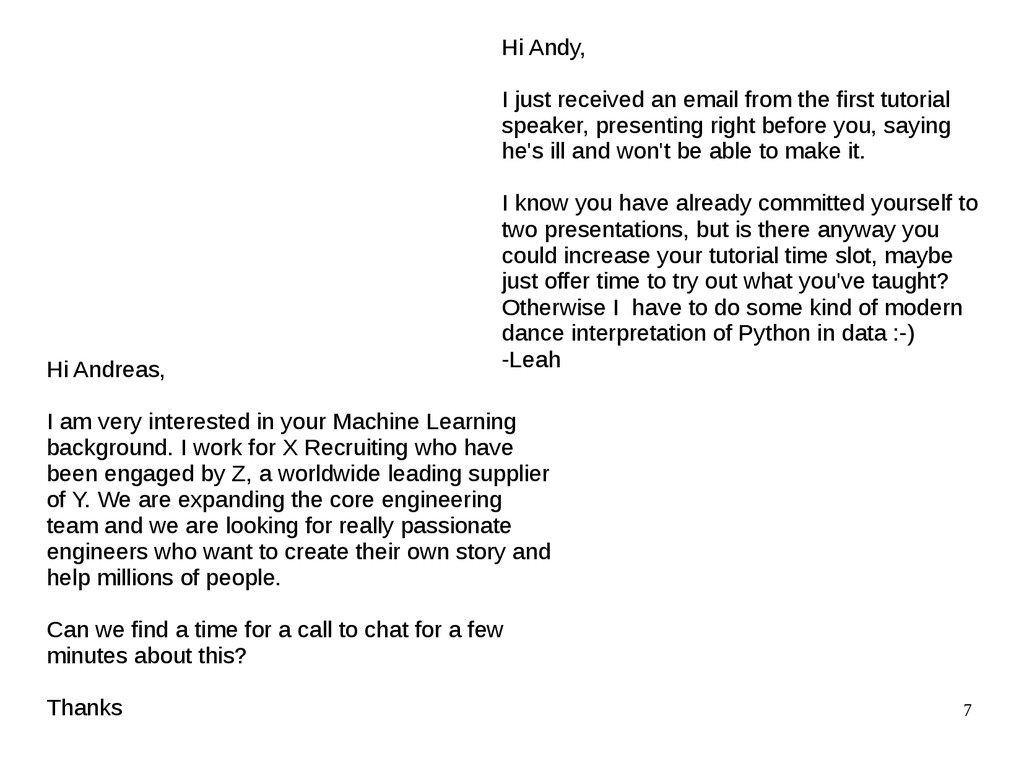
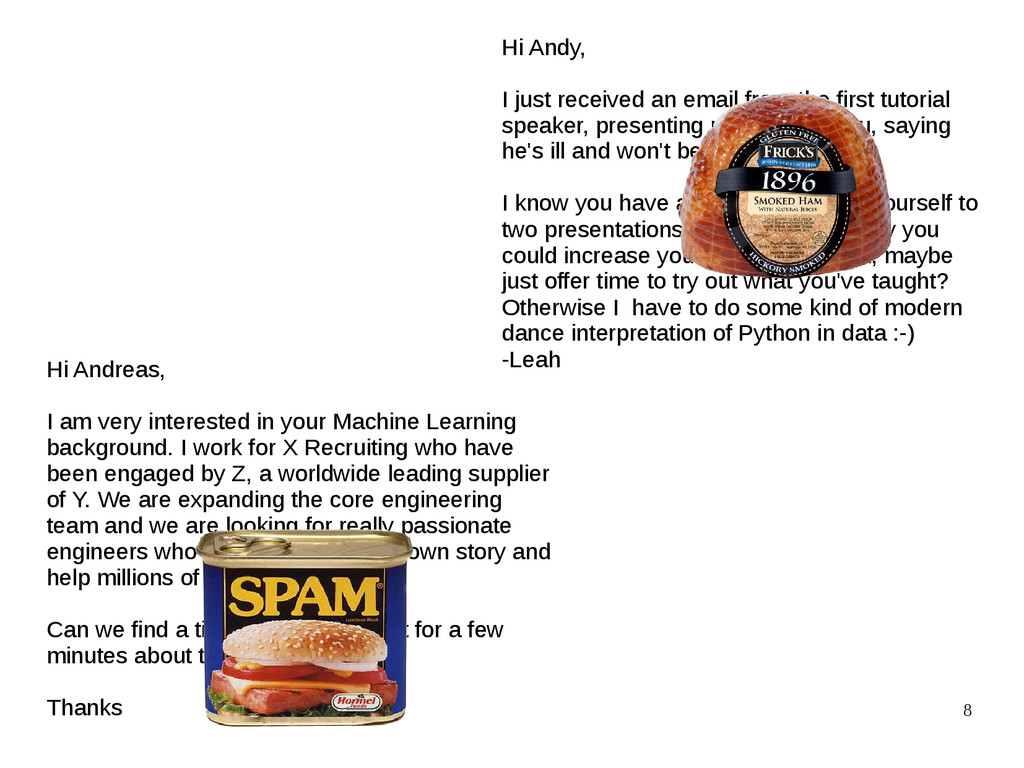
first tutorial speaker, presenting right before you, saying he's ill and won't be able to make it. I know you have already committed yourself to two presentations, but is there anyway you could increase your tutorial time slot, maybe just offer time to try out what you've taught? Otherwise I have to do some kind of modern dance interpretation of Python in data :-) -Leah Hi Andreas, I am very interested in your Machine Learning background. I work for X Recruiting who have been engaged by Z, a worldwide leading supplier of Y. We are expanding the core engineering team and we are looking for really passionate engineers who want to create their own story and help millions of people. Can we find a time for a call to chat for a few minutes about this? Thanks
first tutorial speaker, presenting right before you, saying he's ill and won't be able to make it. I know you have already committed yourself to two presentations, but is there anyway you could increase your tutorial time slot, maybe just offer time to try out what you've taught? Otherwise I have to do some kind of modern dance interpretation of Python in data :-) -Leah Hi Andreas, I am very interested in your Machine Learning background. I work for X Recruiting who have been engaged by Z, a worldwide leading supplier of Y. We are expanding the core engineering team and we are looking for really passionate engineers who want to create their own story and help millions of people. Can we find a time for a call to chat for a few minutes about this? Thanks
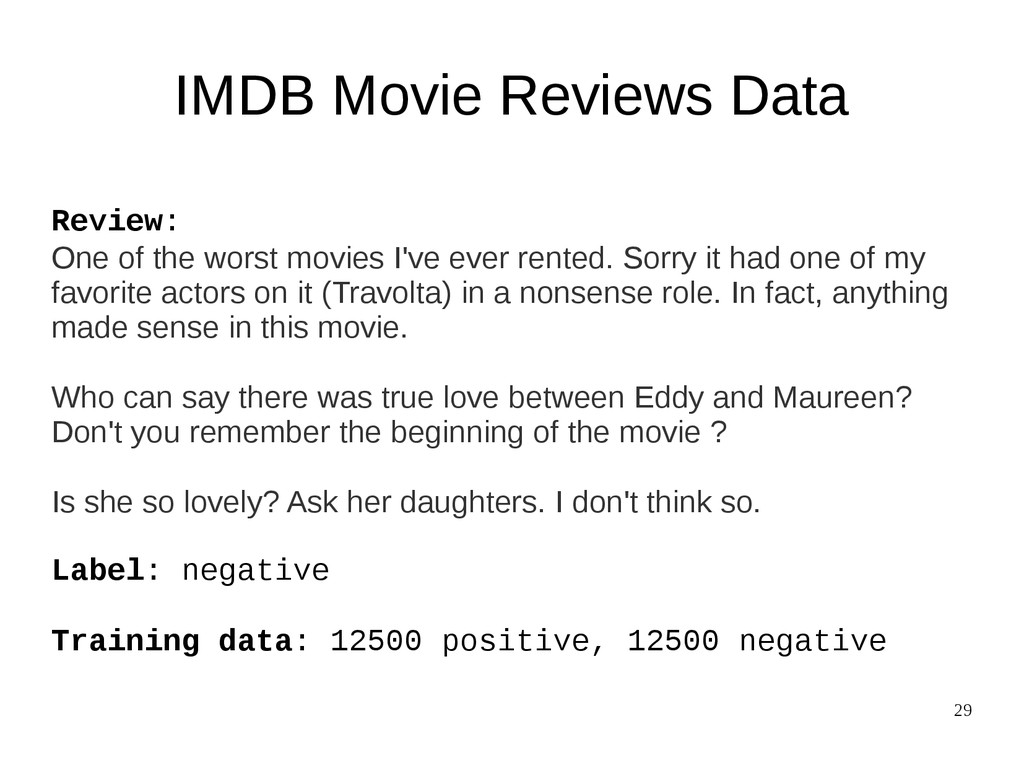
Sorry it had one of my favorite actors on it (Travolta) in a nonsense role. In fact, anything made sense in this movie. Who can say there was true love between Eddy and Maureen? Don't you remember the beginning of the movie ? Is she so lovely? Ask her daughters. I don't think so. Label: negative Training data: 12500 positive, 12500 negative IMDB Movie Reviews Data
![27 Basic API estimator.fit(X, [y]) estimator.predict estimator.transform Classification Preprocessing Regression](https://files.speakerdeck.com/presentations/3fdd2d8df4f44b3fa1de47c5dc429cf4/slide_26.jpg)
![93 Thank you for your attention. @t3kcit @amueller [email protected] http://amueller.github.io](https://files.speakerdeck.com/presentations/3fdd2d8df4f44b3fa1de47c5dc429cf4/slide_92.jpg)