Labor Statistics employment projections for 2019-29 (Zilberman & Ice, 2021) STEM occupations : +8.0% All other occupations : +3.7% The demand for STEM workforce is increasing ⚫ The gap between supply and demand for STEM workforce ➢ EU • 40% EU employers said in 2013 that they have difficulty finding the right skills when recruiting (Cedefop, 2018). ➢ Japan • There is a shortage of STEM workforce to meet the demand of companies (METI, 2018). We need to increase the number of people choosing STEM careers to close these gaps.
(Bandura, 1977; Hackett & Betz, 1981) Self-Efficacy Choice Goals Self-Efficacy: Confidence in job-related areas. Choice Goal: Aspirations of what career choice to make. ◆Lent et al. (1986) Self-efficacy predicts science and technology career aspirations. ◆Nauta et al. (1998) Self-efficacy influences higher-order science career aspirations. What are the psychological mechanisms by which young people choose their careers?
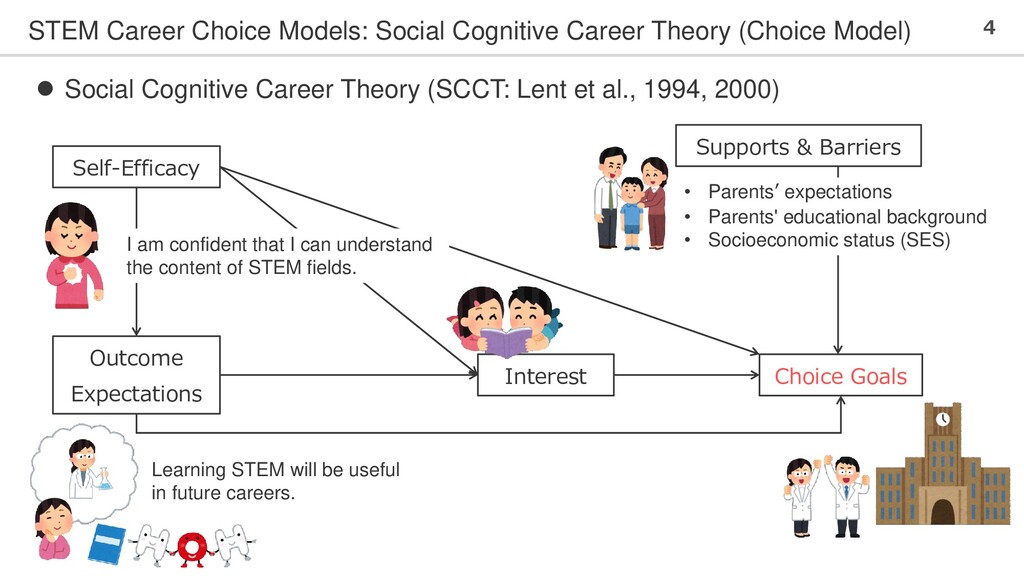
4 ⚫ Social Cognitive Career Theory (SCCT: Lent et al., 1994, 2000) Self-Efficacy Interest Outcome Expectations Choice Goals Learning STEM will be useful in future careers. Supports & Barriers • Parents’ expectations • Parents' educational background • Socioeconomic status (SES) I am confident that I can understand the content of STEM fields.
5 ⚫ Social Cognitive Career Theory (SCCT) Meta-analysis by Lent et al. (2018) Integrating 143 studies on STEM careers. # 84% of the data is from the US. Generalization possible?
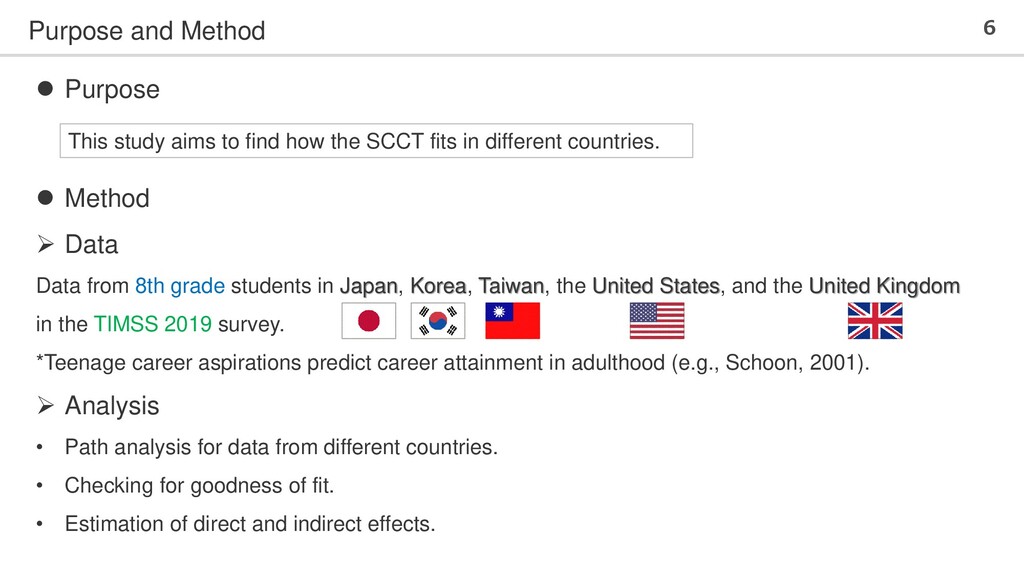
the SCCT fits in different countries. ⚫ Purpose ⚫ Method ➢ Data Data from 8th grade students in Japan, Korea, Taiwan, the United States, and the United Kingdom in the TIMSS 2019 survey. *Teenage career aspirations predict career attainment in adulthood (e.g., Schoon, 2001). ➢ Analysis • Path analysis for data from different countries. • Checking for goodness of fit. • Estimation of direct and indirect effects.
Outcome Expectations Self-Efficacy Choice Goals Interest SES 1 item: BSBS25E “I would like a job that involves using science” Mean of 4 items: BSBS25C, D, F, G ex. “Learning science will give me more job opportunities when I am an adult” Student Confident in Science (*Estimated from 8 items based on IRT) ex. “I usually do well in science” Students Like Learning Science (*Estimated from 9 items based on IRT) ex. “I enjoy learning science” Home Educational Resources (*Estimated from 3 items based on IRT) ex. “Highest level of education of either parent”
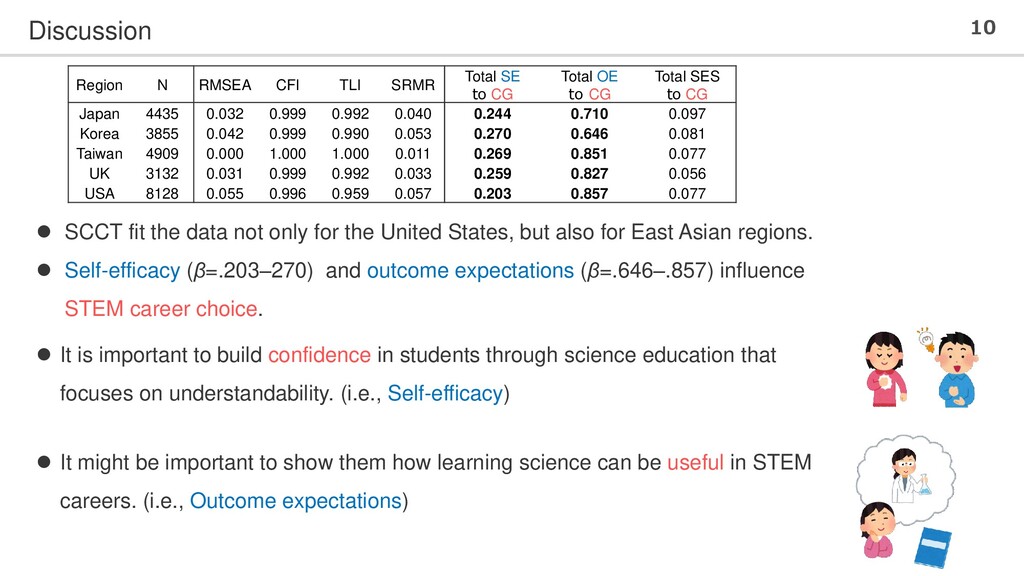
students through science education that focuses on understandability. (i.e., Self-efficacy) ⚫ It might be important to show them how learning science can be useful in STEM careers. (i.e., Outcome expectations) ⚫ SCCT fit the data not only for the United States, but also for East Asian regions. ⚫ Self-efficacy (β=.203–270) and outcome expectations (β=.646–.857) influence STEM career choice. Region N RMSEA CFI TLI SRMR Total SE to CG Total OE to CG Total SES to CG Japan 4435 0.032 0.999 0.992 0.040 0.244 0.710 0.097 Korea 3855 0.042 0.999 0.990 0.053 0.270 0.646 0.081 Taiwan 4909 0.000 1.000 1.000 0.011 0.269 0.851 0.077 UK 3132 0.031 0.999 0.992 0.033 0.259 0.827 0.056 USA 8128 0.055 0.996 0.959 0.057 0.203 0.857 0.077
address the hierarchical nature of the TIMSS data. ➢ Multilevel model ⚫ Did not measure broad career aspirations in STEM fields. ➢ Increase the number of measurement items and improve the validity. ⚫ The effectiveness of the intervention on self-efficacy and outcome expectations is unknown. ➢ Longitudinal intervention studies
et al. (2018), Drymiotou et al. (2021) • Introduce science topics that are relevant to everyday life. • Connect with scientists or experts. • Provide information about STEM careers and pathways. ⚫ Projects in Japanese High Schools ➢ High school students participate in conferences and interact with experts. ➢ Experts in STEM fields to lecture at high schools.