Upgrade to Pro — share decks privately, control downloads, hide ads and more …

A Portrait of Generation Next

Nan Shastry
November 03, 2011

A Portrait of Generation Next

A new generation has come of age, shaped by an unprecedented revolution in technology and dramatic events both at home and abroad. They are Generation Next, the cohort of young adults who have grown up with personal computers, cell phones and the internet and are now
taking their place in a world where the only constant is rapid change. Here is research and portrait of who they are.

Nan Shastry

November 03, 2011
Tweet

More Decks by Nan Shastry

Other Decks in Research

Transcript

  1. FOR RELEASE: TUESDAY JANUARY 9, 2007 2:00 PM How Young

    People View Their Lives, Futures and Politics A PORTRAIT OF “GENERATION NEXT” A Survey Conducted in Association with: The Generation Next Initiative and Documentary produced by MacNeil/Lehrer Productions FOR FURTHER INFORMATION CONTACT: Andrew Kohut, Director Kim Parker, Senior Researcher Scott Keeter, Director of Survey Research Carroll Doherty, Associate Director Michael Dimock, Associate Director Pew Research Center For The People & The Press 1615 L Street, N.W., Suite 700 Washington, D.C. 20036 Tel (202) 419-4350 Fax (202) 419-4399 www.people-press.org
  2. 2006 Generation Next Study Table of Contents Page Overview .

    . . . . . . . . . . . . . . . . . . . . . . . . . . . . . . . . . . . . . . . . . . . . . . . . . . . . . . . . . . . . . 1 1. Outlook and World View . . . . . . . . . . . . . . . . . . . . . . . . . . . . . . . . . . . . . . . . . . . . . 5 Quality of life and optimistic outlook Opportunities today compared to 20 years ago Personal concerns What sets Generation Next apart Heroes and role models Marriage and children 2. Technology and Lifestyle . . . . . . . . . . . . . . . . . . . . . . . . . . . . . . . . . . . . . . . . . . . . 13 Technology use and social networking Views on technology’s impact Work and finances Family contact and family dynamics Lifestyles, habits and hobbies Tattoos, piercings and appearance Religious beliefs and practices 3. Politics and Policy. . . . . . . . . . . . . . . . . . . . . . . . . . . . . . . . . . . . . . . . . . . . . . . . . . 24 Turnout and voting patterns Party identification trends News interest and political attentiveness Attitudes toward government Issues: Environment, Immigration, Social Security, War, Terrorism 4. Values and Social Issues . . . . . . . . . . . . . . . . . . . . . . . . . . . . . . . . . . . . . . . . . . . . . 38 Views on racial issues Views on homosexuality Abortion and stem cell research Traditional values Data Sources for This Report . . . . . . . . . . . . . . . . . . . . . . . . . . . . . . . . . . . . . . . . . . . . 42 2006 Gen Next Survey Methodology . . . . . . . . . . . . . . . . . . . . . . . . . . . . . . . . . . . . . . 43 About the Center . . . . . . . . . . . . . . . . . . . . . . . . . . . . . . . . . . . . . . . . . . . . . . . . . . . . . . 43 2006 Gen Next Survey Questionnaire. . . . . . . . . . . . . . . . . . . . . . . . . . . . . . . . . . . . . 45 © 2007 Pew Research Center
  3. Anew generation has come of age, shaped by an unprecedented

    revolution in technology and dramatic events both at home and abroad. They are Generation Next, the cohort of young adults who have grown up with personal computers, cell phones and the internet and are now taking their place in a world where the only constant is rapid change. In reassuring ways, the generation that came of age in the shadow of Sept. 11 shares the characteristics of other generations of young adults. They are generally happy with their lives and optimistic about their futures. Moreover, Gen Nexters feel that educational and job opportunities are better for them today than for the previous generation. At the same time, many of their attitudes and priorities reflect a limited set of life experiences. Marriage, children and an established career remain in the future for most of those in Generation Next. More than two-thirds see their generation as unique and distinct, yet not all self-evaluations are positive. A majority says that “getting rich” is the main goal of most people in their age group, and large majorities believe that casual sex, binge drinking, illegal drug use and violence are more prevalent among young people today than was the case 20 years ago. In their political outlook, they are the most tolerant of any generation on social issues such as immigration, race and homosexuality. They are also much more likely to identify with the Democratic Party than was the preceding generation of young people, which could reshape politics in the years ahead. Yet the evidence is mixed as to whether the current generation of young Americans will be any more engaged in the nation’s civic life than were young people in the past, potentially blunting their political impact. This report takes stock of this new generation. It explores their outlook, their lifestyle and their politics. Because the boundaries that separate generations are indistinct, the definition of Generation Next – and other Generation Next Age 18-25 % Think your generation Yes 68 is unique and distinct? No 31 DK 1 100 Compared with 20 years ago young adults today have... % Better educational opportunities 84 Access to higher paying jobs 72 Live in more exciting times 64 Compared with 20 years ago young adults today... % Have more casual sex 75 Resort to violence more 70 Binge drink more 69 Use more illegal drugs 63 Vote less often 49 -----Age----- 2004 18-25 26+ presidential vote* % % John Kerry 56 47 George W. Bush 43 52 Other/Didn’t vote 1 1 100 100 Homosexuality should be... Accepted 58 50 Discouraged 32 39 Mixed/DK 10 11 100 100 Impact of immigration... Strengthens nation 52 39 A burden 38 42 Mixed/DK 10 19 100 100 Based on 2006 Gen Next Survey * 2004 NEP Exit Polls, 18-24 year-old voters
  4. 2 generational groups mentioned in this report – are necessarily

    approximate. For analysis purposes, Generation Next includes those Americans between the ages of 18 and 25 years old. Meet Generation Next: • They use technology and the internet to connect with people in new and distinctive ways. Text messaging, instant messaging and email keep them in constant contact with friends. About half say they sent or received a text message over the phone in the past day, approximately double the proportion of those ages 26-40. • They are the “Look at Me” generation. Social networking sites like Facebook, MySpace and MyYearbook allow individuals to post a personal profile complete with photos and descriptions of interests and hobbies. A majority of Gen Nexters have used one of these social networking sites, and more than four-in-ten have created a personal profile. • Their embrace of new technology has made them uniquely aware of its advantages and disadvantages. They are more likely than older adults to say these cyber-tools make it easier for them to make new friends and help them to stay close to old friends and family. But more than eight-in-ten also acknowledge that these tools “make people lazier.” • About half of Gen Nexters say the growing number of immigrants to the U.S. strengthens the country – more than any generation. And they also lead the way in their support for gay marriage and acceptance of interracial dating. • Beyond these social issues, their views defy easy categorization. For example, Generation Next is less critical of government regulation of business but also less critical of business itself. And they are the most likely of any generation to support privatization of the Social Security system. • They maintain close contact with parents and family. Roughly eight-in-ten say they talked to their parents in the past day. Nearly three-in-four see their parents at least once a week, and half say they see their parents daily. One reason: money. About three-quarters of Gen Nexters say their parents have helped them financially in the past year. • Their parents may not always be pleased by what they see on those visits home: About half of Gen Nexters say they have either gotten a tattoo, dyed their hair an untraditional color, or had a body piercing in a place other than their ear lobe. The most popular are tattoos,
  5. 3 which decorate the bodies of more than a third

    of these young adults. • One-in-five members of Generation Next say they have no religious affiliation or are atheist or agnostic, nearly double the proportion of young people who said that in the late 1980s. And just 4% of Gen Nexters say people in their generation view becoming more spiritual as their most important goal in life. • They are somewhat more interested in keeping up with politics and national affairs than were young people a generation ago. Still, only a third say they follow what’s going on in government and public affairs “most of the time.” • In Pew surveys in 2006, nearly half of young people (48%) identified more with the Democratic Party, while just 35% affiliated more with the GOP. This makes Generation Next the least Republican generation. • Voter turnout among young people increased significantly between 2000 and 2004, interrupting a decades-long decline in turnout among the young. Nonetheless, most members of Generation Next feel removed from the political process. Only about four-in-ten agree with the statement: “It’s my duty as a citizen to always vote.” • They are significantly less cynical about government and political leaders than are other Americans or the previous generation of young people. A majority of Americans agree with the statement: “When something is run by the government, it is usually inefficient and wasteful,” but most Generation Nexters reject this idea. • Their heroes are close and familiar. When asked to name someone they admire, they are twice as likely as older Americans to name a family member, teacher, or mentor. Moreover, roughly twice as many young people say they most admire an entertainer rather than a political leader. • They are more comfortable with globalization and new ways of doing work. They are the most likely of any age group to say that automation, the outsourcing of jobs, and the growing number of immigrants have helped and not hurt American workers.
  6. 4 • Asked about the life goals of those in

    their age group, most Gen Nexters say their generation’s top goals are fortune and fame. Roughly eight-in-ten say people in their generation think getting rich is either the most important, or second most important, goal in their lives. About half say that becoming famous also is valued highly by fellow Gen Nexters. This report is drawn from a broad array of Pew Research Center polling data. The main survey was conducted Sept. 6-Oct. 2, 2006 among 1,501 adults – including 579 people ages 18-25. In addition, the report includes extensive generational analysis of Pew Research Center surveys dating back to 1987. Much of the analysis deals with comparisons among the four existing adult generations. For purposes of this report, Generation Next is made up of 18-25 year-olds (born between 1981 and 1988). Generation X was born between 1966 and 1980 and ranges in age from 26-40. The Baby Boom generation, born between 1946 and 1965, ranges in age from 41-60. Finally, those over age 60 (born before 1946) are called the Seniors. These generational breaks are somewhat arbitrary but are roughly comparable to those used by other scholars and researchers. The report is divided into four main sections: (1) Outlook and World View, (2) Technology and Lifestyle, (3) Politics and Policy, and (4) Values and Social Issues. About the Project In coordination with Generation Next, an initiative aimed at studying the lives and opinions of young people, the Pew Research Center for the People & the Press conducted a special survey in September and October 2006. The survey included an oversample of 18-25 year olds, who were reached on both landline and cell phones. To place Generation Next in perspective, this report also draws on the full history of Pew Research Center surveys over the past 20 years, as well as exit poll analysis and census data on youth voting patterns. For more details on the Gen Next survey and other data sources, see pages 42-43.
  7. 5 I. OUTLOOK AND WORLD VIEW Enjoying Life Young adults

    are generally content with their lives today. They are not overly stressed about conditions in the nation, and they are extremely optimistic about the future. About a third of Generation Nexters (34%) characterize their quality of life as excellent, and fully 84% say their life is excellent or good. Just 14% say their quality of life is only fair or poor. Similarly, 30% of young people say they are very happy with the way things are going in their lives these days, while 63% say they are pretty happy. These older teens and twenty-somethings also are quite content with most specific aspects of their personal lives. More than nine-in-ten are satisfied with their family life (93%) and their relationships with their parents (91%). More than eight-in-ten are satisfied with their housing situation (82%) and the amount of free time they have (81%). Even in their financial lives, these young people are relatively content. Roughly eight-in-ten (78%) say they are satisfied with their standard of living. Among Gen Nexters who are working either full or part-time, 82% say they are satisfied with the kind of work they do. Job satisfaction is slightly higher among working Generation Xers (people ages 26-40) and Baby Boomers (those ages 41-60). Two- thirds of young people (66%) are satisfied with their incomes, which is slightly lower than the proportion of older people expressing that view. When it comes to the state of the nation, Gen Nexters are fairly positive as well. More than four-in-ten (43%) say they are satisfied with the way things are going in the country today; 52% are dissatisfied. Older Americans have a more negative view of conditions in the country – 31% are satisfied with the way things are going, while 62% are Life is Good ----------Age---------- 18-25 26-40 41-60 61+ Quality of life* % % % % Excellent/Good 84 81 83 82 Only fair/Poor 14 18 17 16 Don’t know 2 1 * 2 100 100 100 100 How are things in your life?** Very happy 30 34 36 40 Pretty happy 63 52 51 42 Not too happy 6 13 11 16 Don’t know 1 1 2 2 100 100 100 100 Percent satisfied with...*** Family life 93 93 90 88 Housing 82 87 88 93 Free time 81 79 78 78 Standard of living 78 80 75 83 Job^ 82 87 87 -- Income 66 71 69 74 ^ Based on those who are employed. Sources: * Pew Social Trends, Feb. 2006 ** 2006 Gen Next Survey *** Pew Social Trends, Oct. 2005
  8. 6 dissatisfied. In addition, young people are more optimistic about

    their own futures and about the world that today’s youth will inherit. When asked to envision their lives five years from now, 74% of Gen Nexters put themselves on the top three rungs of a 10-step imaginary ladder (where 10 represents the best possible life), 8% place themselves on the middle of the ladder, and 10% put themselves on the lower end of the ladder. Older age groups have a less optimistic view of their futures. Among those over the age of 25, nearly six-in-ten (59%) picture themselves at or near the top of the life ladder in five years, 13% see themselves in the middle of the ladder, and 15% think they will be at the lower end of the ladder. By a margin of 45%-39%, Gen Nexters say the children of today will be better off when they grow up, as opposed to worse off, than people are now. The balance of opinion is more negative among older age groups: Just a third of those ages 26 and older think life will be better when today’s kids grow up, compared with 52% say life will be worse. Older age groups may be pining away for the good old days. Among those over the age of 25, 70% say that life was better for young adults twenty years ago; only 23% say it is better to be a young adult today. Gen Nexters are more evenly divided on this issue: 50% say it is better to be a young adult today, while 45% say it was better 20 years ago. Gen Next More Optimistic ---Age--- Expectations for 18-25 26+ your life five % % years from now...* High (best) 74 59 Medium 8 13 Low (worst) 10 15 Don’t know 8 13 100 100 When today’s children grow up life will be...** Better 45 33 Worse 39 52 Same 4 4 Don’t know 12 11 100 100 Sources: * Pew Social Trends, June 2006, based on 10-point scale with ratings of 8-10 coded as High, 6-7 as Medium, and 0-5 as Low. ** Pew Social Trends, Feb. 2006 How is Life Better Today? (Based on 18-25 year-olds) Young adults Young adults today have 20 years ago (Vol.) it better had it better Same DK When it comes to... % % % % Getting a good education 84 12 2 2=100 Getting a high paying job 72 23 3 2=100 Having sexual freedom 66 25 4 5=100 Living in an exciting time 64 27 7 2=100 Bringing about social change 56 35 4 5=100 Enjoying financial security 47 44 4 5=100 Buying a house 31 62 3 4=100 Source: 2006 Gen Next survey
  9. 1In the 1990 survey Gen Xers were asked to compare

    their life to young adults in the 1960s and 1970s. 7 By wide margins, Generation Nexters say they have better educational opportunities and a better chance at getting a high paying job than young adults did 20 years ago. Majorities also believe they have more sexual freedom, live in a more exciting time, and are more able to bring about social change compared with young adults 20 years ago. The two areas where Gen Nexters are more skeptical that young people have it better today than in the 1980s involve financial matters. Less than half (47%) of today’s young people say they have a better chance at enjoying financial security than did young people in the 1980s while 44% say young people back then had the edge in this regard. And just 31% say it is easier for young adults today to buy a house; 62% think it was easier twenty years ago. A Time/CNN survey conducted in 1990 provides some interesting insight into how Generation Next differs from Generation X when they were young. Gen Nexters are much more likely to believe they are living in an exciting time than were Gen Xers in 1990 (64% vs. 50%, respectively).1 Gen Nexters are also more apt to say they have greater sexual freedom: 66% vs. 54% of Gen Xers in 1990. In addition, Gen Nexters feel somewhat more empowered in terms of their ability to bring about social change: 56% vs. 48% of Gen Xers in 1990. The two areas where Generation X had a slightly more positive view of their abilities and opportunities involve personal finances. Gen Xers were somewhat more optimistic than today’s young people about their ability to obtain a high-paying job. Nearly eight-in-ten of those questioned in the 1990 survey (79%) said they had a better shot at this than the young people living in the 1960s and 1970s. This compares to 72% of Gen Nexters. Similarly, Gen Xers had a slightly more positive view of their generation’s prospects for financial security. Imagining the Good Old Days: Gen Next vs. Gen X 1990 2006 Compared w/ 20 years ago Gen X* Gen Next** Diff young people have it better... % % Living in an exciting time 50 64 +14 Having sexual freedom 54 66 +12 Bringing about social change 48 56 +8 Buying a house 28 31 +3 Getting a high paying job 79 72 -7 Enjoying financial security 53 47 -6 Sources: * 1990 Time/CNN survey; ** 2006 Gen Next survey
  10. 8 Worries and Challenges As is the case for many

    Americans, money is a source of worry for Gen Nexters. When asked to name the most important problem facing them in their lives today, 30% of Nexters mentioned financial issues including bills, debt and the cost of living. This was also the top concern of those over age 25. The second biggest concern for young people is education. Nearly one-in-five (18%) say getting into college, paying for tuition, handling the workload and graduating are among their most important problems. Young people also worry about their jobs and careers: 16% name finding a job, career advancement, job security and job satisfaction as their most important problem. This is less of a worry for older Americans; just 6% name job-related issues as their most important problem. Beyond financial concerns, the problems young people face are dictated largely by their stage in life. For instance, they are much less focused on health care concerns and family and relationships than are older Americans. Just 2% of Gen Nexters cite a health concern as their most important problem, compared with 15% of those over age 25. Similarly among the older generations, 13% mention family issues such as raising children, childcare, aging parents and marriage as their biggest worries. Only 7% of young people cite these issues. Older people also are slightly more focused on national and international problems than are young people. Among those over age 25, 8% named issues such as the economy, the war in Iraq, terrorism, gas prices, and politics when asked about their most important problem. Only 2% of Gen Nexters mentioned these types of issues. By contrast, Nexters are somewhat more focused on personal or internal issues than are older generations. Nearly three-quarters (74%) of 18-25 year-olds named an issue in their own life when asked about their most important problem; only 2% mentioned something that related to the outside world. Among older Americans, 65% cited an internal problem and 10% pointed to an external problem. Most Important Problem ----Age---- Most important 18-25 26+ problem facing you... % % Money/finances/debt 30 27 College/education 18 1 Career/job 16 6 Family/relationships 7 13 Miscellaneous 5 7 Health 2 15 Nat’l/Int’l conditions 2 8 Other 7 8 No problems 12 15 Don’t know 5 4 Source: 2006 Gen Next Survey. Figures add to more than 100% due to multiple responses.
  11. 9 A Unique Generation? A majority of those ages 18-25

    (68%) see their generation as unique and distinct from other generations. This sentiment is held by young people across the board – men, women, conservative, moderate, white and non-white. Gen Nexters are more apt to say their own generation is unique than they are to say the same of the generation that came just before them. Only 44% of Nexters say those who are in their 30s today are part of a unique or distinct generation, 53% say they are not. While most Gen Nexters see themselves as part of a unique generation, they are hard- pressed to come up with a word or phrase to describe their generation. In fact, they had an easier time describing their parents’ generation than they did their own. Survey respondents were asked to give one word or phrase that best describes their generation. No single response was offered by more than a handful of Gen Nexters. The words and phrases they used varied widely, ranging from “lazy” to “crazy” to “fun.” When asked to describe their parents’ generation, Nexters used words like “hard-working,” “conservative” and “hippie.” Generation Next is not the only generation that lacks a clear identity. Even those in the Baby Boom generation (age 41-60) seemed hard-pressed to answer the question: roughly 10% of them offered up the term “Baby Boomer” when asked what one word or phrase best described their generation. Beyond that, there was not a great deal of agreement, even among this group. Heroes and Role Models When asked who they admire most, aside from friends and family members, Nexters cast a fairly wide net. They tend to point to people with whom they have personal relationships rather than the famous. For older generations, it is just the opposite. Well-known figures come to mind more readily than close contacts. A quarter of 18-25 year-olds name a person who is close to them as the person they admire most. For many (12%) it is a teacher, professor or mentor. Others point to their boss, a family member, a friend, or a significant other (3% for each). Among the older generations, only 11% name someone with whom they have a close personal relationship. Many Nexters also admire entertainers; 14% named a famous personality when asked who they admire most. Athletes, actors, singers and TV personalities are among the list of entertainers
  12. 10 offered up by young people. Overall, entertainers trump political

    leaders as admired figures among Nexters by nearly a two-to-one margin. Only 8% of young people named a current or former elected official when asked who they admire most. Politicians are much more popular with the older generations (20%). Among both young and old Americans, George Bush, Bill Clinton and Jimmy Carter were mentioned most often. Ronald Reagan made the older generation’s list of most admired people, but he was not mentioned by a single Gen Nexter. Non-presidents who were mentioned include Hillary Clinton, Condoleezza Rice, Colin Powell and Al Gore. Some Gen Nexters mentioned spiritual leaders when asked whom they admire most (6%). Among those named were a pastor or priest, God or Jesus, Mother Teresa, and the Dalai Lama. Spiritual leaders were much more popular among the older generations – 15% of those over age 25 named a religious figure when asked whom they admire most. Among older Americans, pastors, priests and ministers were mentioned most often (8%). A Critical Self-Portrait Gen Nexters offer some fairly harsh assessments about how their behavior and lifestyle compares with the generation that preceded them. A strong majority (75%) say today’s youth are more likely to have casual sex than were young people 20 years ago. Only 7% of Nexters say their generation has less casual sex and 17% say they have about the same amount. Seven-in-ten Nexters say today’s youth resort to violence to solve conflicts more often than the previous generation. And nearly as many Nexters say they engage more often in binge drinking (69%) and illegal drug use (63%) when compared to their predecessors. Whom Do You Admire Most? ----Age---- 18-25 26+ % % People you know 25 11 Teacher/Professor/Mentor 12 2 Boss 3 3 Family member 3 1 Entertainers 14 11 Athletes 4 1 Singers 3 2 Actors 3 1 Political leaders 8 20 George Bush 3 9 Bill Clinton 1 2 Jimmy Carter * 1 Spiritual leaders 6 15 Pastor/Priest/Minister 3 8 God/Jesus Christ/Lord 3 4 Mother Teresa * 1 Soldiers/servicemen 1 2 Business leaders 1 1 Historical figures 1 1 International political leaders * 1 Other 9 7 None 19 16 Don’t know 16 15 100 100 Source: 2006 Gen Next Survey. Top three responses for Gen Next within each net category shown.
  13. 11 Nexters think young adults 20 years ago were more

    conscientious than themselves when it came to civically- minded activities. Fully 49% of Nexters say their generation votes less often than the youth of the 1980s. Only 34% of Nexters say their generation vote more than young people did 20 years ago, 14% see no difference. Similarly, 42% of Nexters they say they do less community service and volunteering than the generation that preceded them, 37% say they do more. Looking Ahead: Marriage, Children An overwhelming majority of Gen Nexters believe in planning ahead for life. More than eight-in-ten (82%) say when a person reaches the mid-20s, it is important for them to have a good plan for what they are going to do with the rest of their lives; only 16% say it is really not necessary for someone at this stage of life to have a clear-cut plan. Opinions on this issue are remarkably stable across generations. Roughly eight-in-ten Generation Xers, Baby Boomers and Seniors say people in their mid-20s need to have a good life plan. While most Gen Nexters are not yet married (85%), the vast majority hope to marry some day. Among the unmarried, 57% say they definitely want to get married and 28% probably want to marry. Only 12% say they probably or definitely don’t want to get married. In the 1990 Time/CNN poll, 25% of 18-25 year-olds said they were married; this compares with 15% today. The percent who believe marriage is difficult has remained unchanged. Today 65% of 18-25 year-olds say it is hard to have a good marriage, compared with 20% who say it is easy. In 1990, the margin was similar: 62% said marriage is hard, 22% thought it was easy. Roughly one-quarter of Gen Nexters (27%) have children of their own. Among those who do not have kids, a large majority say they would like to some day (52% definitely want to have children, another 34% probably do). Where Gen Next Falls Short (Based on 18-25 year-olds) Compared with young adults twenty years ago... Your Your (Vol.) generation generation No does more does less difference DK % % % % Casual sex 75 7 17 1=100 Resort to violence to solve conflicts 70 13 15 2=100 Binge drinking 69 6 23 2=100 Illegal drug use 63 14 21 2=100 Community service/ volunteer activity 37 42 19 2=100 Voting in elections 34 49 14 3=100 Source: 2006 Gen Next survey.
  14. 12 Gen Next’s Goals: Fortune and Fame When asked not

    about themselves but about their generation, most 18-25 year-olds say getting rich and being famous are important goals for people in their age group. Nearly two-thirds (64%) of Nexters say getting rich is the most important goal in life for their generation, another 17% say this is the second most important goal. One-in-ten Nexters say their generation’s most important goal is to be famous, another 41% say this is their next important goal. Further down on the list is helping people in need (12% say this is their generation’s most important goal), being leaders in their community (7%) and becoming more spiritual (4%). Generation Xers have a different view of their generation’s life goals. Among those age 26-40, getting rich is still perceived to be the top goal of their generation. However, this age group puts much less emphasis on wealth and being famous when compared with Generation Next, and more emphasis on leadership and spirituality. Talking about My Generation’s Goals Gen Next Gen X Your generation’s most (18-25) (26-40) important goals in life? % % To get rich 81 62 To be famous 51 29 To help people who need help 30 36 To be leaders in their community 22 33 To become more spiritual 10 31 None of these (Vol.) 2 2 Don’t know (Vol.) 1 1 Source: 2006 Gen Next Survey. Respondents were asked to choose the most important and next most important goals from these five options.
  15. 13 SECTION II: TECHNOLOGY AND LIFESTYLE Technology Use Generation Nexters

    have also been called the “DotNet” generation, because they grew up with the internet. This generation’s relationship with technology is truly unique. Young people have adopted new technologies and are using them to both expand their social networks and maintain contact with their families and friends. More than any other generation, Gen Next recognizes the positive aspects of the technology revolution. However, they also readily acknowledge its drawbacks. Overall, almost all Gen Nexters (86%) use the internet at least occasionally. In this regard they are no different from Gen Xers, 91% of whom say they use the internet. Roughly three- quarters of Boomers (73%) use the internet, as do just 46% of Seniors. Among Gen Nexters, internet usage varies by education. Nearly all college graduates in this age category use the internet on at least an occasional basis, but only 77% of those who have not attended college do so. Where Gen Nexters clearly stand out is in their deployment of real-time technologies such as instant messaging and text messaging. About half of Gen Nexters (51%) say they sent or received a text message on a cell phone during the 24-hour period before they were interviewed. This compares with 26% of Gen Xers, 10% of Boomers, and 4% of Seniors. Similarly, 29% of Nexters sent or received an instant message, compared with 22% of Xers, 12% of Boomers and 7% of Seniors. Email and Beyond In the past 24 hours ----------Age ---------- did you... 18-25 26-40 41-60 61+ Send/receive email % % % % Yes 50 61 52 32 No 38 30 22 18 Not an internet user 12 9 26 50 Don’t know 0 0 * 0 100 100 100 100 Send/receive a text message on a cell phone Yes 51 26 10 4 No 49 73 90 96 Don’t know * 1 0 * 100 100 100 100 Send/receive an instant message Yes 29 22 12 7 No 59 69 62 43 Not an internet user 12 9 26 50 Don’t know 0 0 * 0 100 100 100 100 Source: 2006 Gen Next survey.
  16. 14 Social Networking Sites Beyond sending messages over the internet

    or via cell phone, Gen Nexters are expressing themselves by utilizing increasingly popular social networking sites like Facebook, MySpace and MyYearbook. More than half of Gen Nexters (54%) have used one or more of these social networking sites, and 44% have created a profile. Not surprisingly, Nexters are more likely than other generations to say they posted a message to someone else’s personal online profile within the last day. About one-in-five 18-25 year-olds (21%) posted a message, compared with 15% of Gen Xers, and just 3% of those over age 40. Among those Gen Nexters who use social networking sites, 38% say they do so at least once a day, 38% use them at least once a week, and 24% use them every few weeks or less often. Regardless of whether or not they utilize social networking sites, three-quarters of Nexters say that most people they know use them. Of this group, a majority (54%) believes that people who visit these sites spend too much time on this. In addition, a large majority of young people (72%) feel that their fellow Gen Nexters post too much personal information on the internet. Just 19% say people around their age post the right amount of personal information, while 4% say young people post too little information about themselves online. Young women are more skittish than young men about the amount of personal information being posted online: 78% of young women, and 67% of young men, say too much personal information is posted on the web. When asked whether personal information about themselves has been posted on the internet by other people, the vast majority of Gen Nexters (88%) say they do not think this has happened. Connecting Socially Through Technology All 18-25 18-25 users* Have you ever used a social % % networking website? 54 100 Created a personal profile? Yes 44 82 No 10 18 How often do you use? At least once a day 21 38 At least weekly 20 38 Less often 13 24 Have not used websites 34 -- Don’t use internet 12 -- 100 100 Do most people you know use social networking websites? Yes 75 91 No 21 7 Don’t know 4 2 100 100 Do you think people around your age post too much personal information on these websites? Too much 72 73 Too little 4 3 Right amount 19 22 Don’t know 5 2 100 100 Ever dated someone you met online? Yes 12 20 No/not online 88 80 100 100 Number of cases (579) (329) * Those who have used a social networking website. Source: 2006 Gen Next Survey.
  17. 15 Aside from communicating in cyberspace, the internet has become

    a way for people to connect face-to-face. Overall, 6% of Americans say they have gone out on a date with someone they met online. Not surprisingly, this is much more common among younger generations: comparable percentages of Gen Nexters (12%) and Gen X (11%) say they have dated someone they met online, compared with 4% of Boomers and even fewer Seniors (1%). Technical Advancements: The Good and the Bad Progress can come at a price, and the public recognizes that new technologies have impacted society in both positive and negative ways. Thinking about the potential effects of new technology such as the internet, instant messaging, cell phones, text messaging, and iPods, solid majorities of the general public says these new technologies make people lazier (70%), make people more isolated (65%), and cause people to waste time (65%). On the upside, 65% say these new tools makes people more efficient and 56% say it can bring people closer to their families and friends. Only 45% say technology makes it easier to make new friends. There are important generational differences on the impact of technology. Because so many young people use technology to communicate, they are much more likely to see its advantages in terms of fostering relationships. Nearly seven-in-ten Gen Nexters (69%) say the new technologies make it easier to make new friends. This compares with 53% of Xers and less than 40% of Boomers and Seniors. Equal percentages of Nexters and Xers believe new technology can help strengthen the ties with old friends and family (64% each). Boomers and Seniors are less convinced of this (52% and 47%, respectively, agree). Gen Nexters are more concerned than any other age group that technology makes people lazier. When it comes to technology’s impact on productivity, there are very few differences by age. Technology’s Impact – Negative and Positive ----Age---- % who say new technologies... 18-25 26+ Make people lazier 84 67 Make people more isolated 67 65 Make people waste time 68 65 Make people more efficient 69 64 Make you closer to old friends & family 64 54 Make it easier to make new friends 69 41 Source: 2006 Gen Next survey.
  18. 16 Work and Finances Because of their age and stage

    in life, work is presently less central to the lives of many Gen Nexters. Nearly half of them (46%) are still in school and presumably have not settled on a career path. Many of them are working and going to school, and their schedules are both flexible and unpredictable. Of those who are working, most (59%) have been in their current job for a year or less, and relatively few (21%) say it is very likely they will stay with their present employer for the rest of their working life. Among Gen Nexters who are working at least part- time, 38% have professional or business-related jobs, compared with 51% of those over age 25. Roughly a quarter (26%) are in clerical or office support jobs. Nexters work in all kinds of places – offices, factories, hospitals, and schools. They are nearly three times more likely than their older counterparts to work in a store or restaurant. The vast majority of working Nexters (71%) are paid an hourly wage; just 13% are paid a salary. Among workers age 26 and older, 46% are paid hourly and 43% are salaried. Only 53% of Nexters who are employed receive health care benefits from their employer. Older workers are much more likely to receive health benefits (71%). (Among all Gen Nexters, 67% are covered by some form of health insurance; this compares with 86% of those over age 25). Nexters also are less likely to work a regular 9-to-5 schedule than are older workers: fully 45% say they work night and weekends, compared with 32% of older workers. Not surprisingly, a large majority of Gen Nexters who are employed (70%) do not think they Profile of the Young Worker (Based on those who are employed full-time or part-time) ----Age---- 18-25 26+ What do they do? % % Professional/business 38 51 Clerical/Office worker 26 11 Skilled trade 16 15 Service worker 10 11 Other 9 10 Don’t know 1 2 100 100 Where do they work? Office 30 33 Store, restaurant, retail 23 8 Outdoor work site 15 12 Factory 10 14 School 7 11 Hospital 5 9 Home 5 5 Somewhere else 4 7 Don’t know 1 1 100 100 How are they paid? Salary 13 43 Hourly 71 46 Commission 9 6 Other 7 5 Don’t know 0 * 100 100 Do they have health benefits? Yes 53 71 No 30 14 Self-employed 17 15 Don’t know 0 * 100 100 Do they work nights & weekends? Yes 45 32 No 48 63 No set schedule 6 5 Don’t know 1 * 100 100 Source: Pew Social Trends, June 2006
  19. 17 make enough money to lead the kind of life

    they want, while only 30% say they do make enough money. Among those over age 25, far fewer (46%) say they do not make enough money to lead the kind of life they want. However, Gen Nexters are very optimistic about their future earning power. Very few working Nexters (5%) say they will not make enough money in the future. A Changing Workplace Work life in America has changed dramatically in recent years with globalization, the advent of new communications technologies, and the influx of immigrant workers. Gen Nexters view several of the biggest changes much more positively than do older Americans. A strong majority of the public (69%) believes email and other new ways of communicating on the job have done more to help American workers than hurt them. Young people are the most enthusiastic about this trend. Fully 88% say these new means of communication have helped workers, compared with 79% of Gen Xers, 67% of Boomers and 47% of Seniors. Automation of jobs through new technology in the workplace is viewed positively by 45% of the public. Gen Nexters and Gen Xers have a more positive view of automation than do Boomers and Seniors. More than four-in-ten Gen Nexters (45%) view the growing number of immigrants working in this country as a positive change. Among older workers, far fewer say immigrants have helped American workers overall. The generation gap is even larger on the issue of increased outsourcing of jobs to other countries – while 41% of Gen Nexters say this has helped American workers, only about 10% of those over age 25 agree. The opinions of Nexters on these issues may well change once they are established in a job and feeling the pressures of the modern workplace. Views of Today’s Workplace Has each helped or hurt American workers? ----------Age---------- Email and new ways 18-25 26-40 41-60 61+ of communicating % % % % Helped 88 79 67 47 Hurt 8 14 21 24 Not much effect/DK 4 7 12 29 100 100 100 100 Automation of jobs Helped 54 50 43 40 Hurt 39 38 48 40 Don’t know 7 12 9 20 100 100 100 100 Growing number of immigrants Helped 45 33 23 18 Hurt 46 50 60 63 Don’t know 9 17 17 19 100 100 100 100 Outsourcing of jobs Helped 41 16 9 7 Hurt 53 76 84 82 Don’t know 6 8 7 11 100 100 100 100 Source: Pew Social Trends, June 2006.
  20. 18 Family Ties Gen Nexters are very closely connected to

    their families. Many live close to home – in fact, 40% still live with their parents – and they have frequent contact with their parents and siblings. None of this is surprising given that most Gen Nexters have not started their own families yet. Presumably, the apron strings will loosen as they become financially independent and take on family responsibilities of their own. The parent-child bond is strong across generations. When asked “which family member do you have the most contact with” (other than your wife/husband/partner), more than six-in-ten (63%) Gen Nexters say they talk with their parents most often. Gen Xers are also closely connected to their parents – 53% say they have the most contact with a parent. For the older generations, Boomers and Seniors, children are named as the relative with whom they have the most contact. When asked to choose which parent they have the most contact with Nexters point to their mother, by a three-to-one margin. Contacting the Folks About half of all respondents (54%) say they see their parents at least once a week, but that figure rises to 73% for Gen Nexters. Among this age group, fully half see their parents daily. Nearly as many Nexters speak by telephone to a parent every day and another 40% maintain weekly contact. Some 82% mentioned talking with a parent yesterday. Roughly one-in-five Gen Nexters (21%) email their parents at least occasionally. Gen Family Member In Closest Contact ---------Age--------- Total 18-25 26-40 41-60 61+ % % % % % Parent 33 63 53 24 3 Mother 26 48 41 20 * Father 7 16 13 4 3 Both 1 2 1 * 0 Child 34 2 12 41 71 Sibling 20 19 22 24 13 Other 10 14 10 8 9 Source: Pew Social Trends, October 2005. Percentages can total more than 100% due to multiple responses. Staying in Touch with Parents ---------Age--------- How often are Total 18-25 26-40 41-60 61+ you in touch... % % % % % In person Daily 24 50 19 15 20 Weekly 30 23 32 31 37 Monthly 15 12 15 17 13 Less often 31 14 34 37 28 Don’t know * 1 0 0 2 100 100 100 100 100 By telephone Daily 32 45 32 26 32 Weekly 47 40 51 49 26 Monthly 11 8 10 14 15 Less often 8 5 6 10 19 Don’t know 2 2 1 1 8 100 100 100 100 100 By email Yes 24 21 33 18 3 No 76 79 67 82 95 Don’t know * 0 0 * 2 100 100 100 100 100 Source: Pew Social Trends, October 2005.
  21. 19 Xers utilize this form of communication more frequently than

    Nexters; a third email their parents. Turning to Family for Help Not only do Gen Nexters keep in close contact with their parents, they rely on them for advice and assistance. Respondents were asked in an open-ended question, who they turn to for advice when they have a serious personal problem. Gen Nexters were more likely than any other age group to say they turn to their families – primarily their mothers – for their advice: 64% said they turn to family, compared with 54% of Gen Xers, 38% of Boomers, and 36% of Seniors. Many (22%) also turn to friends, neighbors and co-workers. Here there are no differences across generations. Gen Nexters are among the least likely to say they turn to religious advisors, religious scriptures or some higher power for advice. Gen Nexters also rely on family for more concrete types of assistance. Fully 46% say they depend on their parents or other family members for financial assistance. Nearly three-quarters (73%) say they have received financial help from their parents during the past 12 months. And 64% say their parents have helped them out with errands, housework and home repairs. In both of these categories, Gen Xers and Boomers are receiving much less assistance from their parents. Only 33% of Xers and 19% of Boomers got financial help from their parents in the past year. Changing Family Dynamics Recent trends in divorce rates and smaller family sizes have clearly impacted the lives of both Gen Next and Gen X. Among those with both parents living, 38% of Gen Nexters and 36% of Xers have parents that are divorced or separated. As divorce has become more common, the number of blended families has grown, and as a result the younger generations are more likely than the older ones to have stepparents and step-siblings who play an important role in their lives. More than one- in-five Nexters (21%) and 19% of Xers have a living stepparent who is important to them. Similarly, 14% of Nexters and 11% of Xers have stepbrothers or stepsisters who have played an important role in their lives. Parents Helping Out ------Age------ Received from parent 18-25 26-40 41-60 in the past 12 months... % % % Gifts 85 76 68 Financial help 73 33 19 Help with errands 64 48 27 Source: Pew Social Trends, October 2005. Based on those with at least one parent living.
  22. 20 A Day in the Life of Gen Next Overall,

    44% of Gen Nexters are employed full-time; another 26% work part-time. In addition, nearly half (46%) are currently enrolled in school – 11% are in high school or technical school, 32% are in college and 3% are in graduate school. Many Nexters are working and attending school: 19% go to school and work part-time and 12% are juggling full- time work and school. Most of the Nexters who are not currently enrolled in school plan to resume their education at some point in the future. Nearly seven-in-ten (68%) say they will return to school; 28% say they have no plans to return. Gen Nexters are an active bunch. Fully 81% say they exercise on at least a weekly basis. Young men are somewhat more likely than young women to exercise (85% vs. 78%). Among all Gen Nexters, 20% say they are in excellent physical condition, and another 56% say they are in good condition. Not surprisingly, Gen Next and Gen X view themselves as more physically fit than do Boomers or Seniors. However, the older generations are just as likely as the younger ones to say they do some type of exercise program that helps them keep physically fit. In their free time, Gen Nexters also engage in some activities that are not necessarily good for their health. About four-in-ten (41%) say they consumed alcohol in the past seven days; 31% smoked cigarettes; and 9% say they took illegal drugs. Young men are bigger drinkers and smokers than young women – 48% of men drank alcohol in the past seven days, compared with 34% of young women; 37% of the men and 25% of the women say they smoked cigarettes in the past week. Today’s youth play a lot of video games. Nearly half (49%) say they play games that can be hooked up to a television such as PlayStation, Xbox or GameCube. Roughly one-third of Gen Xers A Busy Schedule Percent of 18-25 year-olds who... % Are in school/plan to return to school 83 Are currently enrolled in school 46 Work full-time 44 Work part-time 26 Are in school & working full-time 12 Are in school & working part-time 19 Source: 2006 Gen Next survey. The Lifestyle Gender Gap Age 18-25 In the past Men Women seven day, did you... % % Exercise 85 78 Drink alcohol 48 34 Play video games 51 21 Smoke cigarettes 37 25 Take illegal drugs 10 7 Source: 2006 Gen Next survey.
  23. 21 (35%) play these types of games. Very few Boomers

    and Seniors spend time playing video games (12% and 3%, respectively). Just over one-third of Nexters (36%) say they played video games in the past seven days. The gender gap on this measure is substantial. Fully half of young men (51%) played video games in the past week compared with 21% of women. Gen Nexters are also big movie-goers. About one-in-ten (11%) say they go out to the movies once a week or more, and 47% say they do so at least once a month. Older generations go out to movies much less frequently – 28% of Gen Xers, 22% of Boomers and 14% of Seniors go to movies at least monthly. When they watch movies at home, Nexters usually rely on DVDs or videos rather than what is being offered on cable or broadcast TV. More than three-quarters of Nexters (77%) say their favorite way to watch a movie at home is watching a DVD or video, while only 17% say they watch movies that are on television. Altering Their Appearance Gen Nexters are not afraid to express themselves through their appearance. About half of them (54%) have either gotten a tattoo, dyed their hair an untraditional color or had a body piercing in a place other than their ear lobe. Among those three, tattoos are the most popular form of expression: 36% of Nexters have one. Tattoos are just as prevalent among Gen Xers – 40% of them have a tattoo. There are no significant gender differences for tattoos among either generation. Roughly a quarter of both Gen Nexters and Gen Xers have dyed their hair an untraditional color. Gender is not a factor here either – men and women are just as likely to have dyed their hair. Body piercing is slightly more prevalent among Gen Next than among Gen X. Three-in-ten Nexters have had a piercing somewhere other than their ear, compared with 22% of Xers. Among both generations, more women than men have pierced themselves The generational divide on these measures is between those under age 40 and those over age 40. Among the over 40 crowd, just 21% have engaged in any of these activities. Tattoos and More --------Age-------- Do you currently have or 18-25 26-40 41-64 have you ever had... % % % A tattoo Yes 36 40 10 No 64 60 90 100 100 100 Dyed hair an untraditional color Yes 25 24 10 No 75 76 90 100 100 100 A piercing other than ear lobe Yes 30 22 6 No 70 78 94 100 100 100 Source: 2006 Gen Next survey. These items were not asked of respondents over age 64.
  24. 22 Things People Do Young people have always pushed the

    envelope in terms of what is morally right and wrong. Today’s youth are no exception. The Gen Next survey presented respondents with a series of behaviors and activities that are either illegal, such as smoking marijuana, or may be considered risky or unwise, like consuming a lot of alcohol. Respondents were asked whether each is okay “for other people to do,” even it is something they might not do themselves. Gen Nexters stand out from other generations on one measure in particular. They are much more accepting when it comes to downloading or sharing music or video files without paying for them – 46% of Nexters said this was okay, compared with 28% of Xers and less than 20% of Boomers and Seniors. Gambling is acceptable to a large majority of Gen Nexters – 67% say it is okay for other people to gamble. Among Xers and Boomers, roughly 60% agree. Seniors are less keen on gambling – only 41% think it is okay. Nexters and Xers see eye-to-eye on the issue of drinking a lot of alcohol. Three-in-ten Nexters and 27% of Xers say it is okay to drink a lot of alcohol. This compares with 14% of Boomers and 8% of Seniors. In spite of the fact that it is illegal, smoking marijuana is actually more acceptable overall than drinking a lot. Fully 41% of Gen Nexters say it is okay for other people to smoke marijuana. Among Gen Xers and Boomers, 35% agree. Seniors take a more skeptical view of smoking marijuana; just 11% find it acceptable for others to smoke pot. Religion and Generation Next A plurality of Gen Nexters (44%) identify themselves as Protestants, one- quarter are Roman Catholic, and less than 10% are affiliated with some other religion, according to data compiled from all Pew Research Center surveys in 2006. The combined 2006 data also show that nearly as many Gen Next Christians as older Christians describe themselves as “born again” or evangelical Christians (36% vs. Religious Affiliation 1987-1988 2006 18-25 26+ 18-25 26+ Religious Preference % % % % Protestant 52 60 44 55 Catholic 29 25 25 25 Jewish 2 2 2 2 Other 6 5 7 5 No religion/Atheist/Agnostic 11 8 20 11 Don’t know 0 0 2 2 100 100 100 100 Source: 1987-1988 Pew Values Surveys; 2006 Pew compiled surveys.
  25. 23 39%). However, 20% of today’s 18-25 year-olds say they

    have no religious affiliation or are atheist or agnostic. Only 11% of those over age 25 fall into this category. The gap between young and old has increased substantially over time. In the late 1980s, 11% of young people were non-religious, compared with 8% of those over age 25. Gen Nexters are among the least likely to attend church regularly: 32% attend at least once a week compared with 40% of those over age 25, and 16% say they never attend (compared with 12% among the older age groups). In terms of religion and public life, Gen Nexters are divided about whether churches should keep out of political matters or express their views: 43% say churches should keep out and 54% say they should express their views. Nexters views on this issue are nearly identical to Gen Xers and Boomers. It is the oldest age group, arguably the most religious, that leans toward saying the church should keep out of political matters (52% keep out vs. 44% express views). Even so, Nexters are among the most likely to say the will of the American people, not the Bible, should be a more important influence on U.S. laws. Gen Next Rejects Creationism There is a clear generational divide on the issue of evolution. Nearly two-thirds of Nexters (63%) believe humans and other living things evolved over time, while only 33% say all living creatures have existed in their present form since the beginning of time. Gen Xers share a similar perspective, though they are slightly more open to the idea of creationism. Here the generational divide is among those under age 40 and those over age 40. Baby Boomers and Seniors are more closely divided over how the world came to be. Evolution vs. Creationism ----------Age---------- 18-25 26-40 41-60 61+ Humans and other living things... % % % % Have evolved over time 63 57 47 42 Have existed in their present form since the beginning of time 33 39 46 45 Don’t know 4 4 7 13 100 100 100 100 Source: Pew July 2006 Religion Survey.
  26. 2 It is not clear at this point whether voter

    turnout among young people was up in 2006. Preliminary data from the 2006 Exit Poll is not conclusive, and 2006 Census data has not yet been released. 24 III. POLITICS AND POLICY Youth Voting Generation Next showed in 2004 that it is a political force to be reckoned with. Traditionally, young people have been among the least likely to vote. Electoral participation generally increases with age, peaking at about age 68 and then falling sharply. In addition, while overall voter turnout has remained fairly stable in recent decades, there has been a slow decline in turnout among young voters. The result has been that the gap in turnout between young voters and the rest of the electorate has widened over time. In 1972, 70% of those ages 25 and older turned out to vote compared with 55% of those ages 18-24 – a gap of 15 percentage points. By 2000 that gap had increased to 28 points, as 70% of older voters turned out and 42% of younger voters did so. This trend was interrupted in the 2004 presidential election. Turnout among young voters increased 12% from 2000 – the biggest increase in any single age group – and the gap between young and older voters narrowed to 20 points. The rise in youth turnout was particularly notable among women and African Americans. Recent research by the Center for Information and Research on Civic Learning and Engagement (CIRCLE) suggests that new voting laws – including Election Day registration, early voting and motor voter registration – contributed to higher voting rates particularly among young people.2 Despite the uptick in voting among young people, this age group still lags behind older generations on basic measures of political engagement. In 2006, fewer than half of Gen Nexters (49%) were certain that they were registered to vote. This compares with 70% of Voter Turnout in Presidential Election Years 1972-2004* 55 48 45 46 42 51 40 42 54 70 69 69 70 67 72 66 70 74 1972 1976 1980 1984 1988 1992 1996 2000 2004 18-24 year olds 25 and older *Source: The Center for Information and Research on Civic Learning & Engagement (CIRCLE) http://www.civicyouth.org
  27. 25 Gen Xers, 83% of Boomers, and 86% of Seniors.

    This pattern has remained consistent over the past decade, with only about half of the youngest age group saying they are registered, compared with a much higher percentage – roughly 75% to 80% – of older Americans. When asked how often they vote, young people also trail behind all other age groups. In the 2004 election cycle, only 22% of 18-25 year-olds said they “always” vote, and another 15% said they “nearly always” vote. Nearly half of young people (47%) report voting “seldom” or “never.” The likelihood of voting clearly increases with age, as each successive age group reports voting with a greater level of frequency, and this pattern has remained consistent over time. Compared with previous generations, regular voting is down slightly among Generation Nexters – just 37% said they always or nearly always voted in 2004. In the late 1980s, when many Generation Xers were in their late teens and early twenties, 44% of 18-25 year olds said they voted always or nearly always. A Sense of Civic Duty? Not only does a smaller share of Generation Nexters vote compared with older age groups, but they feel less committed to the idea of voting. While 62% of the public completely agrees with the statement, “I feel it’s my duty as a citizen to always vote,” only 42% of 18-25 year-olds share this view. Nexters are about twice as likely as the general public to disagree with this statement. In addition, when they do not get around to voting, Gen Nexters don’t feel particularly guilty: 50% say they feel guilty when they don’t get a chance to vote, compared with 63% of Gen Xers and close to 70% of those over age 40. Historical patterns show that as people age, they develop a stronger sense of civic duty. When Gen Xers were young, their attitudes about voting were nearly identical to Gen Nexters today. None of this makes young people feel less efficacious, however. They are right in line with the general public when it comes to feeling that their vote matters. About seven-in-ten Nexters (72%) – and an identical percentage of the public – agree with the statement: “Voting gives people Percent who “Always” or “Nearly Always” Vote 1988 1992 1996 2000 2004 % % % % % Total 69 73 69 67 69 18-25 44 47 41 35 37 26-40 65 67 62 60 63 41-60 79 83 79 75 77 61 and older 84 88 87 87 85 Source: 1988 Pew Values Study. 1992-2004 from Pew annual compiled surveys.
  28. 26 like me some say about how government runs things.”

    Young people also lag behind in their interest in politics and their engagement in the political process. Only one-third of 18-25 year-olds say they follow what’s going on in government and public affairs most of the time. This compares with 54% of those age 26 and older. Similarly, 36% of Nexters completely agree with the statement, “I’m interested in keeping up with national affairs,” compared with 46% of their older counterparts. They are even less interested in keeping up with local politics, though the gap between young and older people is slightly smaller on this issue. When asked if they are generally bored by what goes on in Washington, there is no difference between young and old – 45% of both Nexters and those over age 25 agree Washington politics is boring. They do differ over the degree to which Washington policy affects them. Nearly four-in-ten Nexters (38%) agree that most issues discussed in Washington don’t affect them personally. Only 29% of those over age 25 share this sentiment. There is some evidence that today’s young people may be more politically engaged than Generation Xers were when they were young. While 33% of Nexters said they follow what’s going on in government and public affairs most of the time, only 26% of young people reported doing so in 1987 and 1988. Similarly, 36% of today’s young people say they’re interested in keeping up with national affairs, compared with 24% of the young people polled in the late 1980s. Over this same time period, the entire public has become more engaged, and as a result the gap between young and old has remained fairly consistent. Youth Interest in Politics: Then and Now 1987-1988 2002-2003 Follow what’s going on in 18-25 26+ 18-25 26+ government/public affairs... % % % % Most of the time 26 42 33 54 Some of the time 41 35 37 31 Only now and then 20 15 20 10 Hardly at all 11 6 10 4 Don’t know 2 2 * 1 100 100 100 100 I’m interested in keeping up with national affairs Completely agree 24 35 36 46 Somewhat agree 55 50 44 44 Somewhat disagree 14 11 13 7 Completely disagree 4 2 5 2 Don’t know 3 2 2 1 100 100 100 100 Source: Pew Values Surveys
  29. 27 Young People and the News There are large gaps

    across age groups when it comes to news consumption. Young people read the newspaper, watch television news and listen to news on the radio at much lower rates than their older counterparts. Only 39% of Nexters say they enjoy keeping up with the news “a lot,” and a majority (64%) says they only check in on the news from time to time, rather than watching or listening to the news at regular times (34%). Furthermore, they are among the most likely to say they only tune into the news when something important is happening – whether it be local or national news. In Pew’s 2006 news consumption survey, only 47% of Gen Nexters reported that they read a daily newspaper on a regular basis and even fewer (23%) reported that they had read a newspaper “yesterday” (a more accurate measure of regular readership). Newspaper readership increases across generations with 32% of Gen Xers reporting reading a newspaper yesterday, 44% of Boomers, and 56% of Seniors doing so. A similar pattern can be seen on TV news viewership. The only area where young people equal or surpass their older counterparts in terms of news consumption is in online news. A quarter of Gen Nexters say they got news online yesterday. Even here, however, Gen Xers outpace Nexters – 30% of Xers say they went online for news yesterday. Boomers go online for news as often as Nexters (25%), and Seniors lag behind at 11%. In terms of specific news sources, young people consume less local news and network television news than do older generations. The gap is smaller on cable news channels such as CNN, Gen Next: Occasional News Consumers ----------Age---------- When do you watch/ 18-25 26-40 41-60 61+ listen to the news? % % % % At regular times 34 41 55 64 Check in from time to time 64 57 44 33 Neither/DK 2 2 1 3 100 100 100 100 Follow national news... Only when something important is happening 55 45 43 34 Most of the time 43 53 55 63 Don’t know 2 2 2 3 100 100 100 100 Follow international news... Only when something important is happening 73 65 54 48 Most of the time 26 33 43 47 Don’t know 1 2 3 5 100 100 100 100 Source: Pew 2006 Media Consumption Survey. News Consumption “Yesterday” ----------Age---------- 18-25 26-40 41-60 61+ Did “yesterday” % % % % Read the paper 23 32 44 56 Watched TV news 48 54 57 68 Listened to radio news 23 42 41 28 Got news online 25 30 25 11 Source: Pew 2006 Media Consumption Survey.
  30. 28 MSNBC or the Fox News Channel. One show that

    has a particular appeal to young people is “The Daily Show with Jon Stewart.” Fully 13% of Gen Nexters report watching the show regularly, compared with 6% of the general public. Because young people spend less time following the news, it follows that they are less well- informed about current events. In the same Pew survey, conducted in April and May 2006, Gen Nexters were far behind older generations on a series of information questions. About half (49%) knew that the Republican Party held a majority in the House of Representatives at that time, compared with 67% of those over age 25. In addition just a quarter could identify Condoleezza Rice as the current secretary of state, compared with 46% of older Americans. And even fewer (12%) could name Vladimir Putin as the president of Russia (vs. 35% among the older generations). Gen Next: More Democratic, More Liberal Trends in party identification suggest that this generation of young people is more Democratic than the generation that came before it. In the 2004 presidential election, where they turned out in near record numbers, young voters chose John Kerry over George Bush by a decisive margin. Majorities of the older age groups backed Bush. And in the 2006 mid-term elections for Congress, young people voted overwhelmingly for Democrats over Republicans, by 58%-37% among all 18-24 year-olds, according to national exit polls. These voting patterns reflect a broader Democratic leaning among Gen Nexters. In 2006, 48% of young people identified themselves as Democrats or leaned toward the Democratic Party, while only 35% identified themselves as Republicans – the lowest number recorded by Pew in its nearly 20-year trend. This makes them the least Republican generation. Larger percentages of Gen Xers, Republican Losses 41 55 48 38 37 35 44 42 46 39 37 39 18-25 26 and older Percent Republican or leaning Republican 1987 1991 1995 2000 2004 2006 Source: 1987-1989 Pew Values Surveys 1990-2006 Pew annual compiled surveys
  31. 3 These figures are based on compiled data from Pew

    polls taken throughout 2006. 29 Boomers and Seniors identify with the GOP.3 It is not the case that young people have always been more Democratic. In fact, in the late 1980s and early 1990s, 18-25 year-olds were more Republican than older age groups. Some political science research suggests that voters make the connection to a political party relatively early on in their adult life and tend to stick with that party as they get older; Generation X continues to be the most Republican-leaning generation today. If Gen Nexters remain solidly Democratic and continue to become more politically engaged, this could have major consequences for electoral politics. In addition to being more Democratic, Gen Nexters are more liberal than their older counterparts. When asked to describe their political views, 26% of Nexters say they are liberal; 36% describe themselves as moderate; and 29% say they are conservative. Fewer older Americans think of themselves as liberal and more identify themselves as conservative. Gen Nexters and Bush Over the past three presidencies, the presidential job approval ratings offered by younger Americans have largely tracked the feelings of the general public, though young attitudes have diverged at certain points in time. During the early part of Clinton’s presidency, younger Americans rated his performance slightly better than those age 26 and over; in 1993, 51% of 18-25 year olds approved of Clinton, compared with 46% of those older than 25. Clinton’s approval ratings rose in his second term, but Youth and Ideology ----------Age---------- 18-25 26-40 41-60 61+ Political views % % % % Liberal 26 22 19 14 Moderate 36 39 39 36 Conservative 29 33 37 42 Don’t know 9 6 5 8 100 100 100 100 Source: 2006 Pew compiled surveys. Youth and Presidential Job Approval 0 10 20 30 40 50 60 70 80 90 100 90 91 92 93 94 95 96 97 98 99 00 01 02 03 04 05 06 18-25 26 and older George Bush Bill Clinton George W. Bush
  32. 30 the age gap largely disappeared. Currently, there is also

    a small gap in how Gen-Nexters rate President Bush’s performance in office. In data collected throughout 2006, Bush’s job approval among 18-25 year olds stood at 32%, while 58% disapproved of his job performance. By comparison, job approval ratings among those age 26 and older were slightly higher (37%) and disapproval was slightly lower (54%). Attitudes Toward Government Generally speaking, Generation Next has a positive view of government. However, Nexters are just as skeptical as the rest of the American public about whether elected officials really care what they think. But they are a bit less cynical about elected officials’ ties to the people they represent. Only 24% of Nexters completely agree that elected officials in Washington lose touch with the people pretty quickly; this compares with 32% of those over age 25. Gen Nexters are more pro-government than older age groups on several dimensions. They are much less likely to characterize the government as wasteful and inefficient. On balance, the general public agrees with the statement, “When something is run by the government, it is usually inefficient and wasteful” (55% agree vs. 41% disagree). A strong majority of Nexters (64%) reject this idea. The views of the general public on this issue have shifted over time with fewer Americans now saying the federal government is inefficient and wasteful. But today’s young people have a much more positive view of government in this regard than young people did a generation ago. In the late 1980s, 18-25 year-olds were evenly divided on this issue: 47% agreed that government is often inefficient and wasteful, 47% disagreed. Gen Nexters are less supportive than older Americans of seeing Gen Next: A More Positive View of Government 1987-88 2002-03 When something is run by 18-25 26+ 18-25 26+ the federal government it is % % % % usually inefficient and wasteful Agree 47 67 32 58 Disagree 47 28 64 38 Don’t know 6 5 4 4 100 100 100 100 The federal government should run only those things that can’t be run at the local level Agree 76 78 63 71 Disagree 18 17 32 24 Don’t know 6 5 5 5 100 100 100 100 Source: Pew Values Surveys.
  33. 31 government power devolved to the states. By a margin

    of 63%-32% young people agree the federal government should run only those things that cannot be run at the local level. Older people support this idea by a stronger 71%-24% margin. Both Gen Nexters and Xers are conflicted over whether or not the federal government controls too much of their daily lives – 49% in each group say the government is too controlling, while an identical percentage says it is not. Among those over age 40, a majority (59%) say the government is too controlling. Gen Nexters have a somewhat unique set of views on leadership in Washington. They are less likely than older Americans to embrace a “throw the bums out” philosophy, and they are big advocates of compromise in governance. Only 35% of Nexters agree with the statement, “We need new people in Washington even if they are not as effective as experienced politicians,” 62% disagree with this statement. Older generations are more evenly split on this issue. While most Americans agree compromise is the best way to get things done in Washington, Gen Nexters are the biggest proponents of this approach. Fully 86% of Nexters say they like political leaders who are willing to make compromises in order to get the job done, 38% completely agree with this sentiment. Gen Next on the Issues Young people today have a complex set of views on major policy issues. They tend to be more liberal on social issues, supportive of government control in many areas, also but pro-business and open to the idea of privatization in the Social Security system. Gen Next: Compromise and Continuity in Washington ----------Age---------- We need new people in 18-25 26-40 41-60 61+ Washington, even if they’re % % % % not as effective as experienced politicians Agree 35 41 46 57 Disagree 62 54 49 36 Don’t now 3 5 5 7 100 100 100 100 I like political leaders who are willing to make compromises in order to get the job done Completely agree 38 29 26 30 Somewhat agree 48 49 50 45 Disagree 11 18 20 20 Don’t know 3 3 4 5 100 100 100 100 Source: Pew 2002-2003 Values Surveys
  34. 32 In terms of their priorities, Gen Nexters do not

    have a unique issue agenda. When asked in September 2006 to name the most important problem facing the country today, Nexters listed Iraq as the top problem followed by terrorism and the economy. Older generations were focused on the same set of problems. Similarly, when asked in January 2006 about which issues Bush and the new Congress should focus on in the coming year, young and old shared a common set of policy priorities. However, there were key exceptions here that offer some insight into Gen Next’s approach to public policy. Young people were much less concerned than their older counterparts with strengthening the U.S. military and changing the federal tax system. In addition, they placed less emphasis on making it tougher for illegal immigrants to enter the U.S. – 32% of Nexters said this should be a top priority compared with 54% of those over age 25. The Environment Conceptually, the American public supports stronger environmental laws and regulations. However, there are age differences on this issue, with Gen Next being somewhat more supportive of strong environmental policies, even given the inherent tradeoffs. Overall, 77% of Americans say this country should do whatever it takes to protect the environment. Younger Americans feel somewhat more strongly about this than do older Americans with the widest gap coming between those age 40 and younger and those over age 40. Six-in-ten Americans believe stricter environmental laws and regulations are worth the cost, while 31% say they cost too many jobs and hurt the economy. And 62% say people should be willing to pay higher prices in order to protect the environment, while 36% disagree with this statement. On both of these measures, which raise the issue of the economic costs of environmental regulation, Nexters hold views similar to Gen Xers and Boomers. The oldest generation stands out as being the least supportive of stricter laws. Young people may have a different orientation toward environmental issues because of Views on the Environment ----------Age---------- 18-25 26-40 41-60 61+ Biggest influence on % % % % environmental views: Personal experience 19 22 26 18 Friends & family 14 6 4 5 Media 19 22 28 30 Religious beliefs 4 6 8 11 Education 33 30 22 24 Something else 11 14 11 10 Don’t know 0 * 1 2 100 100 100 100 Source: Pew July 2006 Religion Survey
  35. 33 the way they have been socialized and educated about

    the issue. When asked which factor has had the most influence on their thinking about the environment, young people point to their education as the top influence. More older Americans say they have been swayed by what they have seen or read in the media. On the specific issue of global warming, Gen Nexters’ views are similar to their older counterparts. Roughly four-in-ten Nexters (42%) say global warming is a very serious problem, almost identical to the percent of all Americans who share this view (41%). Another 33% of Nexters say global warming is a somewhat serious problem. About eight-in-ten young people (81%) say, based on what they’ve read and heard, there is solid evidence that the average temperature on earth has been getting warmer over the past few decades. This compares with 77% of all Americans. Immigration More than any other generation, Gen Nexters have grown up in an increasingly diverse country. And on some measures of tolerance toward immigrants, they have more positive views than do older people. Gen Nexters are the most likely to believe that the growing number of newcomers from other countries strengthens American society (67%). By comparison, 30% say that the growing number of immigrants threaten traditional American customs and values. On balance the American public is evenly divided over the impact immigrants have had on the nation: 41% say immigrants today strengthen the country because of their hard work and talents, while the same number says immigrants are a burden on the country because they take away jobs, housing Gen Next and Immigration ----------Age---------- 18-25 26-40 41-60 61+ Immigrants today...* % % % % Strengthen the country with their hard work and talents 52 39 44 30 Are a burden because they take jobs, housing, health care 38 33 43 50 Neither/Both equally 6 24 10 15 Don’t know 4 4 3 5 100 100 100 100 Growing number of immigrants...** Strengthens American society 67 57 47 38 Threatens our customs and values 30 35 44 45 Neither/Both equally 1 3 3 4 Don’t know 2 5 6 13 100 100 100 100 Source: * 2006 Gen Next survey; ** Pew 2004 Typology Survey
  36. 34 and health care. Gen Nexters are much less conflicted

    about this issue – 52% say immigrants strengthen the country, while 38% say they are more of a burden. In this regard, they are more likely than Gen Xers, or other older generations, to say that immigrants strengthen the country. These general attitudes toward immigration carry over to specific policy proposals as well. Gen Nexters are more likely than older generations to believe legal immigration into the U.S. should be increased: 25% say it should be increased, 37% say it should be decreased and 36% say it should be kept the same. Among those age 26 and older, only 16% say immigration should be increased, a 41% plurality says it should be decreased, and 37% say it should be kept the same. The exit poll from the 2006 mid-term elections asked voters whether most illegal immigrants working in the U.S. should be offered a chance to apply for legal status or deported to the country from which they came. A strong majority of Nexters – 70% – said illegal immigrants should be offered a chance to stay, 30% said they should be deported. By comparison, fewer than 60% of voters ages 30 and older said illegal immigrants should be allowed to stay. Social Security Privatization Though it would undoubtedly affect them, young people are not particularly well- informed about the idea of privatizing the Social Security system. When asked how much they had heard about a proposal which would allow younger workers to invest a portion of their Social Security taxes in private retirement accounts, a majority of Gen Nexters (60%) said they had heard nothing at all, only 8% said they had heard a lot. The degree to which people are informed about this issue increases with age. Nearly four-in-ten Seniors (39%) said they had heard a lot. Among the minority of young people who had heard about the issue, support for the idea of Social Security privatization was strong. Fully 74% of 18-25 year-olds who had heard at least a little about this proposal favored it, compared with 59% of Gen Xers, 55% of Boomers and 41% of Privatizing Social Security (Based on those who heard about the proposal) ----------Age---------- Allowing young workers 18-25 26-40 41-60 61+ to invest in private % % % % retirement accounts? Favor 74 59 55 41 Oppose 22 30 34 44 Don’t know 4 11 11 15 100 100 100 100 Source: Pew 2004 Typology Survey.
  37. 35 Seniors. Knowledge matters more for young people than it

    does for older people. Gen Nexters who have not heard about the proposal are much less supportive of it, whereas among those over age 25, support for the proposal is nearly identical, regardless of how much or how little they have heard. Attitudes Toward Business Gen Nexters have a distinctive set of attitudes toward business – they are less critical of government regulation of business and less critical of business itself. On balance, young people reject the notion that government regulation of business does more harm than good by a margin of 50%- 40%. Among those over age 25, a slim majority says that government regulation does more harm than good and 40% disagree. However, when it comes to corporate profits, most young people believe that business corporations generally strike a fair balance between making profits and serving the public interest. A majority of older Americans (58%) disagree with this assertion. War and Peace Traditionally young people have been more interested in using diplomacy to solve our international problems than using military force. In spite of the turbulent times they are living through, Generation Next is no exception. Today’s young people are evenly divided over whether or not the best way to ensure peace is through military strength – 48% say this is the best way to ensure peace, 49% say it is not. Older age groups lean much more heavily toward using military might. In the late 1980s, the opinions of young people (most of whom are now part of Generation X) on this issue were almost identical, while older generations favored military strength. The views of Generation X have toughened over time, as they now look just like their older counterparts, agreeing that military might is the best means of Generational Divide on Business ----Age---- 18-25 26+ Government regulation of business % % does more harm than good Agree 40 52 Disagree 50 40 Don’t know 10 8 100 100 Business corporations generally strike a fair balance between profits and public interest Agree 52 38 Disagree 44 58 Don’t know 4 4 100 100 Source: Pew 2002-2003 Values Surveys. Peace Through Strength: Then and Now 1987-1988 2002-2003 Best way to ensure peace is 18-25 26+ 18-25 26+ through military strength % % % % Agree 46 59 48 61 Disagree 49 36 49 35 Don’t know 5 5 3 4 100 100 100 100 Source: Pew Values Surveys
  38. 36 achieving peace. Generation Next is less interested than their

    older counterparts in increasing spending on defense. Only 13% say the U.S. should increase its spending on national defense, compared with 21% of those over age 25. More than one-quarter of Gen Nexters (28%) say defense spending should be cut back, compared with 18% of older Americans. When asked about using military force against countries that threaten the U.S., the views of young people are similar to those of older Americans. However, when asked specifically about using force to defeat terrorism, young people are much more hesitant. Only 29% of Nexters say using overwhelming military force is the best way to defeat terrorism around the world. The vast majority (67%) say relying too much on military force to defeat terrorism creates hatred that leads to more terrorism. Older generations are more evenly divided on this issue: 41% say using overwhelming force is the best approach for defeating terrorism, 49% say this approach ultimately leads to more terrorism. Young people also favor a more internationalist approach to foreign policy. Fully 62% say the U.S. should take into account the interests of its allies even if it means making compromises with them. Slightly more than half of older Americans (52%) share this perspective. Generation Next and 9/11 Gen Nexters show little sign of having been indelibly marked by the events of Sept. 11, 2001. In the months following the attacks, young people were slightly less likely than older people to say they worried about another terrorist attack in the U.S. Since 2001, Gen Next has actually become even less worried about another attack, and the gap between young and old has How to Defeat the Terrorists ----Age---- 18-25 26+ Which comes closer to your views... % % Using overwhelming force is the best way to defeat terrorism 29 41 Relying too much on military force leads to hatred & more terrorism 67 49 Neither/Both equally 2 4 Don’t know 2 6 100 100 Source: Pew 2004 Typology Survey Young Worry Less About Terrorists Attacking the US 59 60 57 53 65 69 64 63 2001 2002 2003 2004 18-25 26 and older Percent "very" or "somewhat" worried Source: Pew Compiled Annual Surveys
  39. 37 increased. Generation Next’s more tolerant approach to issues involving

    race and immigration gives them a different perspective on the post-9/11 world. Gen Nexters are less likely than older Americans to be suspicious of people who they think are of Middle Eastern descent. Only 27% say that since Sept. 11 they are more suspicious of people perceived to be of Middle Eastern descent; this compares with 37% of those over age 25. The War in Iraq Public support for the war in Iraq has fallen steadily among all age groups over the course of the war. During the first year of the war, between 60% and 70% of the public said the U.S. had made the right decision in using military force against Iraq. By 2004, support for the war was closer to 50%, and in 2005 and 2006 fewer than half of Americans believed the U.S. had made the right decision in going into Iraq. Throughout this three-year period, the views of young people on Iraq have tracked fairly closely with the views of older generations. The oldest generation, those over age 60, have consistently expressed the most negative opinions on Iraq. In 2006, young people expressed the highest level of dissatisfaction among the generations with Bush’s handling of the war in Iraq. In an average across surveys taken throughout the year, only 26% of 18-25 year-olds approved of the way Bush was handling the war, fully 69% disapproved. Among, those ages 26 and older, about six-in-ten (61%) disapproved of Bush’s handling of the war.
  40. 4 Much of the analysis on racial issues is based

    on white respondents, because sample sizes become too small when broken down by race and age. 38 IV. VALUES AND SOCIAL ISSUES Views on Racial Issues Generation Next clearly stands out in its progressive approach to some of the major social issues of the day. On issues ranging from race to homosexuality to the role of women, Nexters have liberal views that reflect the changing world in which they have come of age. The population as a whole has become more tolerant on racial issues. In the late 1980s, only 44% of white Americans agreed with the statement, “I think it’s all right for blacks and whites to date each other.” By 2003, 72% agreed with this statement. Young people have consistently been more accepting of interracial dating, however, and the gap between young and old has increased over time. In 2002-2003, 89% of white 18-25 year-olds agreed that it is okay for blacks and whites to date each other, compared with 70% among those over age 25. Furthermore, 64% of young whites completely agreed with this statement; just 36% of older whites did so. Among blacks, there is a similar gap between young and old – with young blacks being more accepting than older blacks of interracial dating. However, the gap has remained consistent over time, as both age groups have moved toward a more progressive view on this issue.4 On the issue of affirmative action, the general public still rejects the idea of giving preferential treatment to blacks and other minorities in an effort to improve their position. Among whites, only 20% agree with the statement: “We should make every possible effort to improve the position of blacks and other minorities, even if it means giving them preferential treatment.” Young whites are more accepting of this concept than are older ones: 33% of Nexters support affirmative Changing Views on Interracial Dating (Based on white respondents only) It’s all right for 1987-1988 2002-2003 blacks and whites 18-25 26+ 18-25 26+ to date each other % % % % Agree 56 42 89 70 Completely agree 20 12 64 36 Disagree 38 53 10 26 Don’t know 6 5 1 4 100 100 100 100 Source: Pew Values Surveys.
  41. 39 action efforts compared with 19% of those over the

    age of 25. Just as on the issue of interracial dating, the gap between young and old has increased somewhat on this issue since the late 1980s. As a whole, white Americans are more likely today to feel that they have a lot in common with people of other races. In fact, the vast majority reject the notion that they “don’t have much in common with people of other races” (82% disagreed with this statement in 2002-03, vs. 72% in 1987-88). Young whites have moved even further along on this issue than have their older counterparts. Nearly half of today’s youth (49%) completely disagreed with this statement – up from 24% in 1987-88. Again, this most likely reflects the increasingly multi-cultural, multi-ethnic society in which Gen Nexters have grown up. Views on Homosexuality Since the late 1980s, public opinion concerning the rights of homosexuals has shifted substantially. In 1987-88, a slim majority of Americans (52%) agreed that school boards ought to have the right to fire teachers who are known homosexuals, while only 42% rejected this notion. By 2002-2003, a solid majority (60%) said teachers should not be fired just because they are gay. The generation gap on this issue was relatively small in the 1980s; young people were only slightly more supportive of gays. But by 2003, young people’s views on this issue were significantly different from their older counterparts. Fully 71% of 18-25 year-olds rejected the idea that school boards should be able to fire known homosexuals. This compared with 59% of those over the age of 25. Tolerance toward homosexuals diminishes across age groups – Gen Xers express similar opinions to Nexters, and Boomers are much more tolerant than Seniors. Gen Nexters also are more accepting of homosexuality generally. Nearly six-in-ten (58%) say homosexuality is a way of life that should be accepted by society. This compares with 50% of those over age 25. On balance, the public opposes allowing gays and lesbians to marry, but young people are evenly split on the issue. Nearly half of Gen Nexters (47%) favor gay marriage, Gay Marriage and Adoption ----Age---- Allowing gays/lesbians 18-25 26+ to marry legally* % % Favor 47 30 Oppose 46 64 Don’t know 7 6 100 100 Allowing gays/lesbians to adopt children** Favor 61 44 Oppose 35 50 Don’t know 4 6 100 100 Sources: * Pew 2004 Typology; ** Pew March 2006 NII Survey
  42. 40 and 46% are opposed to it. Among those over

    age 25, only 30% favor gay marriage while 64% are opposed. The public is more open to the idea of gay people adopting children, and here too young people take a more liberal position. About six-in-ten Gen Nexters (61%) favor allowing gays and lesbians to adopt, compared with 44% of those over age 25. Abortion and Stem Cell Research In spite of their more liberal views on other social issues, Gen Nexters do not differ from the rest of the population on the issue of abortion. As is the case with the general public, there is no consensus view among Nexters about limits on the availability of abortions. Roughly a third of 18-25 year-olds (32%) say abortions should be generally available (vs. 35% of the public), another 19% say they should be available but under stricter limits (vs. 20% of the public). Just over three-in-ten Nexters (31%) say abortion should be against the law except in cases of rape, incest, or to save the life of the mother, while 15% say abortion should not be permitted at all. These are comparable to the views of the general public – 31% say abortion should be against the law in most cases and 11% say it should not be permitted at all. The biggest generational gap in opinion on abortion is between Boomers (ages 41-60) and Seniors (ages 61 and older). By a margin of 59%-32% Gen Nexters favor allowing women to get the so-called morning after pill without a doctor’s prescription. Older generations are more skeptical about this proposal – 46% of those over age 25 favor making the morning-after pill available and 43% oppose this. Gen Nexters are not very aware of the debate over stem cell research. When asked in 2004 how much they had heard about the debate over whether the federal government should fund this type of research, only 36% said they had heard “a lot.” Roughly half (49%) of those over age 25 had heard a lot. Nexters generally favored conducting stem cell research when presented with the tradeoff between new medical cures and destroying the potential life of human embryos. The views of young people mirror those of older generations on this issue with one exception – Seniors are somewhat more hesitant to embrace stem cell research.
  43. 41 Gen Next Less Traditional Very few Americans believe that

    women should return to their traditional roles in society. By a margin of 21%-74% the public rejects this notion. Gen Nexters disagree most vehemently: 60% completely disagree that women should return to their traditional roles. Gen Next women feel even more strongly about this than do young men: 67% of females in this generation and 53% of males reject the idea of women returning to their traditional roles. The sharpest generational line on this issue is between those ages 18-60 and those over the age of 60. One-third of Seniors say women should return to their traditional roles. While the public embraces progress for women, many Americans still maintain that they have old-fashioned values about family and marriage. More than eight-in-ten Americans (82%) agree they have old-fashioned values, fully 48% completely agree. Gen Nexters are the least likely to adhere to this viewpoint – 67% agree and 31% disagree. Their values are distinct on this dimension when compared with young people a generation ago. Gen Xers were more unified in their views on this issue when they were young: 80% of 18-25 year-olds in 1987-88 said they had old-fashioned values about family and marriage, only 17% rejected this statement. Fifteen years later, their views were largely unchanged. Views on Family and Marriage 1987-1988 2002-2003 I have old-fashioned values 18-25 26+ 18-25 26+ about family and marriage % % % % Agree 80 88 67 85 Disagree 17 11 31 13 Don’t know 3 1 2 2 100 100 100 100 Source: Pew Values Surveys
  44. 42 DATA SOURCES FOR THIS REPORT This report draws on

    several different sources of survey data, including a special survey designed for the project and conducted with a large sample of young people in the GenNext cohort. Here is a brief overview of the major data sources used in the report: • Gen Next Survey: Conducted by telephone September 6-October 2, 2006 with a nationally representative sample of 1,501 adults, including 579 members of GenNext (ages 18-25); 250 of the GenNext interviews were conducted by cell phone. • Pew Research Center Values Surveys: A series of 12 large national surveys conducted between 1987 and 2003. The project was initiated by the Times Mirror Center for the People and the Press in 1987 and continued by the Pew Research Center for the People and the Press since 1996. Several analyses in this report compare responses of young people ages 18-25 in the 1987-1988 surveys with the same age group in the 2002-2003 surveys. While the latter group does not conform perfectly with GenNext as defined in this report, the overlap is great enough to provide useful comparisons of young people 15 years apart. • Pew Research Center Annual Compiled Surveys: The collection of all general public surveys conducted since the center’s inception, provides important trend comparisons for such items as party identification and presidential approval. The very large sample sizes (e.g.,33,000 for the year 2006) allows very precise comparisons of GenNext with other age cohorts. • Pew Social Trends Surveys: A series of large telephone surveys conducted in 2005 and 2006 focusing on many aspects of social life and attitudes in the U.S. • Exit Polls Conducted by Edison-Mitofsky Research: Analysis of Election Day surveys conducted for the National Election Pool in 2004 and 2006. • The report also uses findings from a wide range of individual surveys conducted by the Pew Research Center on such topics as religion and politics, news consumption, immigration, and the war in Iraq. These are referred to by month and year; documentation on these individual studies is available at the People-Press website, http://people-press.org.
  45. 43 ABOUT THE SURVEY Interviewing for the survey was conducted

    by telephone Sept. 6-Oct. 2, 2006 among a 1,501 adults ages 18 and older, including an oversample of members of Generation Next (ages 18-25). The total sample size for those 18-25 is 579, including 250 interviews conducted by cell phone; 130 of these individuals had no landline phone. In order to compensate cell phone respondents for any toll charges incurred, those interviewed by cell phone were offered an incentive of $10 for completing the survey. Interviewing was conducted by the research firm Schulman, Ronca & Bucuvalas, Inc. (SRBI). The samples were prepared by Survey Sampling International (SSI). The data were weighted using demographic weighting parameters derived from the March 2005 Census Bureau's Current Population Survey, along with estimates of current patterns of telephone status in the U.S., using an iterative technique that simultaneously balances the distributions of all weighting parameters. For results based on the total sample, one can say with 95% confidence that the error attributable to sampling is plus or minus 3.5 percentage points. For results based on respondents ages 18-25 (N=579), the sampling error is plus or minus 5 percentage points. For results based on respondents ages 26 and older (N=922), the sampling error is plus or minus 4 percentage points. In addition to sampling error, one should bear in mind that question wording and practical difficulties in conducting surveys can introduce error or bias into the findings of opinion polls. ABOUT THE CENTER The Pew Research Center for the People & the Press is an independent opinion research group that studies attitudes toward the press, politics and public policy issues. We are sponsored by The Pew Charitable Trusts and are one of six projects that make up the Pew Research Center, a nonpartisan "fact tank" that provides information on the issues, attitudes and trends shaping America and the world. The Center's purpose is to serve as a forum for ideas on the media and public policy through public opinion research. In this role it serves as an important information resource for political leaders, journalists, scholars, and public interest organizations. All of our current survey results are made available free of charge. All of the Center’s research and reports are collaborative products based on the input and analysis of the entire Center staff consisting of: Andrew Kohut, Director Scott Keeter, Director of Survey Research Carroll Doherty and Michael Dimock, Associate Directors Carolyn Funk, Richard Wike and Kim Parker, Senior Researchers Nilanthi Samaranayake, Survey and Data Manager April Clark, Juliana Horowitz and Rob Suls, Research Associates James Albrittain, Executive Assistant
  46. 44

  47. 45 PEW RESEARCH CENTER FOR THE PEOPLE & THE PRESS

    SEPT 2006 GENERATION NEXT SURVEY FINAL TOPLINE September 6-October 2, 2006 Total N=1501 18-25 (N=579) ASK ALL: Q.1 Generally, how would you say things are these days in your life -- would you say that you are very happy, pretty happy, or not too happy? Total 18-25 26+ 36 30 37 Very happy 51 63 49 Pretty happy 12 6 13 Not too happy 1 1 1 Don’t know/Refused (VOL) 100 100 100 (N=1501) (N=579) (N=911) Q.2 What is the most important problem facing you in your life these days? (OPEN-END. PROBE ONCE IF RESPONDENT ANSWERS “DON’T KNOW”; ACCEPT UP TO THREE RESPONSES) Total 18-25 26+ 28 30 27 MONEY/FINANCIAL ISSUES/DEBT(NET) 9 9 10 Financial issues/problems/difficulties 4 4 4 Bills/Loans/Debt 3 1 3 Cost of living/Income 2 1 2 Retirement 12 16 12 Money (General) 13 2 15 HEALTH (NET) 2 0 3 Getting older/Aging/Disabled 2 * 2 Insurance and Prescription Costs 9 2 11 Health (General) 12 7 13 FAMILY AND RELATIONSHIPS (NET) 6 3 7 Raising children/Childcare/Having a baby 2 * 2 Aging parents/siblings/spouse/Losing loved ones 1 1 1 Love life/Divorce/Boyfriends/Soulmate 3 3 4 Relationships (General) 8 16 6 CAREER/JOB (NET) 4 8 3 Finding/getting a job 1 2 1 Job/career advancement/security/satisfaction 3 6 2 Work/Career (General) 7 2 8 NATIONAL/INTERNATIONAL CONDITIONS (NET) 2 0 2 The economy/Deficit/Inflation 1 * 1 War/Iraq 1 0 1 Terrorism 1 * 1 Bush/Politicians 1 0 1 Unemployment/Jobs 1 1 1 Gas prices 1 * 1 Politics (General)
  48. 46 Q.2 CONTINUED... Total 18-25 26+ 7 5 7 MISCELLANEOUS

    (NET) 4 2 4 Time pressures/management 1 1 1 Crime/Alcoholism and Drugs 1 2 1 Life/Future 1 * 1 Spirituality/Morality/General decline 4 18 1 COLLEGE AND EDUCATION ISSUES (NET) 2 6 1 Choosing/getting into/Paying for college/Passing classes/Graduating 2 12 * College/School/Education (General) 7 7 8 Other 15 12 15 None/No problem (VOL) 5 5 4 Don’t know/Refused (VOL) NO QUESTION 3 [ROTATE Q.4 AND Q.5] Q.4 What ONE WORD OR PHRASE best describes your generation? (OPEN-END. ACCEPT UP TO TWO RESPONSES. PROBE ONCE IF RESPONDENT ANSWERS “DON’T KNOW”) ***See survey report for discussion of responses to this question.*** Q.5 What ONE WORD OR PHRASE best describes your parents’ generation? (OPEN-END. ACCEPT UP TO TWO RESPONSES. PROBE ONCE IF RESPONDENT ANSWERS “DON’T KNOW”) ***See survey report for discussion of responses to this question.*** ASK IF AGE < 26: ROTATE Q.6A AND Q.6B Q.6a Do you think of your own age group as unique and distinct from other generations, or not? 18-25 68 Yes, unique and distinct 31 No, not 1 Don’t know/Refused (VOL) 100 ASK IF AGE < 26: Q.6b Thinking about the generation that grew up just before yours – mostly people who are in their 30s today -- do you think of that generation as particularly unique and distinct from other generations, or not? 18-25 44 Yes, unique and distinct 53 No, not 3 Don’t know/Refused (VOL) 100
  49. 47 ASK ALL: Q.7 In general, do you think it

    is better to be a young adult today or better to have been a young adult 20 years ago? Time/CNN1 June 1990 Total 18-25 26+ 18-25 27 50 23 Better today 50 67 45 70 Better 20 years ago 45 4 3 4 Same (VOL) 2 2 2 3 Don’t know/Refused (VOL) 3 100 100 100 100 ASK IF AGE < 26: Q.8 In which of these areas do you think young adults in your age group have it better and in which areas did young adults 20 years ago have it better…(INSERT ITEM; RANDOMIZE)? ---Based on 18-25--- Young adults today have it better Young adults 20 years ago had it better Same/no difference (VOL) DK/ Ref a. Getting a high paying job 72 23 3 2=100 Time/CNN: June, 19902 79 16 3 2=100 b. Living in an exciting time 64 27 7 2=100 Time/CNN: June, 1990 50 40 8 2=100 c. Having sexual freedom 66 25 4 5=100 Time/CNN: June, 1990 54 36 7 3=100 d. Enjoying financial security 47 44 4 5=100 Time/CNN: June, 1990 53 38 6 3=100 e. Bringing about social change 56 35 4 5=100 Time/CNN: June, 1990 48 45 4 3=100 f. Buying a house 31 62 3 4=100 Time/CNN: June, 1990 28 64 5 3=100 g. Having opportunities to get a good education 84 12 2 2=100 1 In the June, 1990 Time/CNN/Yankelovich Partners Poll the question was worded: “In general, do you think it is better to be a young adult today or better to have been a young adult in the 1960’s and 1970’s?” 2 In the Time/CNN/Yankelovich Partners Poll the question was worded: “In which of these areas do you think young adults in your age group have it better and in which areas did young adults in the 1960’s and 1970’s have it better…[insert item]?”
  50. 48 ASK ALL: Q.9 Which of these statements comes closer

    to your own view… [READ AND ROTATE] Total 18-25 26+ 80 82 80 When a person reaches their mid-20s, it’s important for them to have a good plan for what they are going to do with the rest of their lives OR… 18 16 18 It’s really not necessary for someone in their mid-20s to know what they are going to do with the rest of their lives. 2 2 2 Don’t know/Refused (VOL) 100 100 100 ASK IF AGE < 26: Q.10 Now thinking about your generation compared with young adults 20 years ago, for each of the things I mention please tell me if you think your generation does more of it, less of it, OR about the same amount as young adults 20 years ago did. [READ AND RANDOMIZE] ---Based on 18-25--- Your generation does more Your generation does less of it Same/no difference (VOL) DK/Ref a. Casual sex 75 7 17 1=100 b. Binge drinking 69 6 23 2=100 c. Illegal drug use 63 14 21 2=100 d. Community service or volunteer activity 37 42 19 2=100 e. Voting in elections 34 49 14 3=100 f. Resort to violence to resolve conflicts 70 13 15 2=100 ASK ALL: Now a different kind of question… Q.11 Other than friends or members of your own family, who would you say is the person you most admire these days? (IF YES: WHO WOULD THAT BE? OPEN-END. PROBE ONCE IF RESPONDENT ANSWERS “DON’T KNOW”) Total 18-25 26+ 18 8 20 POLITICAL LEADERS (NET) 11 4 12 Presidents (SUB-NET) 8 3 9 George Bush 2 1 2 Bill Clinton 1 * 1 Jimmy Carter * 0 * Ronald Reagan 2 1 2 Hillary Clinton 1 1 1 Condoleeza Rice 1 * 1 Political wives * * * Colin Powell * * * Al Gore 3 2 4 Other Political Leaders
  51. 49 Q.11 CONTINUED... Total 18-25 26+ 14 6 15 SPRITUAL

    LEADERS (NET) 7 3 8 Pastor/Priest/Minister 4 3 4 God/Jesus Christ/Lord 1 0 1 The Pope 1 * 1 Mother Teresa 1 0 1 TV Evangelists * * * Dalai Lama * * * Other Spiritual Leaders 13 25 11 PERSONAL RELATIONSHIPS (NET) 3 3 3 Boss 3 12 2 Teacher/Professor/Mentor 2 1 2 Co-Workers 2 3 1 Family 1 3 1 Friends/Boyfriends/Girlfriends 1 1 1 Nurses/Doctors * 1 * Myself 1 1 1 Other Personal Relationships 11 14 11 ENTERTAINERS (NET) 4 2 5 TV personality (SUB-NET) 3 1 4 Oprah Winfrey 1 1 1 Other 2 3 2 Singers 2 4 1 Athletes 1 0 1 Muhammad Ali 1 4 * Other 1 3 1 Actors (SUB-NET) * 1 * Angelina Jolie 1 2 1 Other 2 2 2 Other Entertainers 2 1 2 SOLDIERS/SERVICEMEN 1 1 1 BUSINESS LEADERS (NET) 1 1 1 Bill Gates * * * Other Business Leaders 1 1 1 HISTORICAL FIGURES 1 * 1 INTERNATIONAL POLITICAL LEADERS 7 9 7 Other 17 19 16 None 15 16 15 Don’t know/Refused (VOL) 100 100 100
  52. 50 ASK IF AGE < 40: Q.12 Here are a

    few goals that some people have set for themselves in their lives. Which of the following do you think people in your generation or age group think is MOST important… [READ AND RANDOMIZE]… 18-39 18-25 26-39 55 64 50 To get rich 8 10 7 To be famous 13 12 14 To help people who need help 10 7 11 To be leaders in their community 11 4 15 To become more spiritual 2 2 2 None of these (VOL) 1 1 1 Don’t know/Refused (VOL) 100 100 100 (N=774) (N=579) (N=195) ASK IF AGE < 40 AND IF Q.12=1-5: Q.13 And which would you say is next most important to them? [READ LIST AGAIN IF NECESSARY] 18-39 18-25 26-39 14 17 12 To get rich 30 41 23 To be famous 20 17 22 To help people who need help 19 15 21 To be leaders in their community 12 6 17 To become more spiritual 2 1 2 None of these (VOL) 3 3 3 Don’t know/No second choice (VOL) 100 100 100 (N=774) (N=579) (N=195) ASK ALL: Q.14 From what you have seen, would you say it is easy, hard, or probably impossible to have a good marriage today? Time/CNN June 1990 Total 18-25 26+ 18-25 21 20 22 Easy 22 66 65 66 Hard 62 9 13 8 Probably impossible 13 4 2 4 Don’t know/Refused (VOL) 3 100 100 100 100
  53. 51 Q.15 How do you feel about the amount of

    attention given to you by your parents when you were growing up? Do you think it was about the right amount, too much, or not enough? Total 18-25 26+ 69 68 69 Right amount 4 10 3 Too much 26 22 27 Not enough 1 * 1 Don’t know/Refused (VOL) 100 100 100 NO QUESTIONS 16-19 MARITAL Are you married, divorced, separated, widowed, or never been married? Time/CNN3 June 1990 Total 18-25 26+ 18-25 54 15 60 Married 25 11 2 13 Divorced 44 2 * 3 Separated -- 9 * 11 Widowed 0 23 83 13 Never been married 71 1 0 * Don’t know/Refused (VOL) 0 100 100 100 100 ASK IF AGE < 26: IF ANSWERED ‘2’ DIVORCED, ‘3’ SEPARATED, ‘4’ WIDOWED, ‘5’ NEVER MARRIED OR ‘9' DON’T KNOW IN “MARITAL”, ASK: Q.20 In looking ahead, do you definitely want to get married, probably want to get married, probably do not want to get married, or definitely do not want to get married? Time/CNN5 June 1990 18-25 18-25 57 Definitely want to marry 53 28 Probably want to marry 35 8 Probably do not want to marry n/a 4 Definitely do not want to marry 10 3 Don’t know/Refused (VOL) 2 100 100 (N=489) (N=301) 3 In the Time/CNN/Yankelovich Partners Poll the question was worded: “In looking ahead, do you definitely want to get married, probably want to get married, or definitely do not want to get married?” 4 In the Time/CNN/Yankelovich Partners Poll the percentage saying, “divorce or separated” was combined. 5 In the Time/CNN/Yankelovich Partners Poll the question was worded: “In looking ahead, do you definitely want to get married, probably want to get married, or definitely do not want to get married?”
  54. 52 ASK IF AGE < 26: Q.21 Do you have

    any children of your own? Time/CNN June 1990 18-25 18-25 27 Yes 24 73 No 76 * Don’t know/Refused (VOL) 0 100 100 ASK IF AGE < 26: IF ANSWERED ‘2' NO OR ‘9' DON’T KNOW IN Q.21, ASK: Q.22 In looking ahead, do you definitely want to have children, probably want to have children, probably do not want to have children, or definitely do not want to have children? Time/CNN6 June 1990 18-25 18-25 52 Definitely want to have children 57 34 Probably want to have children 32 9 Probably do not want to have children n/a 4 Definitely do not want to have children 10 1 Don’t know/Refused (VOL) 1 100 100 (N=446) (N=303) ASK ALL: EDUC What is the last grade or class that you completed in school? [DO NOT READ] Total 18-25 26+ 13 20 11 Less than high school 39 34 40 High school graduate (Grade 12 or GED certificate) 21 34 19 Some college, no 4-year degree (including associate degree) 27 11 30 College graduate (B.S., B.A., or other 4-year degree) * 1 * Don’t know/Refused (VOL) 100 100 100 6 In the Time/CNN/Yankelovich Partners Poll the question was worded: “In looking ahead, do you definitely want to have children, probably want to have children, or definitely do not want to have children?”
  55. 53 ASK IF AGE < 40: SCHL Are you currently

    enrolled in school? (PROBE IF ATTENDING HIGH SCHOOL, OR A COLLEGE UNDERGRADUATE OR IN GRADUATE SCHOOL) 18-39 18-25 26-39 26 46 13 Yes 3 8 0 Yes, in High School 1 3 * Yes, in Technical, trade, or vocational school 16 32 6 Yes, in College (Undergraduate) 6 3 7 Yes, in Graduate School 74 53 86 No * 1 1 Don’t know/Refused (VOL) 100 100 100 (N=774) (N=579) (N=195) ASK IF AGE < 40: IF CURRENTLY ENROLLED IN SCHOOL (SCHL=1,2,3,4) ASK: Q.23 How much further in school do you plan to go? [DO NOT READ] 18-25 2 Finish high school 4 Technical, trade, or vocational school 10 Attend college, no degree or 2 year/associate degree 34 Attend college, bachelor’s degree 47 Graduate or professional school or degree 1 No further (VOL) * Other [Specify] (VOL) 2 Don’t know/Refused (VOL) 100 (N=274) ASK IF AGE < 40: IF NOT ENROLLED IN SCHOOL (SCHL=5 OR 9) ASK: RSCHL Do you ever plan to return to school? 18-39 18-25 26-39 56 68 51 Yes 36 28 40 No 8 4 9 Don’t know/Refused (VOL) 100 100 100 (N=470) (N=305) (N=165)
  56. 54 ASK IF AGE < 40: IF PLANS TO RETURN

    TO SCHOOL (RSCHL=1) ASK: RSCHL2 How much further in school do you plan to go? [DO NOT READ] 18-39 18-25 26-39 10 10 10 Finish high school 12 7 15 Technical, trade, or vocational school 14 13 14 Attend college, no degree or 2 year/associate degree 28 39 22 Attend college, bachelor’s degree 25 24 25 Graduate or professional school or degree * * 0 No further (VOL) 5 2 7 Other [Specify] (VOL) 6 5 7 Don’t know/Refused (VOL) 100 100 100 (N=287) (N=207) (N=80) NO QUESTIONS 24-37 ASK ALL: Q.38 Do you use the internet, at least occasionally? Total 18-25 26+ 74 86 72 Yes 26 14 28 No * 0 * Don’t know/Refused (VOL) 100 100 100 Q.39 Do you send or receive email, at least occasionally? Total 18-25 26+ 68 77 67 Yes 32 23 33 No * * * Don’t know/Refused (VOL) 100 100 100 ASK IF AGE < 26: IF INTERNET USER (1 IN Q.38 OR 1 IN Q.39) ASK: Q.40 Have you ever used a social networking website like Facebook, MySpace or MyYearbook? IF ANSWERED ‘1' IN Q.40, ASK: Q.41 Have you created your own profile for a social networking site? 18-25 54 Yes, used social networking sites 44 Yes, created profile 10 No, have not created profile 34 Not a user of social networking sites 12 Not an internet/email user * Don’t know/Refused (VOL) 100
  57. 55 IF ANSWERED ‘1' IN Q.40, ASK: Q.42 How often

    do you visit social networking websites? [READ LIST] 18-25 10 Several times a day 11 Once a day 10 3 to 5 times a week 10 1 to 2 times a week 5 Every few weeks 8 Less often 34 Not a user of social networking sites 12 Not an internet/email user 0 Don’t know/Refused (VOL) 100 ASK IF AGE < 26: Q.43 Do most people you know use social networking web sites, or not? [IF YES: Do most people you know spend a reasonable amount of time, or too much time on these websites?] 18-25 75 Yes 34 Yes, reasonable amount of time 41 Yes, too much time 21 No, don’t use 4 Don’t know/Refused (VOL) 100 ASK IF AGE < 26: Q.44a Do you think people around your age post too much, too little, or the right amount of personal information about themselves on the internet? 18-25 72 Too much 4 Too little 19 Right amount 5 Don’t know/Refused (VOL) 100
  58. 56 ASK IF AGE < 26: Q.44b In your own

    case, have other people posted too much personal information about YOU on the Internet, or don’t you think that’s happened? 18-25 8 Yes, too much 88 No, don’t think has happened 4 Don’t know/Refused (VOL) 100 ASK ALL: TRANSITION SENTENCE FOR INTERNET USERS AGE 26+: Many people use the internet to meet other people. IF INTERNET USER (1 IN Q.38 OR 1 IN Q.39) ASK: Q.45a Have you ever gone on a date with someone you met online? Total 18-25 26+ 6 12 5 Yes 69 76 68 No 25 12 27 Not an internet/email user 0 0 0 Don’t know/Refused (VOL) 100 100 100 Q.46 Thinking now about technology such as the internet, instant messaging, cell phones, text messaging, and iPods, does new technology…(INSERT ITEM; RANDOMIZE), or not? AFTER FIRST ITEM, ASK: “Does new technology [INSERT ITEM], or not?” a. Make it easier to make new friends Total 18-25 26+ 45 69 41 Yes 48 29 51 No 7 2 8 Don’t know/Refused (VOL) 100 100 100 b. Make people lazier Total 18-25 26+ 70 84 67 Yes 25 15 27 No 5 1 6 Don’t know/Refused (VOL) 100 100 100 c. Make people more isolated Total 18-25 26+ 65 67 65 Yes 30 31 30 No 5 2 5 Don’t know/Refused (VOL) 100 100 100
  59. 57 Q.46 CONTINUED... d. Make people waste too much time

    Total 18-25 26+ 65 68 65 Yes 31 30 31 No 4 2 4 Don’t know/Refused (VOL) 100 100 100 e. Make people more efficient Total 18-25 26+ 65 69 64 Yes 30 24 31 No 5 7 5 Don’t know/Refused (VOL) 100 100 100 f. Make you closer to old friends or family Total 18-25 26+ 56 64 54 Yes 40 34 42 No 4 2 4 Don’t know/Refused (VOL) 100 100 100 Q.47 Thinking about the past 24 hours, did you [INSERT ITEM; RANDOMIZE] or not? AFTER FIRST ITEM, ASK “In the past 24 hours, did you [INSERT ITEM], or not? ASK ITEMS B,C,&E ONLY IF INTERNET USER (1 IN Q.38 OR 1 IN Q.39): a. Send or receive a text message on a cell phone Total 18-25 26+ 19 51 14 Yes 81 49 86 No * * * Don’t know/Refused (VOL) 100 100 100 b. Send or receive an e-mail message Total 18-25 26+ 49 50 49 Yes 26 38 24 No 25 12 27 Not an internet/email user * 0 * Don’t know/Refused (VOL) 100 100 100
  60. 58 Q.47 CONTINUED... c. Send or receive an instant message

    Total 18-25 26+ 16 29 14 Yes 59 59 59 No 25 12 27 Not an internet/email user * 0 * Don’t know/Refused (VOL) 100 100 100 d. Write or receive a personal letter Total 18-25 26+ 20 14 21 Yes 80 85 79 No * 1 * Don’t know/Refused (VOL) 100 100 100 e. Post a message to someone’s personal online profile Total 18-25 26+ 9 21 7 Yes 66 67 66 No 25 12 27 Not an internet/email user * 0 * Don’t know/Refused (VOL) 100 100 100 ASK IF AGE < 26: Q.48 And now thinking about the past seven days, did you [INSERT ITEM; RANDOMIZE] or not? ---Based on 18-25--- Yes No DK/Ref a. Smoke cigarettes 31 69 0=100 b. Drink alcohol 41 59 0=100 c. Play video games 36 64 0=100 d. Exercise or engage in physical activity 81 19 *=100 e. Take illegal drugs 9 91 *=100 ASK IF AGE <65: Q.49 Do you have, or have you ever had [INSERT ITEM; RANDOMIZE]: a. A tattoo 18-64 18-25 26-64 24 36 22 Yes 76 64 78 No 0 0 0 Don’t know/Refused (VOL) 100 100 100 (N=1275) (N=579) (N=696)
  61. 59 Q.49 CONTINUED... b. A piercing in a place other

    than your ear lobe 18-64 18-25 26-64 15 30 12 Yes 85 70 88 No 0 0 0 Don’t know/Refused (VOL) 100 100 100 (N=1275) (N=579) (N=696) c. Dyed hair in an untraditional color 18-64 18-25 26-64 17 25 16 Yes 83 75 84 No 0 0 0 Don’t know/Refused (VOL) 100 100 100 (N=1275) (N=579) (N=696) NO QUESTIONS 50-58 Now on a different subject… ASK ALL: Q.59 Here are some pairs of statements that will help us understand how you feel about a number of things. As I read each pair, tell me whether the FIRST statement or the SECOND statement comes closer to your own views — even if neither is exactly right. The first pair is... (READ AND RANDOMIZE) a. Total 18-25 26+ 49 41 50 Government is almost always wasteful and inefficient OR... 40 53 38 Government often does a better job than people give it credit for 8 4 9 Neither/ Both equally (VOL) 3 2 3 DK/Ref 100 100 100 b. Total 18-25 26+ 41 52 39 Immigrants today strengthen our country because of their hard work and talents OR... 41 38 42 Immigrants today are a burden on our country because they take our jobs, housing and health care 14 6 15 Neither/ Both equally (VOL) 4 4 4 DK/Ref 100 100 100 c. Total 18-25 26+ 28 25 29 The best way to ensure peace is through military strength OR... 57 63 56 Good diplomacy is the best way to ensure peace 10 6 11 Neither/ Both equally (VOL) 5 6 4 DK/Ref 100 100 100
  62. 60 Q.59 CONTINUED... d. Total 18-25 26+ 51 58 50

    Homosexuality is a way of life that should be accepted by society OR... 38 32 39 Homosexuality is a way of life that should be discouraged by society 8 6 8 Neither/ Both equally (VOL) 3 4 3 DK/Ref 100 100 100 e. Total 18-25 26+ 59 50 61 I'm generally satisfied with the way things are going for me financially OR... 40 47 38 I'm not very satisfied with my financial situation 1 2 1 Neither/ Both equally (VOL) * 1 * DK/Ref 100 100 100 f. Total 18-25 26+ 37 42 36 The government should do more to protect morality in society OR… 51 49 52 I worry the government is getting too involved in the issue of morality 7 3 8 Neither/ Both equally (VOL) 5 6 4 DK/Ref 100 100 100 Q.60 And here are a few things some people do. For each one, please tell me if you think it’s something that’s okay or not okay for other people to do – even if you might not do it yourself. The first one is... [INSERT ITEM AND RANDOMIZE] Is it okay or not okay for other people to [INSERT ITEM]? a. Drink a lot of alcohol Total 18-25 26+ 18 30 16 Okay 78 68 80 Not okay 3 2 3 Depends (VOL) 1 0 1 DK/Ref 100 100 100 b. Gamble Total 18-25 26+ 56 67 54 Okay 37 30 39 Not okay 6 3 6 Depends (VOL) 1 * 1 DK/Ref 100 100 100
  63. 61 Q.60 CONTINUED… NO ITEMS c AND d e. Smoke

    marijuana Total 18-25 26+ 31 41 29 Okay 63 57 64 Not okay 5 2 6 Depends (VOL) 1 * 1 DK/Ref 100 100 100 f. Download or share music or video files without paying for them Total 18-25 26+ 22 46 18 Okay 72 52 75 Not okay 3 1 3 Depends (VOL) 3 1 4 DK/Ref 100 100 100 g. Use cable TV or wireless connection without paying for it Total 18-25 26+ 9 19 7 Okay 89 80 91 Not okay 1 1 * Depends (VOL) 1 0 2 DK/Ref 100 100 100 Q.61 Do you happen to know which political party has a majority in the U.S. House of Representatives? Total 18-25 26+ 62 47 64 Yes, Republican {correct} 7 9 7 Yes, Democrat 31 44 29 No/Can’t say/Don’t know/Other incorrect (VOL) 100 100 100 Q.62 How have you been getting most of your news about national and international issues? From television, from newspapers, from radio, from magazines, or from the Internet? [ACCEPT TWO ANSWERS: IF ONLY ONE RESPONSE IS GIVEN, PROBE FOR ADDITIONAL RESPONSE] Jan 1999 Total 18-25 26+ 18-25 74 63 76 Television 80 37 26 39 Newspapers 29 21 29 19 Internet 12 16 11 17 Radio 21 4 2 5 Magazines 3 3 4 3 Other (VOL) 2 1 2 * Don't know/Refused (VOL) --
  64. 62 Q.63 How much do you enjoy keeping up with

    the news – a lot, some, not much, or not at all? April 1998 Total 18-25 26+ 18-25 47 31 50 A lot 29 33 42 31 Some 49 15 17 14 Not much 18 5 9 4 Not at all 4 * 1 1 Don't know/Refused (VOL) 0 100 100 100 100 Q.64 Here are a couple of statements. Please tell me if you agree or disagree with each one. [READ AND ROTATE] a. If something in the news is important enough I’ll find out about it without having to pay close attention Total 18-25 26+ 53 63 51 Agree 45 36 46 Disagree 2 1 3 Don't know/Refused (VOL) 100 100 100 b. I like news sources that share my political point of view Total 18-25 26+ 54 64 53 Agree 40 32 41 Disagree 6 4 6 Don't know/Refused (VOL) 100 100 100 NO QUESTIONS 65-69 EMPLOY Are you now employed full-time, part-time or not employed? IF “NOT EMPLOYED” (3 IN EMPLOY) ASK: EMPLOY2 Is that because you are a student, retired, choose not to work, or because you’ve lost or quit a job? Total 18-25 26+ 47 44 48 Full-time 14 26 12 Part-time 38 29 39 Not employed 3 12 1 Student 18 * 22 Retired 7 4 7 Choose not to work 4 7 3 Lost or quit a job 6 5 6 Other reason (VOL: SPECIFY ) * * * Don't know/Refused (VOL) 1 1 1 Don't know/Refused (VOL) 100 100 100 (N=1501) (N=579) (N=911)
  65. 63 Q.70 and Q.70a BASED ON THOSE EMPLOYED FULL-TIME OR

    PART-TIME: Q.70 Do you now earn enough money to lead the kind of life you want, or not? May Sept 2004 1998 Total 18-25 26+ 18-25 18-25 49 30 53 Yes 29 22 50 70 46 No 69 77 1 * 1 Don't know/Refused (VOL) 2 1 100 100 100 100 100 (N=980) (N=421) (N=556) (N=143) (N=221) ASK IF 2 ‘NO’ IN Q.70: Q.70a Do you think you will be able to earn enough money in the future to lead the kind of life you want, or not? May Sept 2004 1998 Total 18-25 26+ 18-25 18-25 33 65 27 Yes 60 65 15 5 17 No 5 11 2 * 2 Don't know/Refused (VOL) 4 1 50% 70% 46% 69% 77% (N=519) (N=288) (N=229) (N=97) (N=165) Q.71 and Q.71a BASED ON THOSE NOT CURRENTLY EMPLOYED: Q.71 Do you now have enough income to lead the kind of life you want, or not? Total 18-25 26+ 53 34 56 Yes 44 63 42 No 3 3 2 Don't know/Refused (VOL) 100 100 100 (N=521) (N=158) (N=355) IF ‘NO’ (2 IN Q.71) ASK: Q.71a Do you think you will have enough income in the future to lead the kind of life you want, or not? Total 18-25 26+ 22 56 18 Yes 18 5 20 No 4 2 4 Don't know/Refused (VOL) 44% 63% 42% (N=246) (N=107) (N=135) Now, just a few questions for statistical purposes only. SEX [ENTER RESPONDENT'S SEX:] Total 18-25 26+ 48 50 47 Male 52 50 53 Female 100 100 100
  66. 64 HISP Are you, yourself, of Hispanic origin or descent,

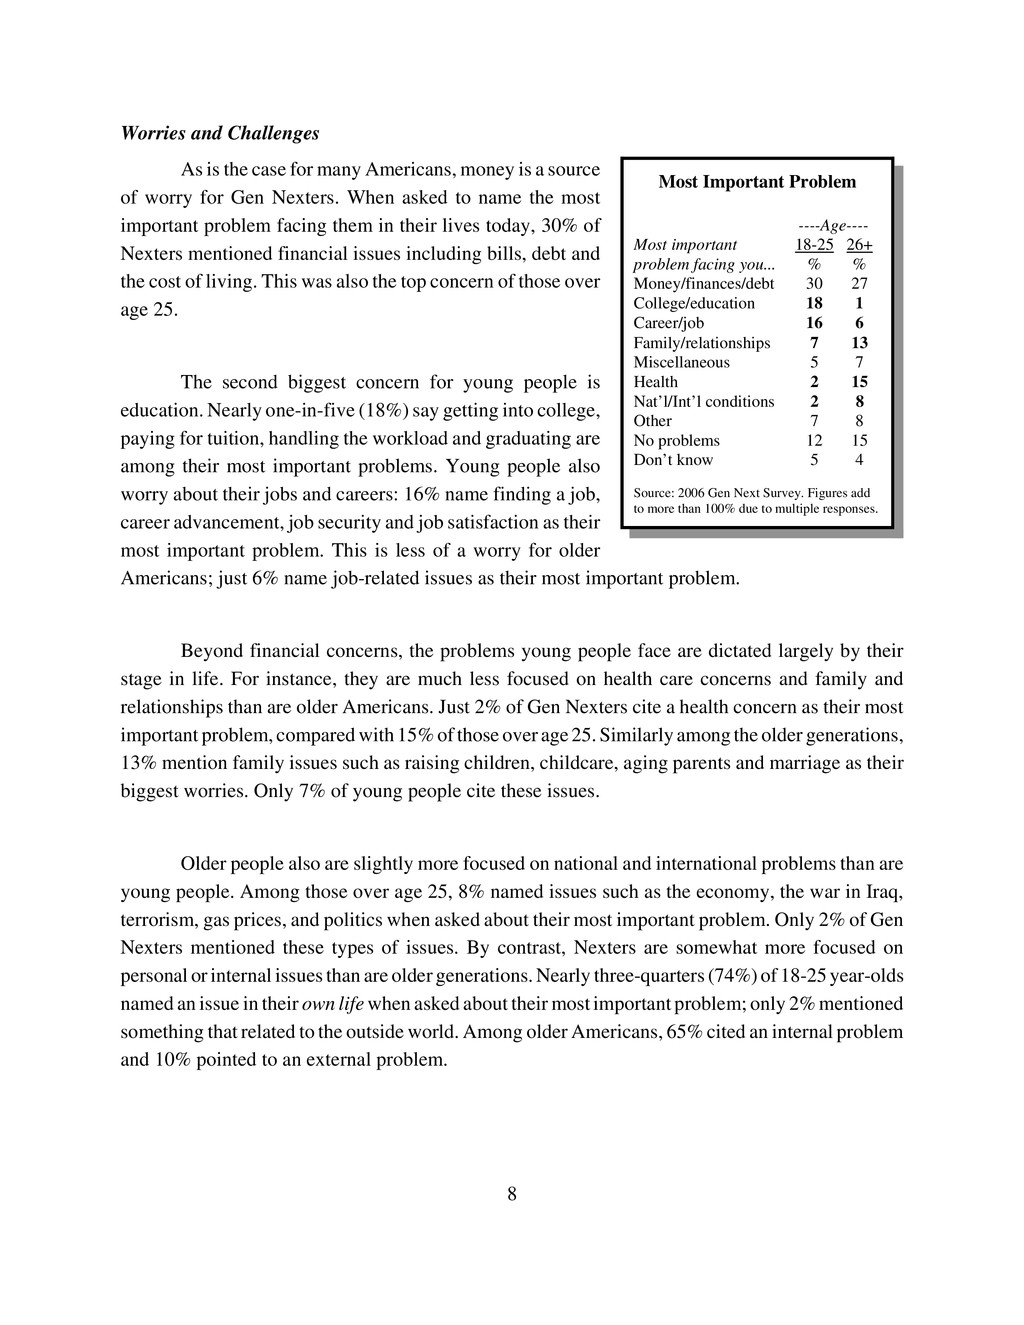
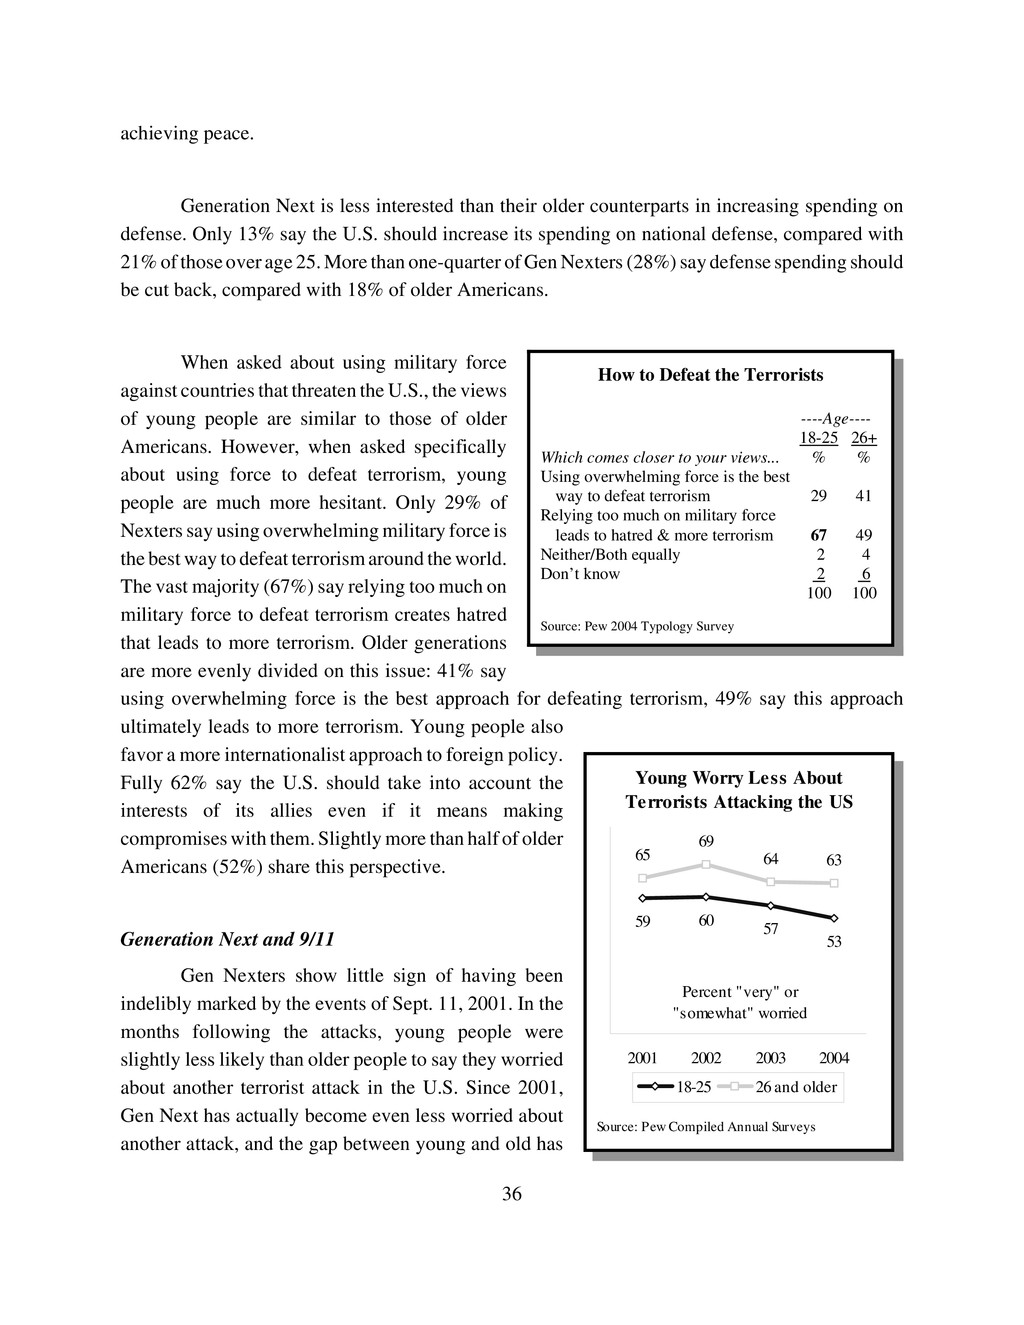
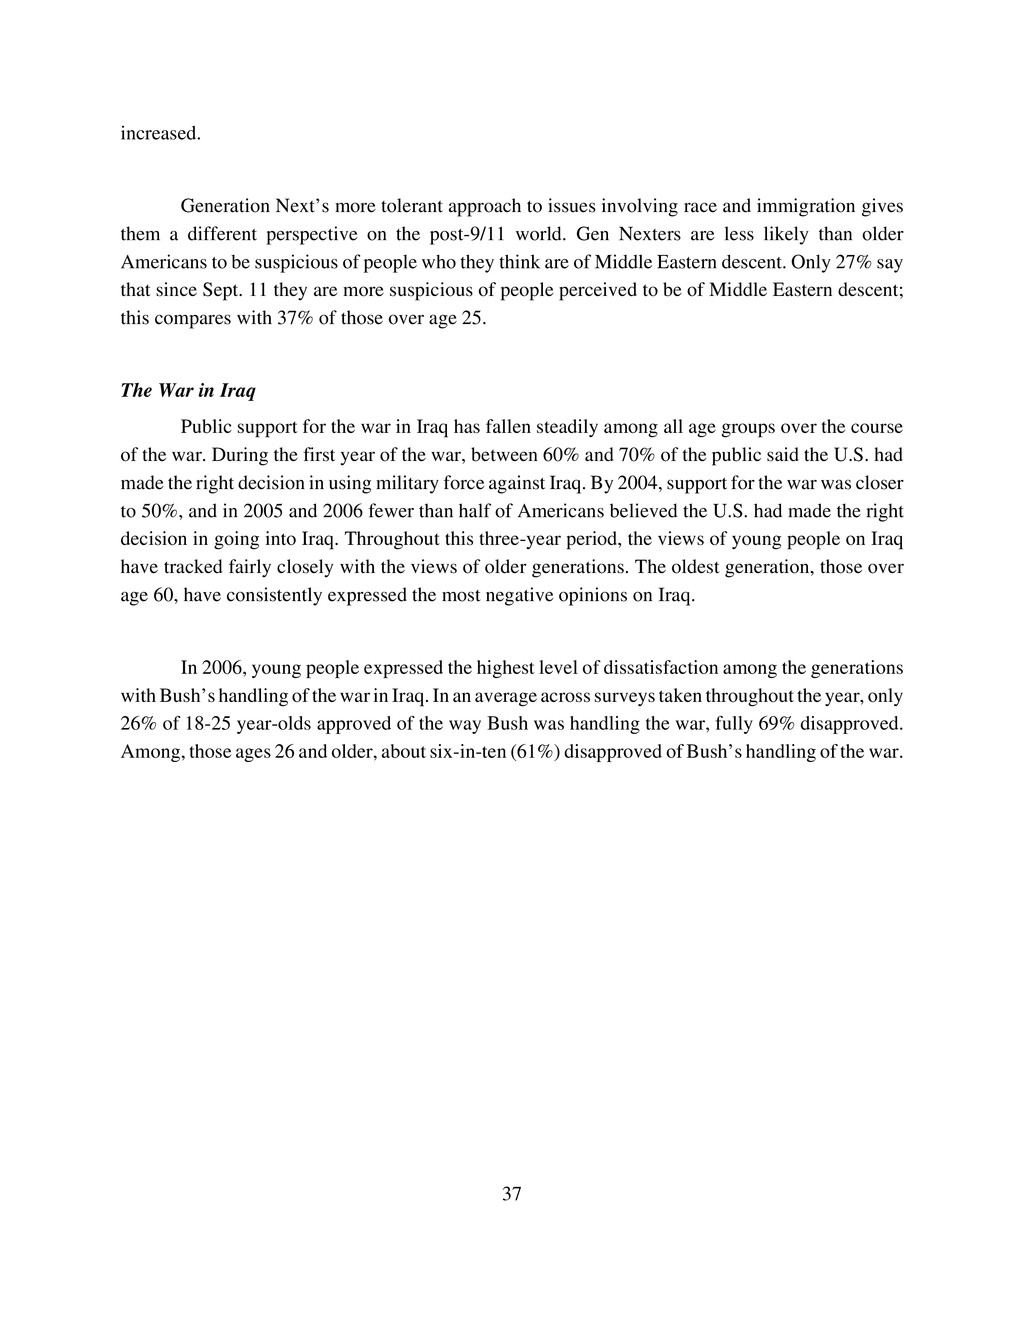
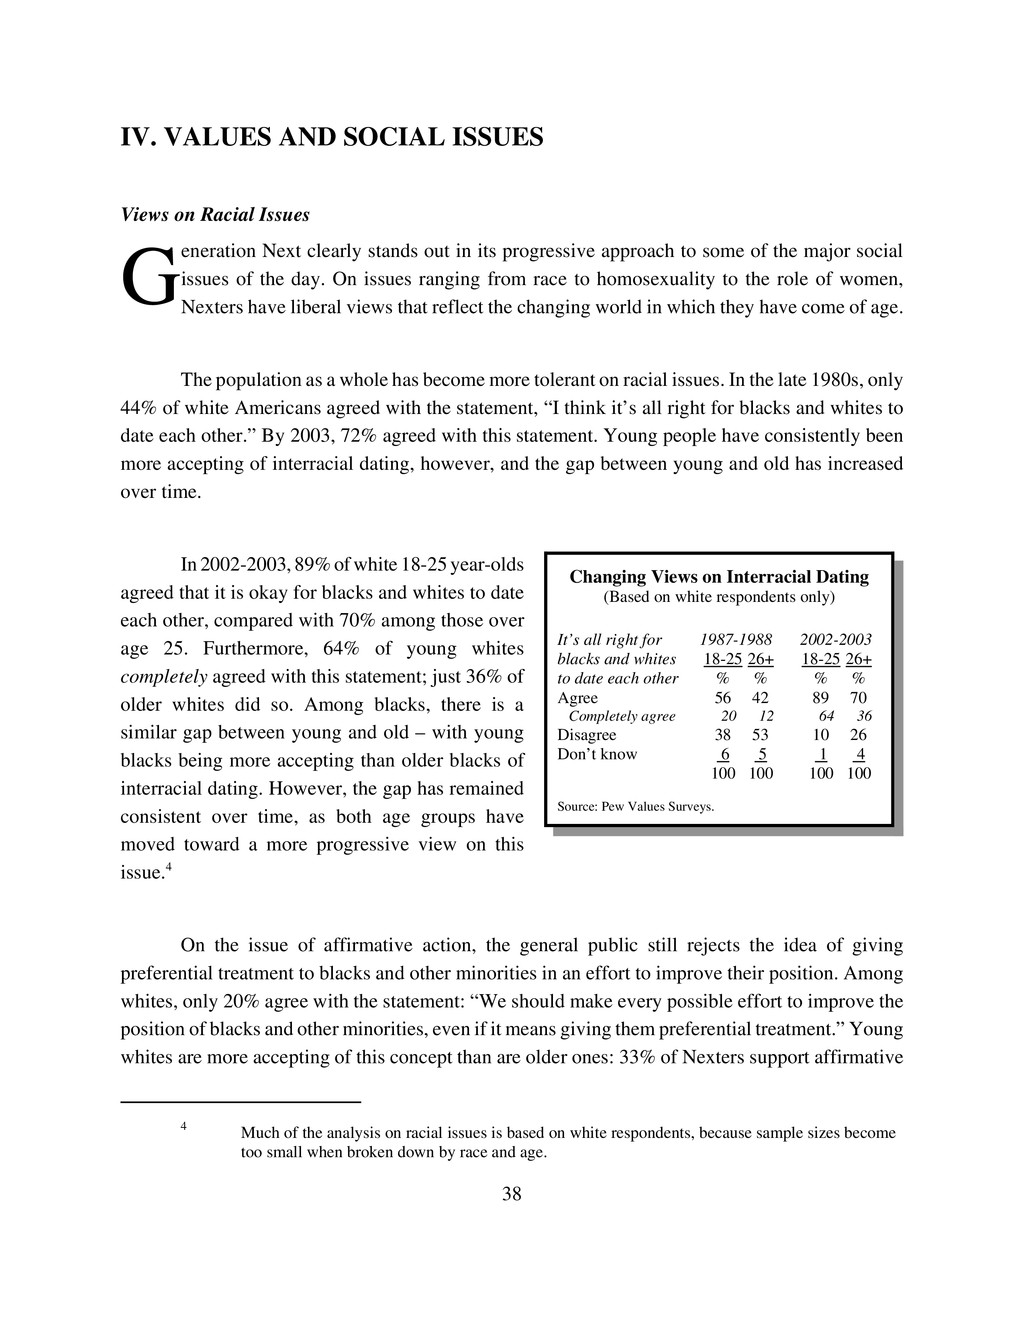
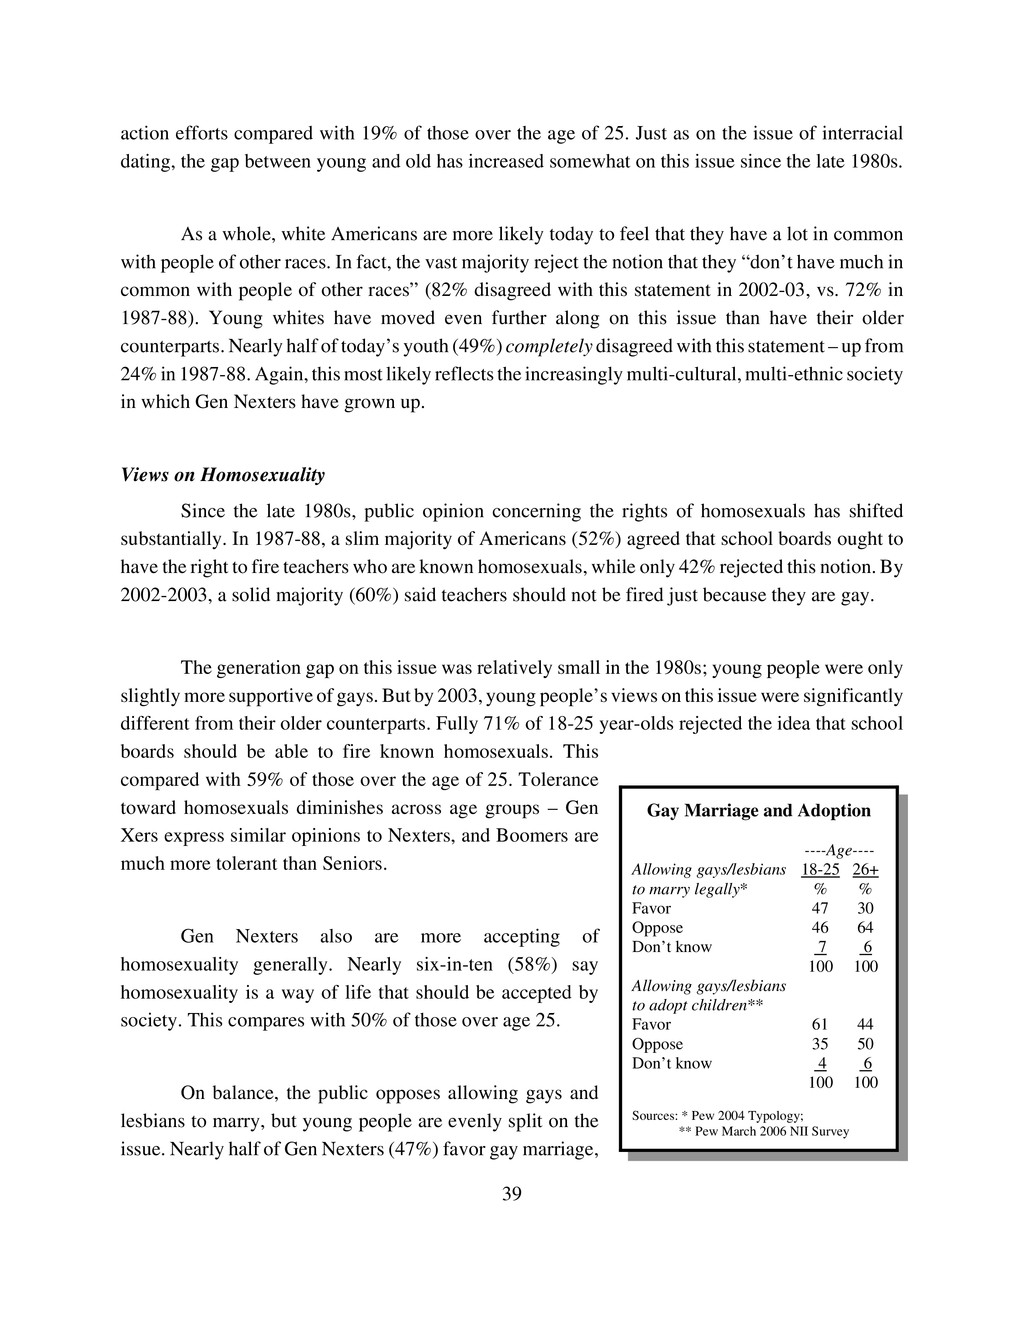
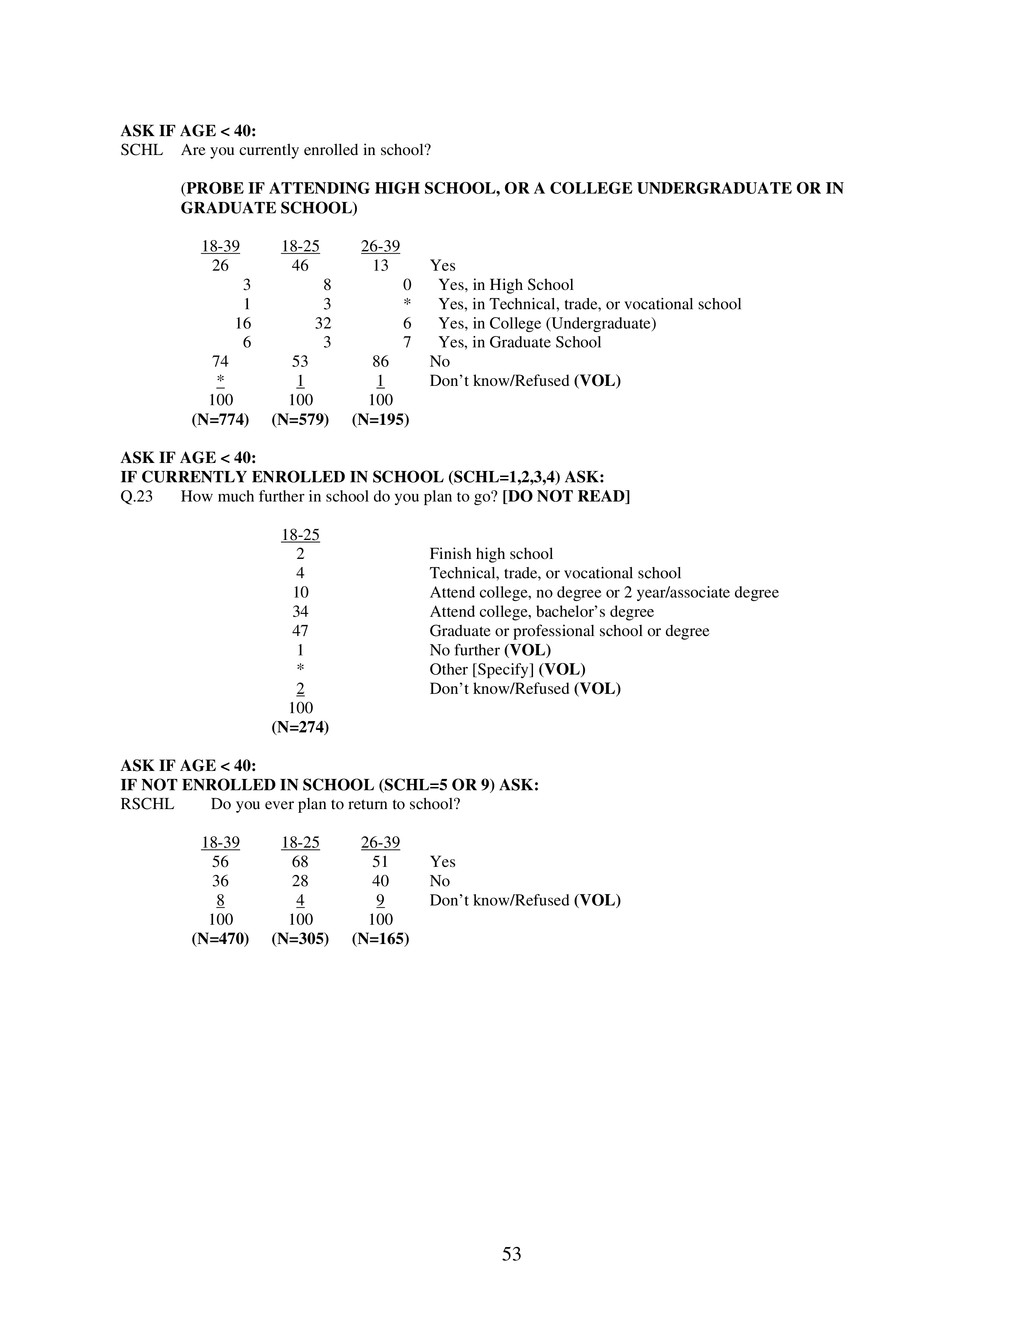
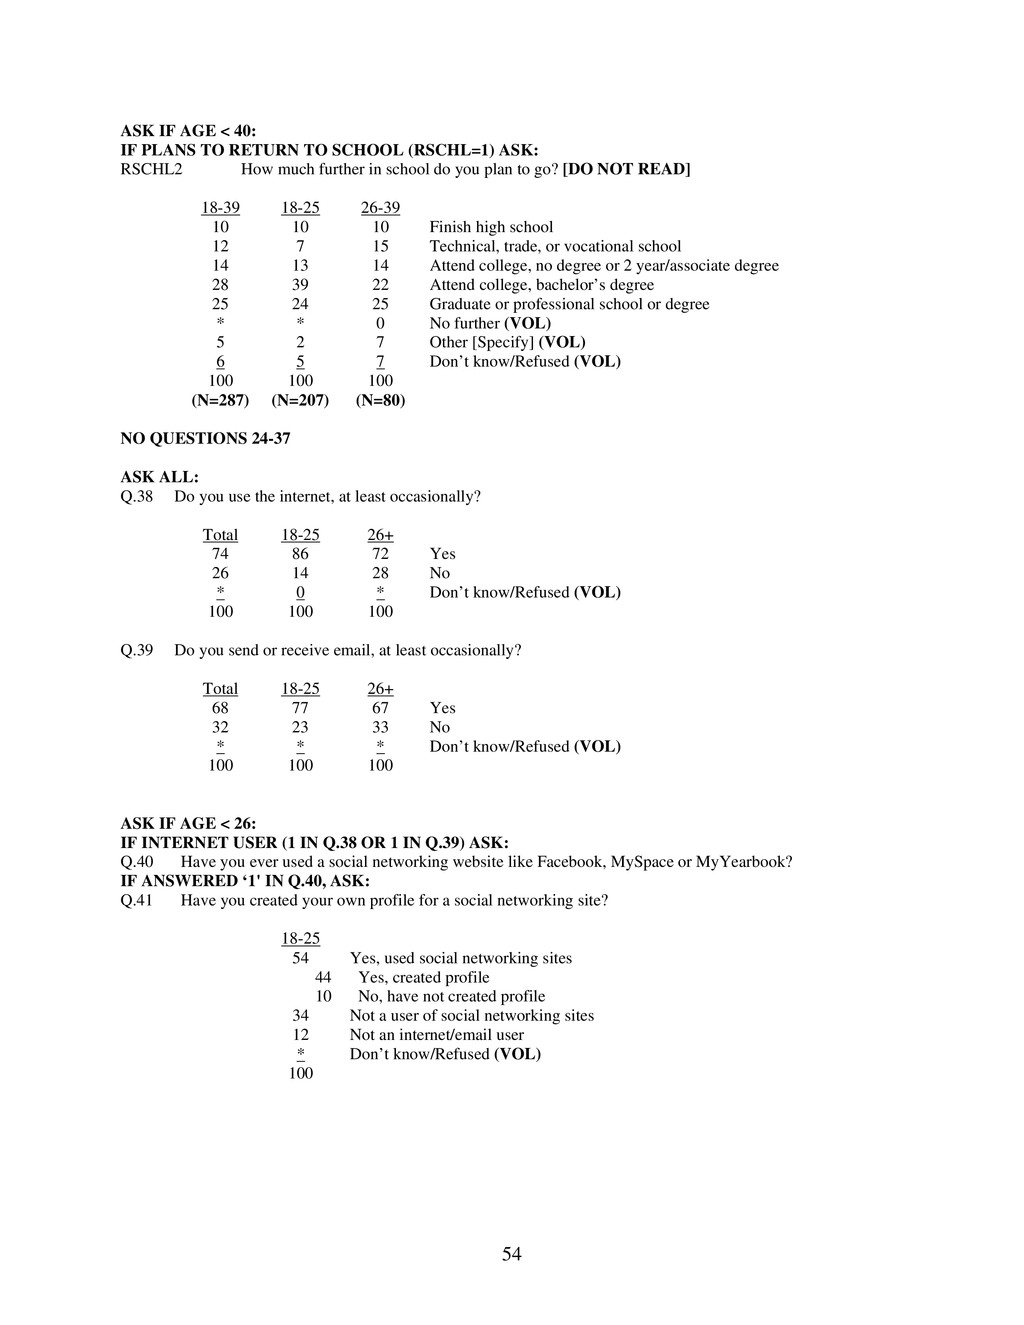
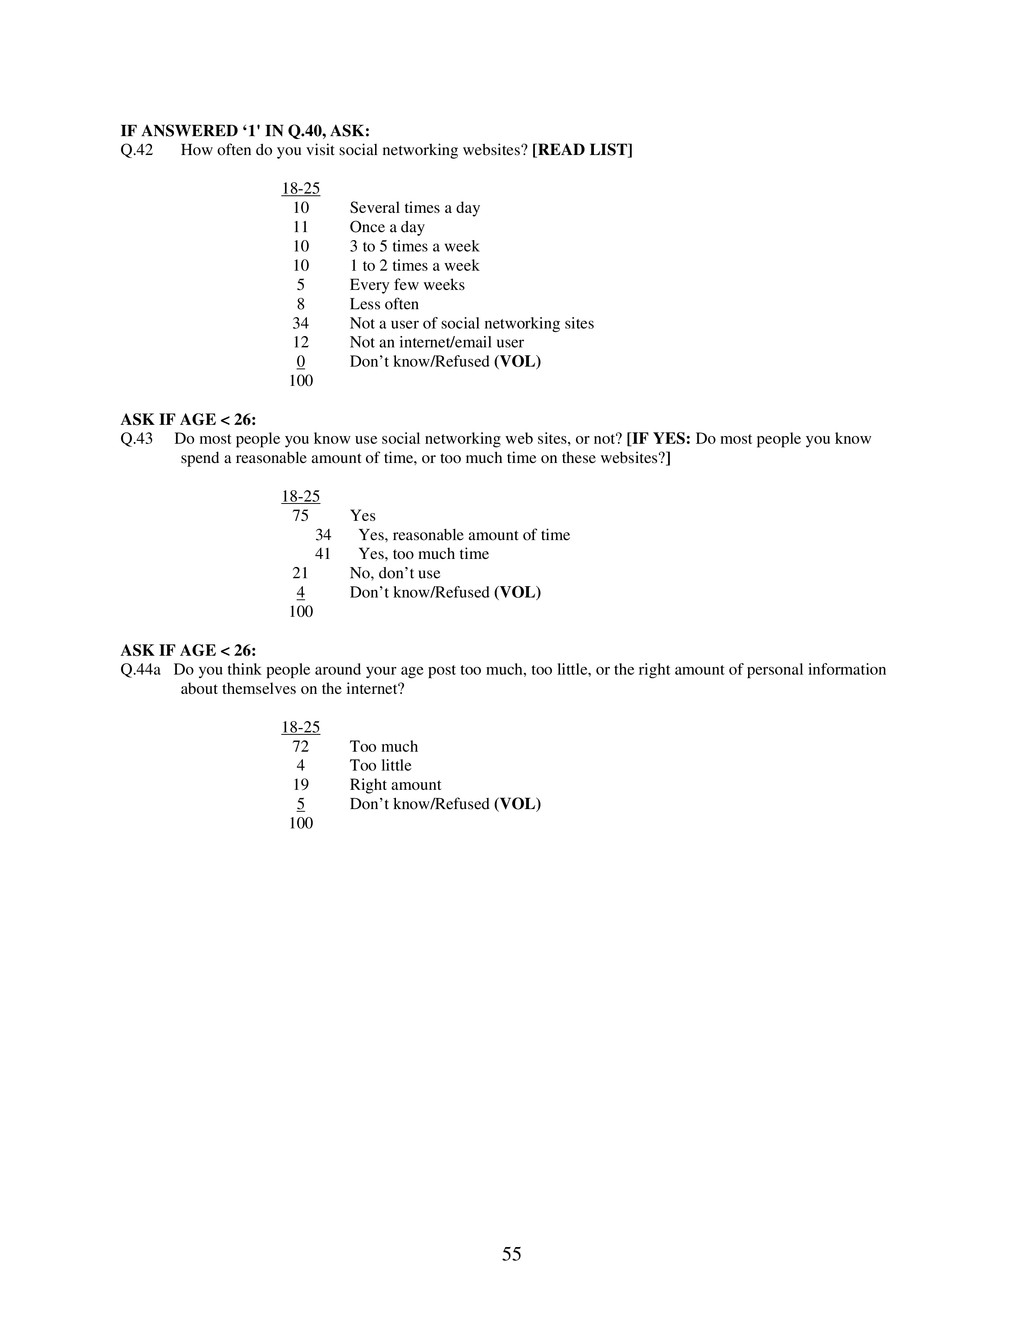
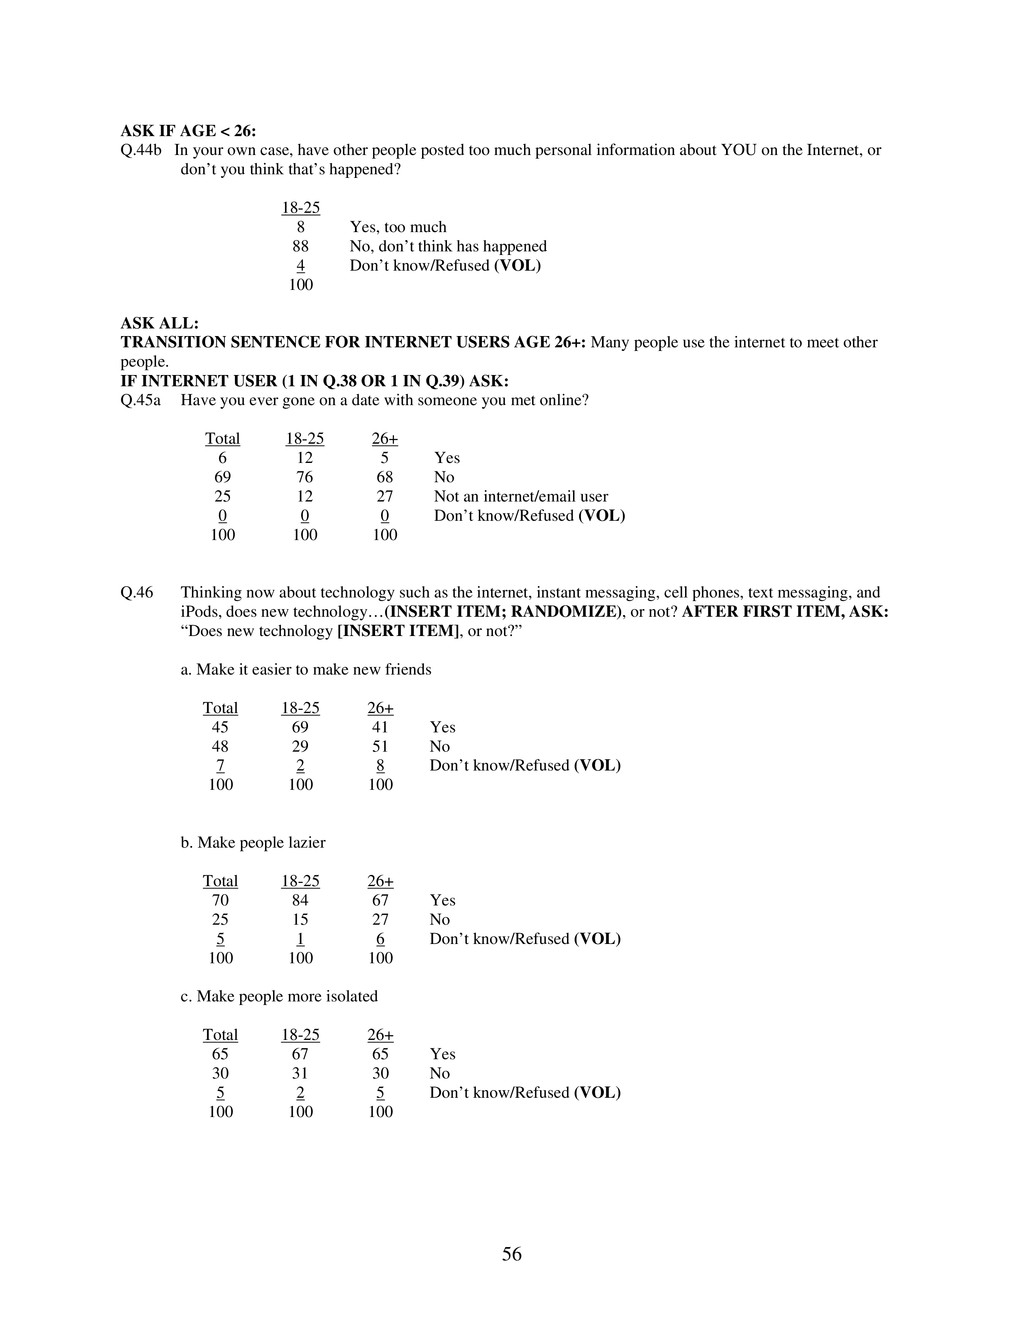
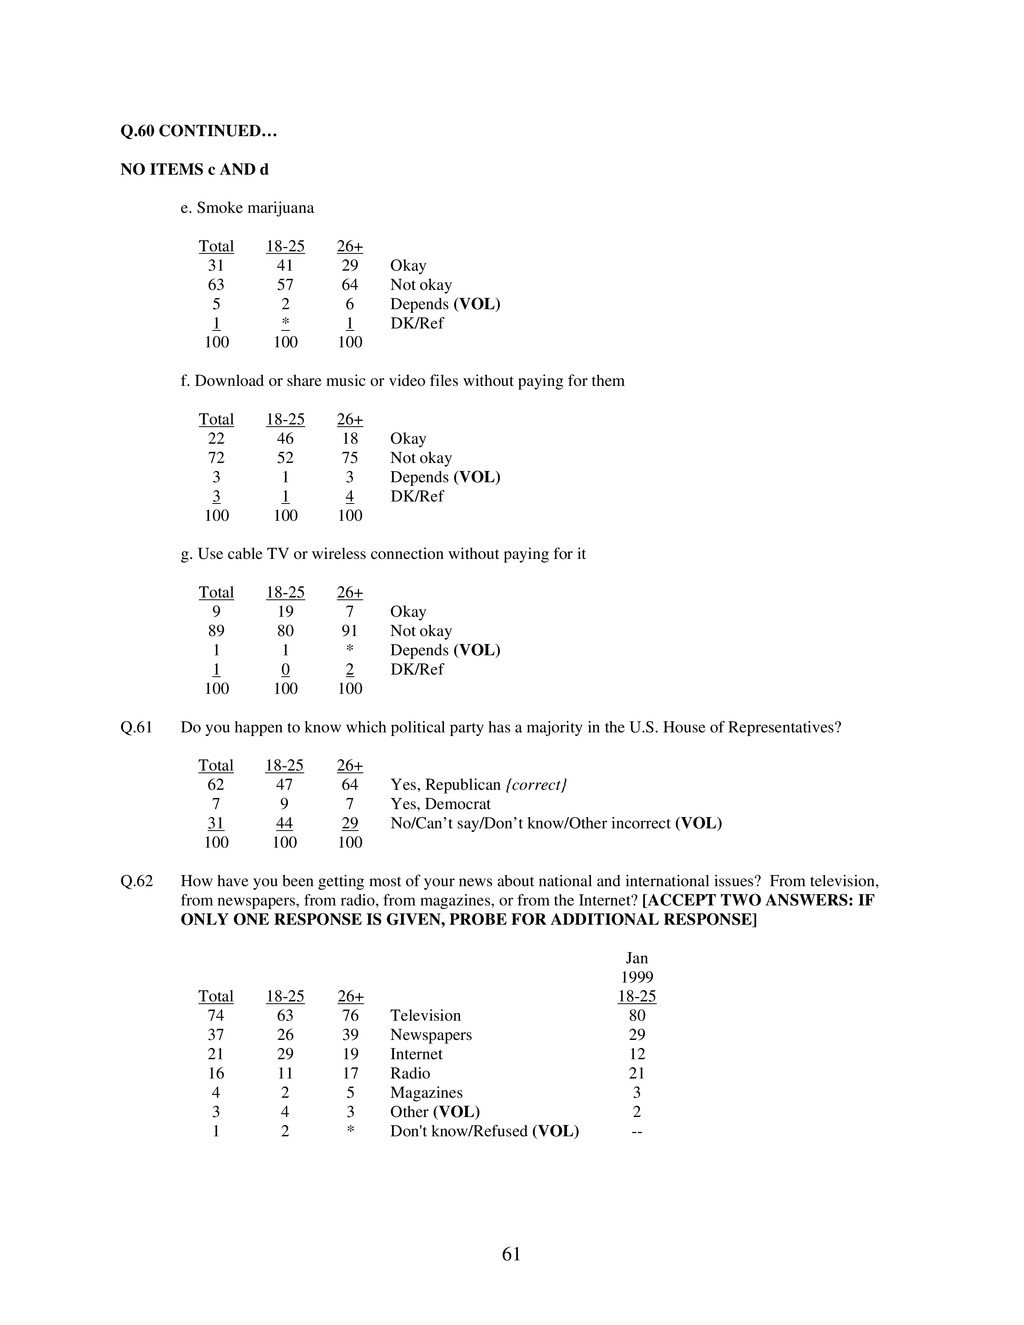
    such as Mexican, Puerto Rican, Cuban, or some other Spanish background? Total 18-25 26+ 12 18 10 Yes — SEE INSTRUCTION 87 81 88 No — GO TO RACE 1 1 2 Don't know/Refused (VOL) — GO TO RACE 100 100 100 IF RESPONDENT ANSWERED 1 ‘HISPANIC’ IN HISP, ASK: Are you white Hispanic, black Hispanic, or some other race? IF NON-HISPANIC ASK: RACE What is your race? Are you white, black, Asian, or some other? Total 18-25 26+ 78 71 79 White 11 15 10 Black 1 3 1 Asian 8 10 8 Other or mixed race 2 1 2 Don't know/Refused (VOL) 100 100 100 ASK ALL: RELIG What is your religious preference — Protestant, Roman Catholic, Jewish, Muslim, Mormon, or an orthodox church such as the Greek or Russian Orthodox Church? [INTERVIEWER: IF ‘OTHER RELIGION’ GIVEN, FOLLOW-UP WITH “And is that a Christian religion, or not?” IF YES, CODE AS 7; IF NOT, CODE AS 8] Total 18-25 26+ 50 45 51 Protestant (include Baptist, Lutheran, Methodist, Presbyterian, Episcopalian, Pentecostal, Jehovah's Witness, Church of Christ, etc.) 27 23 27 Roman Catholic 2 2 2 Jewish 2 3 3 Mormon (include Church of Jesus Christ of Latter Day Saints) 1 1 * Orthodox Church (Greek or Russian) * 1 * Islam/Muslim 2 2 2 Other religion - Christian (SPECIFY) 2 3 2 Other religion – non-Christian (SPECIFY) 12 18 11 No religion, not a believer, atheist, agnostic 2 2 2 Don't know/Refused (VOL) 100 100 100 IF CHRISTIAN (RELIG=1,2,4,5,7), ASK: BORN Would you describe yourself as a "born-again" or evangelical Christian, or not? Total 18-25 26+ 40 38 39 Yes 57 57 58 No 3 5 3 Don't know/Refused (VOL) 100 100 100 (N=1182) (N=421) (N=752)
  67. 65 ASK ALL: ATTEND Aside from weddings and funerals, how

    often do you attend religious services... more than once a week, once a week, once or twice a month, a few times a year, seldom, or never? Total 18-25 26+ 12 9 13 More than once a week 23 17 24 Once a week 15 17 14 Once or twice a month 20 24 19 A few times a year 14 14 14 Seldom 14 17 14 Never 2 2 2 Don't know/Refused (VOL) 100 100 100 INCOME Last year, that is in 2005, what was your total family income from all sources, before taxes? Just stop me when I get to the right category. [READ] Total 18-25 26+ 17 21 17 Less than $20,000 10 16 10 20 to under $30,000 19 19 19 30 to under $50,000 15 11 15 50 to under $75,000 26 18 27 $75,000 or more 13 15 12 Don't know/Refused (VOL) 100 100 100 IF AGE < 26, ASK: FINAN Do you depend on your parents or other family members for financial assistance, or not? 18-25 46 Yes 53 No 1 Don't know/Refused (VOL) 100 ASK ALL: HEALTH Are you, yourself, now covered by any form of health insurance or health plan, including Medicare or Medicaid? Total 18-25 26+ 83 67 86 Yes 16 30 13 No 1 3 1 Don't know/Refused (VOL) 100 100 100
  68. 66 REGIST These days, many people are so busy they

    can't find time to register to vote, or move around so often they don't get a chance to re-register. Are you NOW registered to vote in your precinct or election district or haven't you been able to register so far? IF RESPONDENT ANSWERED '1' YES IN REGIST ASK: REGICERT Are you absolutely certain that you are registered to vote, or is there a chance that your registration has lapsed because you moved or for some other reason? Total 18-25 26+ 80 58 84 Yes, registered 76 52 81 Absolutely certain 3 5 2 Chance registration has lapsed 1 1 1 Don't know/Refused (VOL) 17 38 14 No, not registered 3 4 2 Don't know/Refused (VOL) 100 100 100 ASK ALL: PARTY In politics TODAY, do you consider yourself a Republican, Democrat, or Independent? Total 18-25 26+ 26 23 27 Republican 32 30 32 Democrat 28 32 28 Independent 7 7 7 No preference (VOL) 1 0 1 Other party (VOL) 6 8 4 Don't know/Refused (VOL) 100 100 100 IF ANSWERED 3, 4, 5 OR 9 IN PARTY, ASK: PARTYLN As of today do you lean more to the Republican Party or more to the Democratic Party? Total 18-25 26+ 11 15 10 Republican 12 15 12 Democrat 19 17 18 Refused to lean (VOL) 42% 47% 40% (N=626) (N=263) (N=357) ASK ALL: IDEO In general, would you describe your political views as... [READ] Total 18-25 26+ 6 4 6 Very conservative 26 23 27 Conservative 40 36 41 Moderate 14 20 14 Liberal, OR 5 6 4 Very liberal 9 11 8 Don't know/Refused (VOL) 100 100 100
  69. 67 IF AGE > 25, ASK: HOME Do you own

    or rent your home? 26+ 77 Own 18 Rent 3 [DO NOT READ] Other arrangement (VOL) 2 Don't know/Refused (VOL) 100 IF AGE < 26, ASK: HOME2 Do you own your home, rent, live in a dorm or live with your parents? 18-25 14 Own 37 Rent 4 Live in a dorm 40 Live with parents 3 Other (VOL) 2 Don't know/Refused (VOL) 100