Upgrade to Pro — share decks privately, control downloads, hide ads and more …

Pew Research: Millenials

Nan Shastry
November 03, 2011

Pew Research: Millenials

This report represents the Pew Research Center’s most ambitious examination to date of America’s newest generation, the Millennials, many of whom have now crossed into adulthood. We began looking at this age group in 2006 in a comprehensive survey we conducted in association with the PBS documentary series, “Generation Next.”

Nan Shastry

November 03, 2011
Tweet

More Decks by Nan Shastry

Other Decks in Research

Transcript

  1. Pew Research Center is a nonpartisan “fact tank” that provides

    information on the issues, attitudes and trends shaping America and the world. It does so by conducting public opinion polling and social science research, by analyzing news coverage, and by holding forums and briefings. It does not take positions on policy issues. Its work is carried out by seven projects: • Pew Research Center for the People & the Press • Pew Research Center’s Project for Excellence in Journalism • Pew Internet & American Life Project • Pew Forum on Religion & Public Life • Pew Hispanic Center • Pew Global Attitudes Project • Pew Social & Demographic Trends Project It provides its research and data­ —free of charge—as a public service to policymakers, researchers, journalists and the general public. All publications and datasets can be accessed via PewResearch.org, which is a portal to a network of Pew Research websites.
  2. PewResearchCenter Millennials Confident. Connected. Open to Change. This publication is

    part of a Pew Research Center report series that looks at the values, attitudes and experiences of America’s next generation: the Millennials. Find out how today’s teens and twentysomethings are reshaping the nation at: www.pewresearch.org/millennials.
  3. Preface This report represents the Pew Research Center’s most ambitious

    examination to date of America’s newest generation, the Millennials, many of whom have now crossed into adulthood. We began looking at this age group in 2006 in a comprehensive survey we conducted in association with the PBS documentary series, “Generation Next.” Our new report greatly expands on that seminal work. In the pages that follow we set out to compare the values, attitudes and behaviors of Millennials with those of today’s older adults. And to the extent that we can, we also compare them with older adults back when they were the age that Millennials are now. But we undertake this exercise in generational portraiture with a healthy dose of humility. We know that, in one sense, it’s too easy – and in another, it’s too hard. It’s too easy because most readers don’t need a team of researchers to tell them that the typical 20-year-old, 45- year-old and 70-year-old are likely to be different from one another. People already know that. It’s too difficult because, try as we might, we know we can never completely disentangle the multiple reasons that generations differ. At any given moment in time, age group differences can be the result of three overlapping processes: 1) Life cycle effects. Young people may be different from older people today, but they may well become more like them tomorrow, once they themselves age. 2) Period effects. Major events (wars; social movements; economic downturns; medical, scientific or technological breakthroughs) affect all age groups simultaneously, but the degree of impact may differ according to where people are located in the life cycle. 3) Cohort effects. Period events and trends often leave a particularly deep impression on young adults because they are still developing their core values; these imprints stay with them as they move through their life cycle. It’s not always possible to identify – much less unpack and analyze – these various processes. On many measures, the long-term trend data needed to make comparisons simply do not exist. Also, while generations may have personalities, they are not monolithic. There are as many differences within generations as there are among generations. Moreover, the composition of a given age cohort can change over time as result of demographic factors such as immigration and differential mortality. Finally, even if we had a full set of long-term data, we know that the discrete effects of life cycle, cohort and period cannot be statistically separated from one another with absolute certainty. Nonetheless, we believe this journey is worth taking. All of us know people who still bear the marks of their distinctive coming-of-age experiences: the grandmother raised during the Depression who reuses her tea bags; the child of the Cold War who favors an assertive national security policy; the uncle who grew up in the 1960s and sports a pony tail. We don’t yet know which formative experiences the Millennials will carry forward throughout their life cycle. But we hope that the findings presented here begin to shine a light on what they are like today – and on what America might be like tomorrow. Paul Taylor and Scott Keeter, editors
  4. Table of Contents About the Report ............................................................................................ i 1 Overview.............................................................................................

    1 2 Demography......................................................................................... 9 3 Identity, Priorities, Outlook ....................................................................13 4 Technology and Social Media ...................................................................25 5 Work and Education ..............................................................................39 6 Family Values .....................................................................................51 7 Lifestyle.............................................................................................57 8 Politics, Ideology and Civic Engagement ...................................................63 9 Religious Beliefs and Behaviors ..............................................................85 Appendices Survey Methodology ......................................................................................110 Topline questionnaire ....................................................................................113
  5. i About the Report This report on the values, attitudes,

    behaviors and demographic characteristics of the Millennial generation was prepared by the Pew Research Center, a nonpartisan “fact tank” that provides information on the issues, attitudes and trends shaping America and the world. The Center does not take positions on policy issues. Findings in this study are mainly based on the results of a telephone survey conducted Jan. 14 to 27, 2010, on landlines and cell phones with a nationally representative sample of 2,020 adults. To allow for a detailed analysis of attitudes of the Millennial generation, the survey includes an oversample of respondents ages 18 to 29, for a total of 830 respondents in this age group. The margin of error due to sampling is plus or minus 3 percentage points for the full sample and plus or minus 4 percentage points for the sample of Millennials. Interviews were conducted in English or Spanish. The survey field work was carried out by Abt SRBI Inc. For a full description of the research methodology, see page 110. A note on terminology used in this report: Whites include only non- Hispanic whites. Blacks include only non-Hispanic blacks. Hispanics are of any race. Data from this 2010 survey were supplemented by findings from many other Pew Research Center surveys, including two relatively recent ones: a survey on changing attitudes toward work conducted Oct. 21-25, 2009, with a nationally representative sample of 1,028 respondents ages 18 and older and a survey on generational differences conducted July 20-Aug. 2, 2009, with a nationally representative sample of 1,815 people ages 16 and older.1 The chapter on demography (Chapter 2) is based on a Pew Research Center analysis of census data. The chapter on technology (Chapter 4) draws on the 2010 survey as well as on surveys conducted over the years by the Pew Research Center’s Internet & American Life Project. The chapter on political ideology and engagement (Chapter 8) is based on data from the 2010 survey as well as on our analysis of more than 20 years of data from polls on political and social values conducted by the Pew Research Center for the People & the Press. The chapter on religious beliefs and behaviors (Chapter 9) draws on surveys conducted over the years by the Pew Research Center’s Forum on Religion & Public Life, the General Social Survey and the Gallup organization. The following people at the Center carried out this project: Andrew Kohut, President Paul Taylor, Executive Vice President Scott Keeter, Director of Survey Research Kim Parker, Senior Researcher Rich Morin, Senior Editor D’Vera Cohn, Senior Writer Mark Hugo Lopez, Senior Researcher Gregory Smith, Senior Researcher Richard Fry, Senior Researcher 1 To view the report summarizing the results of the work survey, go to http://pewsocialtrends.org/pubs/742/americas-changing-work-force. The report on generational differences is at http://pewsocialtrends.org/pubs/739/woodstock-gentler-generation-gap-music-by-age.
  6. ii Wendy Wang, Research Associate Leah Melani Christian, Research Associate

    Allison Pond, Research Associate Scott Clement, Research Analyst Others at the Center who contributed to this report include: Jodie Allen, Alan Cooperman, Michael Dimock, Daniel Dockterman, Carroll Doherty, Elizabeth Mueller Gross, Russell Heimlich, Juliana Menasce Horowitz, Michael Keegan, Jocelyn Kiley, Rakesh Kochhar, Vidya Krishnamurthy, Amanda Lenhart, Gretchen Livingston, Luis Lugo, Mary Madden, Tracy Miller, Robert Mills, Shawn Neidorf, Alicia Parlapiano, Jeffrey Passel, Michael Piccorossi, Jacob Poushter, Lee Rainie, Hilary Ramp, Michael Remez, Rob Suls, Tom Rosenstiel, Mary Schultz, Kathleen Holzwart Sprehe, Sandra Stencel, Alec Tyson, Gabriel Velasco and Diana Yoo.
  7. Chapter 1: Overview 1 Chapter 1: Overview Generations, like people,

    have personalities, and Millennials – the American teens and twenty-somethings who are making the passage into adulthood at the start of a new millennium – have begun to forge theirs: confident, self-expressive, liberal, upbeat and open to change. They are more ethnically and racially diverse than older adults. They’re less religious, less likely to have served in the military, and are on track to become the most educated generation in American history. Their entry into careers and first jobs has been badly set back by the Great Recession, but they are more upbeat than their elders about their own economic futures as well as about the overall state of the nation. They are history’s first “always connected” generation. Steeped in digital technology and social media, they treat their multi-tasking hand-held gadgets almost like a body part – for better and worse. More than eight-in-ten say they sleep with a cell phone glowing by the bed, poised to disgorge texts, phone calls, emails, songs, news, videos, games and wake-up jingles. But sometimes convenience yields to temptation. Nearly two-thirds admit to texting while driving. (Chapter 4). They embrace multiple modes of self-expression. Three- quarters have created a profile on a social networking site. One-in-five have posted a video of themselves online. Nearly four-in-ten have a tattoo (and for most who do, one is not enough: about half of those with tattoos have two to five and 18% have six or more). Nearly one-in-four have a piercing in some place other than an earlobe – about six times the share of older adults who’ve done this. But their look-at-me tendencies are not without limits. Most Millennials have placed privacy boundaries on their social media profiles. And 70% say their tattoos are hidden beneath clothing. (Chapters 4 and 7). The New Face of America Millennials (ages 18-29) Adults ages 30 and older 61% 14% 5% 19% Black Asian Hispanic White Other 70% 11% 5% 13% Black Asian Hispanic White Other Source: December 2009 Current Population Survey (CPS) Do You Have a Profile on a Social Networking Site? % saying “yes” 41 75 50 30 6 All Millennial (18-29) Gen X (30-45) Boomer (46-64) Silent (65+)
  8. Chapter 1: Overview 2 Despite struggling (and often failing) to

    find jobs in the teeth of a recession, about nine- in-ten either say that they currently have enough money or that they will eventually meet their long-term financial goals. But at the moment, fully 37% of 18- to 29-year- olds are unemployed or out of the workforce, the highest share among this age group in more than three decades. Research shows that young people who graduate from college in a bad economy typically suffer long-term consequences – with effects on their careers and earnings that linger as long as 15 years.2 (Chapter 5). Whether as a by-product of protective parents, the age of terrorism or a media culture that focuses on dangers, they cast a wary eye on human nature. Two-thirds say “you can't be too careful” when dealing with people. Yet they are less skeptical than their elders of government. More so than other generations, they believe government should do more to solve problems. (Chapter 8). They are the least overtly religious American generation in modern times. One-in-four are unaffiliated with any religion, far more than the share of older adults when they were ages 18 to 29. Yet not belonging does not necessarily mean not believing. Millennials pray about as often as their elders did in their own youth. (Chapter 9). Only about six-in-ten were raised by both parents – a smaller share than was the case with older generations. In weighing their own life priorities, Millennials (like older adults) place parenthood and marriage far above career and financial success. But they aren’t rushing to the altar. Just one-in-five Millennials (21%) are married now, half the share of their parents’ generation at the same stage of life. About a third (34%) are parents, according to the Pew Research survey. We estimate that, in 2006, more than a third of 18 to 29 year old women who gave birth were unmarried. This is a far higher share than was the case in earlier generations. 3 (Chapters 2 and 3). Millennials are on course to become the most educated generation in American history, a trend driven largely by the demands of a modern knowledge-based economy, but most likely accelerated in recent years by the millions of 20-somethings enrolling in graduate schools, colleges or community colleges in part because they can’t find a 2 Lisa B. Kahn. “The Long-Term Labor Market Consequences of Graduating from College in a Bad Economy,” Yale School of Management, Aug. 13, 2009 (forthcoming in Labour Economics). 3 This Pew Research estimate is drawn from our analysis of government data for women ages 18 to 29 who gave birth in 2006, the most recent year for which such data is available. Martin, Joyce A., Brady E. Hamilton, Paul D. Sutton, Stephanie J. Ventura, Fay Menacker, Sharon Kirmeyer, and TJ Mathews. Births: Final Data for 2006. National Vital Statistics Reports; vol 57 no 7. Hyattsville, Maryland: National Center for Health Statistics. 2009. Millennials’ Priorities % saying … is one of the most important things in their lives 52 30 21 20 15 15 9 1 Being a good parent Having a successful marriage Helping others in need Owning a home Living a very religious life Having a high-paying career Having lots of free time Becoming famous Note: Based on adults ages 18-29.
  9. Chapter 1: Overview 3 job. Among 18 to 24 year

    olds a record share – 39.6% – was enrolled in college as of 2008, according to census data. (Chapter 5). They get along well with their parents. Looking back at their teenage years, Millennials report having had fewer spats with mom or dad than older adults say they had with their own parents when they were growing up. And now, hard times have kept a significant share of adult Millennials and their parents under the same roof. About one-in-eight older Millennials (ages 22 and older) say they’ve “boomeranged” back to a parent’s home because of the recession. (Chapters 3 and 5). They respect their elders. A majority say that the older generation is superior to the younger generation when it comes to moral values and work ethic. Also, more than six-in-ten say that families have a responsibility to have an elderly parent come live with them if that parent wants to. By contrast, fewer than four-in-ten adults ages 60 and older agree that this is a family responsibility. Despite coming of age at a time when the United States has been waging two wars, relatively few Millennials—just 2% of males— are military veterans. At a comparable stage of their life cycle, 6% of Gen Xer men, 13% of Baby Boomer men and 24% of Silent men were veterans. (Chapter 2). Politically, Millennials were among Barack Obama's strongest supporters in 2008, backing him for president by more than a two-to-one ratio (66% to 32%) while older adults were giving just 50% of their votes to the Democratic nominee. This was the largest disparity between younger and older voters recorded in four decades of modern election day exit polling. Moreover, after decades of low voter participation by the young, the turnout gap in 2008 between voters under and over the age of 30 was the smallest it had been since 18- to 20- year-olds were given the right to vote in 1972. (Chapter 8). But the political enthusiasms of Millennials have since cooled —for Obama and his message of change, for the Democratic Party and, quite possibly, for politics itself. About half of Millennials say the president has failed to change the way Washington works, which had been the central promise of his candidacy. Of those who say this, three-in-ten blame Obama himself, while more than half blame his political opponents and special interests. To be sure, Millennials remain the most likely of any generation to self-identify as liberals; they are less supportive than their elders of an assertive national security policy and more supportive of a progressive Democratic Advantage Narrows Among Millennial Voters (%) 40 30 37 53 54 62 2000 2004 2008 Republican/Lean R Republican/Lean R Democrat/Lean D Democrat/Lean D Millennials Other age groups 2009 Note: Based on registered voters. Figures show net leaned party identification as yearly totals from 2000 through 2008 and quarterly for 2009. Source: Pew Reseach Center surveys
  10. Chapter 1: Overview 4 domestic social agenda. They are still

    more likely than any other age group to identify as Democrats. Yet by early 2010, their support for Obama and the Democrats had receded, as evidenced both by survey data and by their low level of participation in recent off-year and special elections. (Chapter 8). Our Research Methods This Pew Research Center report profiles the roughly 50 million Millennials who currently span the ages of 18 to 29. It’s likely that when future analysts are in a position to take a fuller measure of this new generation, they will conclude that millions of additional younger teens (and perhaps even pre-teens) should be grouped together with their older brothers and sisters. But for the purposes of this report, unless we indicate otherwise, we focus on Millennials who are at least 18 years old. We examine their demographics; their political and social values; their lifestyles and life priorities; their digital technology and social media habits; and their economic and educational aspirations. We also compare and contrast Millennials with the nation’s three other living generations—Gen Xers (ages 30 to 45), Baby Boomers (ages 46 to 64) and Silents (ages 65 and older). Whenever the trend data permit, we compare the four generations as they all are now— and also as older generations were at the ages that adult Millennials are now.4 Most of the findings in this report are based on a new survey of a national cross-section of 2,020 adults (including an oversample of Millennials), conducted by landline and cellular telephone from Jan. 14 to 27, 2010; this survey has a margin of error of plus or minus 3.0 percentage points for the full sample and larger percentages for various subgroups (for more details, see page 110). The report also draws on more than 4 We do not have enough respondents ages 83 and older in our 2010 survey to permit an analysis of the Greatest Generation, which is usually defined as encompassing adults born before 1928. Throughout much of this report, we have grouped these older respondents in with the Silent generation. However, Chapter 8 on politics and Chapter 9 on religion each draw on long-term trend data from other sources, permitting us in some instances in those chapters to present findings about the Greatest Generation. What’s in a Name? Generational names are the handiwork of popular culture. Some are drawn from a historic event; others from rapid social or demographic change; others from a big turn in the calendar. The Millennial generation falls into the third category. The label refers those born after 1980 – the first generation to come of age in the new millennium. Generation X covers people born from 1965 through 1980. The label long ago overtook the first name affixed to this generation: the Baby Bust. Xers are often depicted as savvy, entrepreneurial loners. The Baby Boomer label is drawn from the great spike in fertility that began in 1946, right after the end of World War II, and ended almost as abruptly in 1964, around the time the birth control pill went on the market. It’s a classic example of a demography-driven name. The Silent generation describes adults born from 1928 through 1945. Children of the Great Depression and World War II, their “Silent” label refers to their conformist and civic instincts. It also makes for a nice contrast with the noisy ways of the anti-establishment Boomers. The Greatest Generation (those born before 1928) “saved the world” when it was young, in the memorable phrase of Ronald Reagan. It’s the generation that fought and won World War II. Generational names are works in progress. The zeitgeist changes, and labels that once seemed spot- on fall out of fashion. It’s not clear if the Millennial tag will endure, although a calendar change that comes along only once in a thousand years seems like a pretty secure anchor.
  11. Chapter 1: Overview 5 two decades of Pew Research Center

    surveys, supplemented by our analysis of Census Bureau data and other relevant studies. Some Caveats A few notes of caution are in order. Generational analysis has a long and distinguished place in social science, and we cast our lot with those scholars who believe it is not only possible, but often highly illuminating, to search for the unique and distinctive characteristics of any given age group of Americans. But we also know this is not an exact science. We acknowledge, for example, that there is an element of false precision in setting hard chronological boundaries between the generations. Can we say with certainty that a typical 30-year-old adult is a Gen Xer while a typical 29-year-old adult is a Millennial? Of course not. Nevertheless, we must draw lines in order to carry out the statistical analyses that form the core of our research methodology. And our boundaries—while admittedly too crisp—are not arbitrary. They are based on our own research findings and those of other scholars. We are mindful that there are as many differences in attitudes, values, behaviors and lifestyles within a generation as there are between generations. But we believe this reality does not diminish the value of generational analysis; it merely adds to its richness and complexity. Throughout this report, we will not only explore how Millennials differ from other generations, we will also look at how they differ among themselves. The Millennial Identity Most Millennials (61%) in our January, 2010 survey say their generation has a unique and distinctive identity. That doesn’t make them unusual, however. Roughly two-thirds of Silents, nearly six-in-ten Boomers and about half of Xers feel the same way about their generation. But Millennials have a distinctive reason for feeling distinctive. In response to an open-ended follow-up question, 24% say it’s because of their use of technology. Gen Xers also cite technology as their generation’s biggest source of distinctiveness, but far fewer—just 12%—say this. Boomers’ feelings of distinctiveness coalesce mainly around work ethic, which 17% cite as their most prominent identity badge. For Silents, it’s the shared experience of the Depression and World War II, which 14% cite as the biggest reason their generation stands apart. (Chapter 3). What Makes Your Generation Unique? Millennial Gen X Boomer Silent 1. Technology use (24%) Technology use (12%) Work ethic (17%) WW II, Depression (14%) 2. Music/Pop culture (11%) Work ethic (11%) Respectful (14%) Smarter (13%) 3. Liberal/tolerant (7%) Conservative/Trad’l (7%) Values/Morals (8%) Honest (12%) 4. Smarter (6%) Smarter (6%) “Baby Boomers” (6%) Work ethic (10%) 5. Clothes (5%) Respectful (5%) Smarter (5%) Values/Morals (10%) Note: Based on respondents who said their generation was unique/distinct. Items represent individual, open- ended responses. Top five responses are shown for each age group. Sample sizes for sub-groups are as follows: Millennials, n=527; Gen X, n=173; Boomers, n=283; Silent, n=205.
  12. Chapter 1: Overview 6 Millennials’ technological exceptionalism is chronicled throughout

    the survey. It’s not just their gadgets—it’s the way they’ve fused their social lives into them. For example, three-quarters of Millennials have created a profile on a social networking site, compared with half of Xers, 30% of Boomers and 6% of Silents. There are big generation gaps, as well, in using wireless technology, playing video games and posting self- created videos online. Millennials are also more likely than older adults to say technology makes life easier and brings family and friends closer together (though the generation gaps on these questions are relatively narrow). (Chapter 4). Work Ethic, Moral Values, Race Relations Of the four generations, Millennials are the only one that doesn’t cite “work ethic” as one of their principal claims to distinctiveness. A nationwide Pew Research Center survey taken in 2009 may help explain why. This one focused on differences between young and old rather than between specific age groups. Nonetheless, its findings are instructive. Nearly six-in-ten respondents cited work ethic as one of the big sources of differences between young and old. Asked who has the better work ethic, about three-fourths of respondents said that older people do. By similar margins, survey respondents also found older adults have the upper hand when it comes to moral values and their respect for others. It might be tempting to dismiss these findings as a typical older adult gripe about “kids today.” But when it comes to each of these traits—work ethic, moral values, respect for others—young adults agree that older adults have the better of it. In short, Millennials may be a self-confident generation, but they display little appetite for claims of moral superiority. That 2009 survey also found that the public—young and old alike—thinks the younger generation is more racially tolerant than their elders. More than two decades of Pew Research surveys confirm that Do You Sleep with Your Cell Phone? % who have ever placed their cell phone on or right next to their bed while sleeping 57 83 68 50 20 All Millennial Gen X Boomer Silent Weighing Trends in Marriage and Parenthood, by Generation % saying this is a bad thing for society Millennial Gen X Boomer Silent More single women deciding to have children 59 54 65 72 More gay couples raising children 32 36 48 55 More mothers of young children working outside the home 23 29 39 38 More people living together w/o getting married 22 31 44 58 More people of different races marrying each other 5 10 14 26 Note: “Good thing”, “Doesn’t make much difference”, and “Don’t know” responses not shown.
  13. Chapter 1: Overview 7 assessment. In their views about interracial

    dating, for example, Millennials are the most open to change of any generation, followed closely by Gen Xers, then Boomers, then Silents. Likewise, Millennials are more receptive to immigrants than are their elders. Nearly six-in-ten (58%) say immigrants strengthen the country, according to a 2009 Pew Research survey; just 43% of adults ages 30 and older agree. The same pattern holds on a range of attitudes about nontraditional family arrangements, from mothers of young children working outside the home, to adults living together without being married, to more people of different races marrying each other. Millennials are more accepting than older generations of these more modern family arrangements, followed closely by Gen Xers. To be sure, acceptance does not in all cases translate into outright approval. But it does mean Millennials disapprove less. (Chapter 6). A Gentler Generation Gap A 1969 Gallup survey, taken near the height of the social and political upheavals of that turbulent decade, found that 74% of the public believed there was a “generation gap” in American society. Surprisingly, when that same question was asked in a Pew Research Center survey last year—in an era marked by hard economic times but little if any overt age-based social tension—the share of the public saying there was a generation gap had risen slightly to 79%. But as the 2009 results also make clear, this modern generation gap is a much more benign affair than the one that cast a shadow over the 1960s. The public says this one is mostly about the different ways that old and young use technology—and relatively few people see that gap as a source of conflict. Indeed, only about a quarter of the respondents in the 2009 survey said they see big conflicts between young and old in America. Many more see conflicts between immigrants and the native born, between rich and poor, and between black and whites. There is one generation gap that has widened notably in recent years. It has to do with satisfaction over the state of the nation. In recent decades the young have always tended to be a bit more upbeat than their elders on this key measure, but the gap is wider now than it has been in at least twenty years. Some 41% of Millennials say they are satisfied with the way things are going in the country, compared with just 26% of those The Satisfaction Gap % saying they are satisfied with the way things are going in this country today 0 10 20 30 40 50 60 1990 1992 1994 1996 1998 2000 2002 2004 2006 2008 2010 18-29 30+ 41 26 Source: Pew Research Center surveys
  14. Chapter 1: Overview 8 ages 30 and older. Whatever toll

    a recession, a housing crisis, a financial meltdown and a pair of wars may have taken on the national psyche in the past few years, it appears to have hit the old harder than the young. (Chapter 3). But this speaks to a difference in outlook and attitude; it’s not a source of conflict or tension. As they make their way into adulthood, Millennials have already distinguished themselves as a generation that gets along well with others, especially their elders. For a nation whose population is rapidly going gray, that could prove to be a most welcome character trait.
  15. Chapter 2: Demography 9 Chapter 2: Demography The demographic makeup,

    living arrangements and life experiences of the Millennial generation differ markedly from those of the other three living U.S. generations, especially the Boomers and the Silent generation. Millennials, born after 1980, are more ethnically and racially diverse than older generations, more educated, less likely to be working and slower to settle down. If one were to assume that the Millennial generation, like the famously-large Baby Boomer generation, encompasses everyone born over an 18 year span, the two generations would be about equal in size (77 million). However, this is not because fertility rates in recent times have been especially high—they were about 70% higher during the baby boom from 1946 to 1964—but because population growth, including a big wave of immigration since then, has added more women of child-bearing age. The demographic analysis in this chapter looks only at characteristics of the oldest Millennials—born in 1981 to 1991, and ages 18 to 28 in 2009—as they begin to make their mark as adults. It compares them with Generation X (ages 29-44 in 2009), Baby Boomers (ages 45-63 in 2009) and the Silent generation (ages 64 and older in 2009), both today and when the older generations were the same ages the Millennials are now.5 An interactive display of the current and past demographics of these four generations is available on the Pew Research Center website (http://pewresearch.org/millennials). Race, Ethnicity and Nativity Only about six-in-ten Millennials (61%) are non-Hispanic whites. This is similar to the share among Generation X (62%), but less than that of Baby Boomers (73%) or the Silent generation (80%). The flip side of this measure is that racial and ethnic minorities make up 39% of Millennials and 38% of Gen Xers, compared with just 27% of Baby Boomers and 20% of the Silent generation. 5 The birth years and 2009 ages of the other generations are as follows: Generation X, born 1965-1980, ages 29-44; Baby Boomers, born 1946- 1964, ages 45-63; and Silent generation, born before 1946, ages 64 and older. For purposes of this analysis, “today” represents 2009. When using 2009 data, the full generations are compared. In comparing Millennials with other generations when they were the same age, only those ages 18 to 28 from earlier generations are included. This analysis relies on the March Current Population Surveys (1963, 1964, 1978, 1995 and 2009) for the civilian, non-institutional population from the Integrated Public Use Microdata Series(IPUMS). Race/Ethnicity in 2009 % by generation 61 62 73 80 19 18 10 7 13 12 11 8 4 6 4 4 2 2 2 1 Millennial Gen X Boomer Silent White Hispanic Black Asian Other Note: All groups (other than Hispanic) are non-Hispanic. Source: Pew Research Center tabulations from the March 2009 Current Population Survey for the civilian, non-institutional population
  16. Chapter 2: Demography 10 The rapid recent growth of the

    Hispanic population, compared with the black population, also has made its mark on this generation. In the Baby Boom generation, the black (11%) and Hispanic (10%) shares of the population are similar; among Millennials, there are more Hispanics (19%) than blacks (13%). Despite the recent influx of immigrants into the United States, Millennials are not markedly more likely to be foreign born than are older Americans. In fact, they are less likely to be foreign born than Gen Xers (14% vs. 21%), reflecting the fact that many new immigrants are in their 30s when they arrive. In 1995, when Generation X was about the same age as Millennials are now, its foreign-born share was similar (13%). What distinguishes Millennials, in terms of nativity, is that 11% are U.S.-born children of at least one immigrant parent. That share is higher than for Gen Xers (7%) or Boomers (5%). By this measure, Millennials most resemble the Silent generation (11%), many of whose parents came to the U.S. during the surge of immigration that began in the late 1800s. Education and Work Millennials are more highly educated when ranked with other generations at comparable ages. More than half of Millennials have at least some college education (54%), compared with 49% of Gen Xers, 36% of Boomers and 24% of the Silent generation when they were ages 18 to 28. Millennials, when compared with previous generations at the same age, also are more likely to have completed high school. An analysis of education trends by gender shows that Millennial women surpass Millennial men in the share graduating from or attending college. This reversal of traditional patterns first occurred among Generation X. In the Boomer and Silent generations, men exceeded women in college attendance and graduation rates. Social trends and economic forces help explain the differences in labor force patterns between the Millennials and earlier generations. Millennials are less likely to be employed (63%) than Gen Xers (70%) or Boomers (66%) had been at the same age. One reason is that overall economic conditions today are less favorable than they were when Gen Xers were ages 18 to 28 in 1995, or when Boomers were that age in 1978. Another is that Millennials are Male Educational Attainment When They Were 18-28 % by generation 15 18 21 32 35 36 41 40 34 33 25 19 15 13 13 9 Millennial Gen X Boomer Silent Less than high school High school Some college 4 years of college or more Source: Pew Research Center tabulations from the March Current Population Surveys (1964, 1978, 1995 and 2009) for the civilian, non-institutional population
  17. Chapter 2: Demography 11 more likely than earlier generations to

    be in college, and thus are somewhat more likely to be out of the labor force.6 However, compared with the Silent generation at the same age, Millennials overall are more likely to be in the labor force. That's mainly because in 1963, among Silents who were ages 18 to 28, a large share of the young women were stay-at-home wives. Looking at another dimension of life experience—military service—the share of veterans among Millennial men is notably lower (2%) than it is among older generations when they were ages 18 to 28. The share of veterans ranges from 6% for Gen Xers to 13% for Boomers to 24% for the Silent generation. Marriage and Children In their living arrangements, Millennials are markedly less likely to be married or to have children than earlier generations were at comparable ages. Three-quarters (75%) have never married, compared with only 43% of the Silent generation, 52% of Boomers and 67% of Gen Xers at the same ages. Just one-in-five Millennials is currently married (21%) and just one-in-eight (12%) is married with children at home, half the proportions (42% and 26%, respectively) of Boomers at the same age. Millennials are more likely to be single parents living with their children (8%) than Boomers (4%). And, whether married or single, Millennials are less likely than 6 "Out of the labor force" means being of working age (16 or older) but not working and not actively seeking work. Among 18-to-24 year old Millennials, 47% were enrolled in school or college in 2009. By contrast, 40% of 18-to-24 year old Gen Xers were enrolled in school or college in 1995. Female Educational Attainment When They Were 18-28 % by generation 12 16 19 31 28 32 47 49 40 37 23 15 20 15 11 6 Millennial Gen X Boomer Silent Less than high school High school Some college 4 years of college or more Source: Pew Research Center tabulations from the March Current Population Surveys (1964, 1978, 1995 and 2009) for the civilian, non-institutional population Marital Status When They Were 18-28 % by generation 21 29 42 54 4 5 6 3 75 67 52 43 Millennial Gen X Boomer Silent Married Separated or divorced Never married/Single Source: Pew Research Center tabulations from the March Current Population Surveys (1963, 1978, 1995 and 2009) for the civilian, non-institutional population
  18. Chapter 2: Demography 12 Boomers at the same age to

    both be parents and be living in the same household with their child or children (20% versus 30%). What has replaced the married-with-children household among Millennials? It is not the single-person household, which is no more prevalent among Millennials than it was among Gen Xers or Boomers at the same age (no data are available for the Silent generation). Millennials are more likely to be living with other family members (47%), such as their parents, than were the immediate two previous generations at the same age (Gen Xers, 43%; Boomers, 39%). They also are more likely than others had been at the same stage of life to be cohabiting with a partner or living with a roommate. Community Type The types of communities where Millennials live, compared with earlier generations, flow from the nation’s changing geography, which has become less rural and more suburban-metropolitan in recent decades. Millennials are markedly less likely to live in rural areas than older Americans were at comparable ages. Only 14% of Millennials live in rural areas, compared with more than a quarter of Boomers (29%) and a third of the Silent Generation (36%) at the same ages. The rise of the suburbs also can be seen when the share of Millennials now living in them (54%) is compared with the share of Boomers who lived in a suburb in 1978 (41%) and the share of Silents who lived in a suburb in 1963 (31%). Millennials also are more likely to live today in central cities than are older generations—32% of them do, compared with 23% of the Silent generation.
  19. Chapter 3: Identity, Priorities, and Outlook 13 Chapter 3: Identity,

    Priorities and Outlook Looking at themselves in relation to others, most Millennials say that theirs is a unique generation. Six-in-ten (61%) say they think of their own age group as unique and distinct from other generations; 37% do not. Millennials are not alone—other generations also see themselves as unique in varying degrees. About half of Gen Xers (49%) see their generation as unique as do 58% of Boomers and 66% of Silents When asked to name some ways in which their generation is unique and distinct, responses differ widely across age groups. Among Millennials who see their generation as unique, technology use is the single most popular response. Roughly a quarter of those under age 30 (24%) say technology is what sets their generation apart. Other ways in which Millennials see themselves as unique include their music, pop culture and style (11%), and their liberalism and tolerance (7%). Gen Xers also point to technology as a defining characteristic of their generation—but just 12% name this as a way in which they differ from other generations. In addition, 11% of Gen Xers say their work ethic sets them apart. Is Your Generation Unique? % saying that their age group is unique and distinct 57 61 49 58 66 All Millennial (18-29) Gen X (30-45) Boomer (46-64) Silent (65+) What Makes Your Generation Unique? Millennials Gen X Boomers Silent 1. Technology use (24%) Technology use (12%) Work ethic (17%) WW II, Depression (14%) 2. Music/Pop culture (11%) Work ethic (11%) Respectful (14%) Smarter (13%) 3. Liberal/Tolerant (7%) Conservative/Trad’l (7%) Values/Morals (8%) Honest (12%) 4. Smarter (6%) Smarter (6%) “Baby Boomers” (6%) Values/Morals (10%) 5. Clothes (5%) Respectful (5%) Smarter (5%) Work ethic (10%) Note: Based on respondents who said their generation was unique/distinct. Items represent individual, open-ended responses. Top five responses are shown for each age group. Sample sizes for sub-groups are as follows: Millennials, n=527; Gen X, n=173; Boomers, n=283; Silent, n=205.
  20. Chapter 3: Identity, Priorities, and Outlook 14 For Boomers, it’s

    their work ethic (17%) and respect for others that make their generation unique. The Silents point to historical experiences such as World War II and the Depression as defining their generation (14%). They also see themselves as smarter and more well-educated (13%), and more honest and trustworthy (12%) than other generations. The responses to this open-ended question coalesce around certain general themes, and there are significant differences across generations. When asked what sets their age group apart from others, all four generations point to differences in values and attitudes. Boomers and members of the Silent generation are more likely than those in younger generations to point to these differences. Millennials emphasize technology use as the defining characteristic of their generation much more than do their older counterparts. In addition, Millennials and Gen Xers are more likely than older generations to see factors having to do with behavior and lifestyle as setting their generations apart. Boomers and Silents are more likely than the younger generations to point to historical experiences. Classifying the Differences among Generations % of responses falling into each general category 47 27 17 2 47 15 15 4 63 6 8 14 66 5 9 18 Different values/ attitudes Different use of technology Different behaviors/ lifestyles Different historical experiences Millennial Gen X Boomer Silent Note: Asked of respondents who said their age group is unique or distinct (N=1,205). Categories represent combined open-ended responses that fall into each NET category.
  21. Chapter 3: Identity, Priorities, and Outlook 15 Millennials and the

    Generation Gap These patterns echo the findings of other Pew Research Center surveys showing that the generation gap is still very much a part of the American psyche. A survey conducted in February 2009 found that Americans are just as likely now as they were during the turbulent 1960s to say there is a generation gap between young and old. In the 2009 survey, 79% said there is a major difference in the point of view of younger people and older people today; 74% said the same in 1969.7 A subsequent study, conducted in the summer of 2009, found that technology and values are what most differentiate the generations. Nearly three- quarters of all adults said young and older people are very different in the way they use computers and new technologies. And majorities said young and old are very different in their work ethic (58%), their moral values (54%), and the respect they show others (53%).8 Not only do most Americans agree that young and old are different when it comes to values and morals, but most people feel that older people are superior in this regard. Regardless of age, about two-thirds or more of the public believes that, compared with the younger generation, older Americans have better moral values, have a better work ethic and are more respectful of others. The one area in which young people come out ahead is racial tolerance. By a ratio of more than two-to-one, young people are viewed as being more tolerant of races and groups different from their own than the older generation (47% vs. 19%). For the most part, the generations are in agreement on this point: 55% of those under age 30 say their generation is more tolerant, and 37% of those ages 50 and older concur. The public may see the generations as different in fundamental ways, but most do not see them as being in conflict. Only 26% say there are strong conflicts between young people and older people today. More than two- thirds (68%) say that conflicts are either not very strong or are nonexistent. 7 See Pew Research Center Social & Demographics Trends Project, “Growing Old in America: Expectations vs. Reality,” June 29, 2009 (http://pewsocialtrends.org/pubs/736/getting-old-in-america). 8 See Pew Research Center Social & Demographics Trends Project, “Forty Years after Woodstock, A Gentler Generation Gap,” August 12, 2009 (http://pewsocialtrends.org/pubs/739/woodstock-gentler-generation-gap-music-by-age). The Values Gap between Young and Old Who has better values … ? 70 74 71 19 4 3 3 47 16 16 19 21 10 7 7 13 Moral values Work ethic Respect for others Attitudes toward other races and groups Older people Young people No difference Neither/DK Source: Pew Research Center Social & Demographic Trends survey report, “Forty Years After Woodstock, A Gentler Generation Gap,” August 12, 2009.
  22. Chapter 3: Identity, Priorities, and Outlook 16 Millennials and Their

    Elders Not only do young people see their elders as having better morals and a stronger work ethic, most feel it’s the responsibility of adult children to care for their elderly parents. In a 2005 Pew Research Center survey, nearly two-thirds (63%) of Millennials (ages 18-25 at the time) said it is an adult child’s responsibility to allow an elderly parent to live in their home if that’s what the parent wants to do. A third said this is not a responsibility. Gen Xers (ages 26-41) shared this point of view, with 67% saying taking in an elderly parent is an adult child’s responsibility and 30% saying it is not. Boomers were more evenly divided on this issue. Among those ages 42-60, 55% said it’s a responsibility for adult children to allow their elderly parents to live with them. Members of the Silent generation were less likely to say adult children are responsible for taking in their elderly parents (38% said this is a responsibility while 52% said it is not). It is not clear whether these variances are the product of respondents’ stage of the life cycle or of true generational differences. However, the 2005 poll also included a list of other things family members sometimes do for each other, and found far fewer differences between age groups. These other behaviors included parents paying for a child’s college education, parents allowing an adult child to live with Respecting their Elders Adult children allowing an elderly parent to live in their home is…? (%) 63 67 55 38 33 30 41 52 Millennial (18-25) Gen X (26-41) Boomer (42-60) Silent (61+) A responsibility Not a responsibility Source: Pew Research Center Social & Demographic Trends survey report, “From the Age of Aquarius to the Age of Responsibility: Baby Boomers Approach Age 60,” December 8, 2005. Ages for generations have been adjusted in accordance with the survey date. Sample sizes for subgroups are as follows: Millennial, n=296; Gen X, n=741; Boomer, n=1120; Silent, n=806. How Often Parents and Their Young Adult Children Disagree 10 33 43 13 19 29 37 14 Often Sometimes Hardly ever Never % of parents who have major disagreements w/their children ages 16-24 % of adults (ages 30+) who, when they were younger, had major disagreements w/their parents Source: Pew Research Center Social & Demographic Trends survey report, “Forty Years after Woodstock, A Gentler Generation Gap,” August 12, 2009. Based on parents with children ages 16-24 (n=265) and adults ages 30+ (n=1304).
  23. Chapter 3: Identity, Priorities, and Outlook 17 them, parents saving

    money for their children’s inheritance, and grandparents helping with childcare for their grandchildren. On each of these items, Millennials, Gen Xers, Boomers and Silents were mainly in agreement. On a more personal level, there seems to be less conflict between parents and their young adult children these days than in the past. According to the 2009 Pew Research survey, today’s parents say they are having fewer serious arguments with their children in their late teens and early 20s than they recall having with their own parents when they were that age. Only one-in-ten parents with children ages 16-24 say they “often” have major disagreements with their kids. Among adults ages 30 and older, twice as many (19%) say they often had major arguments with their folks when they were young.9 What Millennials Want Out of Life To a large extent, the things that Millennials value in life mirror the things older generations value. Family matters most, and fame and fortune are much less important. When asked to rate how important a series of life goals are to them personally, being a good parent ranked at the top for all four generations. Overall, 50% of the public says this is one of the most important things in their lives. An additional 44% say this is very important but not the most important thing for them personally. Only 5% say this is only somewhat important or not important at all. Although only about a third of Millennials (34%) have children, they are just as likely as their older counterparts to place high value on good parenting. About half (52%) say being a good parent is one of the most important things to them. This compares with 50% of those ages 30 and older. Millennial women are even more likely than Millennial men to say being a good parent is one of the most important things to them (56% vs. 48%). No similar gender gap exists among older generations. 9 See Pew Research Center Social & Demographics Trends Project, “Forty Years after Woodstock, A Gentler Generation Gap,” August 12, 2009 (http://pewsocialtrends.org/pubs/739/woodstock-gentler-generation-gap-music-by-age).
  24. Chapter 3: Identity, Priorities, and Outlook 18 Three-in-ten Millennials say

    having a successful marriage is one of their most important life goals. Here they differ somewhat from the rest of the public; of those ages 30 and older, 35% place the highest level of importance on having a successful marriage. Among Millennials, whites are more likely than nonwhites to place a high priority on marriage. A third of non-Hispanic whites rank a successful marriage as one of the most important things in their life, compared with 25% of nonwhites. Roughly a quarter of Millennials (23%) say they are currently married, compared with 59% of Gen Xers and 64% of Boomers. In general, young people are less likely to be married now than was the case 20 years ago. Beyond marriage and family, 21% of Millennials say that helping people who are in need is one of the most important things in their life. Older generations agree—20% of those ages 30 and older say helping others is one of their most important goals. Equally important is owning a home. Among Millennials, 20% say owning their own home is one of the most important things to them. Similarly, 21% of those ages 30 and older place the highest importance on owning a home. Religion is a lower priority for Millennials. Some 15% say living a very religious life is one of their most important goals, and an additional 28% say it is very important but not one of the most important things. About a quarter (26%) say this is not important to them. Older generations are more likely to place a high importance on this—21% of those 30 and older say that living a very religious life is one of the most important things in their life. Millennials place more importance on being successful in a high-paying career than they do on living a religious life. Some 15% say being successful in their career is one of the most important things in their life. An additional Life’s Priorities % saying each is one of the most important things in their lives 52 30 21 20 15 15 9 1 50 35 20 21 21 7 10 1 Being a good parent Having a successful marriage Helping others in need Owning a home Living a very religious life Being successful in a high- paying career Having lots of free time Becoming famous 18-29 30+
  25. Chapter 3: Identity, Priorities, and Outlook 19 47% say this

    is very important, though not one of the most important things. Among the older generations, only 7% rate a high-paying job as one of the most important things in their life. Having lots of free time to relax and do things they want to do is not a high priority for Americans of any age. Only 9% of adults under age 30 say this is one of the most important things in their life. Among those ages 30 and older, 10% place the highest priority on free time. In spite of the fact that they have come of age in the era of YouTube and reality TV, very few Millennials consider becoming famous an important life goal. A mere 1% say this is one of the most important things in their life, and 3% consider it very important but not one of the most important things. The vast majority (86%) say fame is not important to them. Older generations feel much the same: Just 1% say achieving fame is one of the most important things to them, while 87% say it is not important to them at all. Several of these life goals were included in a 1997 survey conducted by the Washington Post, The Henry J. Kaiser Family Foundation and Harvard University. The findings from that study provide some insight into the goals of Gen Xers, who are now ages 30-45, when they were younger.10 For the most part, the priorities of Millennials are similar to those held by Gen Xers at a similar stage of life. Gen Xers placed more value on family relationships than on career goals or religious life. However, Gen Xers viewed parenting as less important and marriage as slightly more important when compared with how Millennials feel today. In the 1997 survey, 42% of adults ages 18-29 said being a good parent was one of the most important things in their life. Among today’s Millennials, 52% say being a good parent is one of the most important things to them. In 1997, adults under age 30 were more likely than their older counterparts to place a great deal of importance on having a successful marriage. Today, just the opposite is true. 10 The 18-29 year-old age group from 1997 provides a close approximation of Gen X at that time. Millennials vs. Gen X When They Were Young % saying each is one of the most important things in their life 42 52 35 30 1997 18-29 year-olds (Gen X) 2010 18-29 year-olds (Millennial) Being a good parent Having a successful marriage Source: Data from 1997 are from the Washington Post/Henry J. Kaiser Family Foundation/Harvard University Gender Survey, conducted August 14-27, 1997.
  26. Chapter 3: Identity, Priorities, and Outlook 20 Millennials’ Economic Outlook:

    Vulnerable yet Optimistic Millennials have not escaped the current economic downturn. But even though they’re not happy with their current economic circumstances, they remain highly optimistic about their financial future. Young people who are employed are mostly dissatisfied with the amount of money they make—just 31% say they earn enough money to lead the kind of life they want. As would be expected, young workers are less satisfied with their current income than are older workers. Among employed Gen Xers, 46% are satisfied with the amount of money they make. That number is slightly higher among Boomers (52%). However, young workers are more optimistic than older workers about their future earning power. Among Millennials who say they don’t earn enough money, 88% think they will be able to earn enough in the future. This compares with 76% of Gen Xers and 46% of Boomers. These measures have changed very little since 2006, when 32% of those under age 30 who were employed either full time or part time said they made enough money to live the kind of life they wanted. Among those who didn’t earn enough, 92% said they thought they would in the future. Today’s employed young people are actually somewhat more optimistic about their economic future than Gen Xers were when they were young. In 1997, among employed young people who said they did not make enough to earn the kind of life they wanted, 77% thought they would make enough in the future. Roughly a third of Millennials are not currently employed. Among this group, things have gotten significantly worse since 2006. Only 19% of Millennials who are not employed, say they have enough income to lead the kind of life they want. This is down from 38% in 2006. While their circumstances may have worsened, their optimism has not waned. Dissatisfaction and Youthful Optimism Based on those who are employed 31 88 46 76 52 46 Earn enough now Will earn enough in the future Millennial Gen X Boomer Note: Sample sizes for subgroups are as follows: Millennials, n=554; Gen X, n=266; Boomers, n=346. Silents not shown due to small sample size. The Recession’s Impact on Millennials Who are Not Employed 38 87 19 89 Have enough income to lead the kind of life you want Don't have enough income now but will in the future 2006 2010 Note: Based on adults ages 18-29 who are not employed. Sample sizes are as follows: 2006 n=170; 2010 n=276.
  27. Chapter 3: Identity, Priorities, and Outlook 21 Among Millennials who

    say they currently don’t have enough income, 89% believe they will have enough in the future. This is basically unchanged from 2006. A similar pattern is evident among unemployed people ages 30 and older: Fewer are now satisfied with the amount of income they have (47% now vs. 57% in 2006), but optimism about the future has changed very little (43% say they will have enough income in the future, as opposed to 41% in 2006). Assessing the State of the Nation Amid the recession and other pressing national and international problems, Millennials are more upbeat than older age groups about the state of the nation. When asked whether they are satisfied or dissatisfied with the way things are going in the country today, 41% of Millennials say they are satisfied and 55% are dissatisfied. Gen Xers are slightly less satisfied than Millennials, though the difference is not statistically significant (36% satisfied). Satisfaction with the state of the nation is lower among Boomers (23%) and lowest among members of the Silent generation. Only 14% of those ages 65 and older say they are satisfied with the way things are going in the country today; more than three-quarters (78%) are dissatisfied. Different Views on the State of the Nation Are you satisfied or dissatisfied with the way things are going in this country today? 29 41 36 23 14 65 55 57 71 78 All Millennial Gen X Boomer Silent % satisfied % dissatisfied
  28. Chapter 3: Identity, Priorities, and Outlook 22 Over the 20

    years the Pew Research Center has been tracking attitudes toward the state of the country, young people have consistently expressed higher satisfaction than their older counterparts. However, the gap in overall satisfaction is wider now than it has been at any time since 1990. This is due at least in part to the widespread dissatisfaction among those ages 65 and older. In addition, Millennials are more united in their views of the country than are older Americans. Among Millennials, there is no significant difference between whites and nonwhites in terms of their assessment of conditions in the country—39% of whites and 43% of nonwhites say they are satisfied with the way things are going in the country. Among those 30 and older, whites are much less satisfied than nonwhites with conditions in the country (24% vs. 31%). Views of the country may be less politicized among Millennials than among older age groups. Millennials who identify with or lean to the Democratic Party are more likely to be satisfied with the state of the nation than are Millennials who identify with or lean to the Republican Party (43% vs. 35%). However, among those ages 30 and older, the partisan gap is much wider: 36% of Democrats or independents who lean Democratic are satisfied with the way things are going in the country today, compared with only 16% of Republicans or independents who lean toward the Republican Party. The views of young and old are more closely aligned on community satisfaction. In general, Americans are much more satisfied with the way things are going in their own communities these days than they are with the way things are going in the country. Overall, 69% of adults say they are satisfied with conditions in their local communities. This includes 69% of Millennials, 73% of Gen Xers, 67% of Boomers and 66% of those in the Silent generation. Young People Consistently More Upbeat % satisfied with the way things are going in this country today 0 10 20 30 40 50 60 1990 1992 1994 1996 1998 2000 2002 2004 2006 2008 2010 18-29 30+ 41 26 Source: Data from 1990 through 2009 are from surveys conducted by the Pew Research Center for the People & the Press. Satisfaction with Local Communities % satisfied with the way things are going in their local community today 69 69 73 67 66 All Millennial Gen X Boomer Silent
  29. Chapter 3: Identity, Priorities, and Outlook 23 Happiness and Trust

    Young people are relatively happy with their lives overall, and in this regard they are not much different from older age groups. Among Millennials, 31% say they are very happy these days and an additional 56% are somewhat happy. Only 12% say they are not too happy. Nearly equal proportions of Gen Xers (27%), Boomers (29%) and Silents (27%) are very happy. Members of the Silent generation are somewhat more likely than Millennials to say they are not too happy with their lives (20%). A good deal of research has been done on the underlying factors of happiness. Recent analyses done by the Pew Research Center have found that income, marital status and church attendance are all linked to overall happiness.11 The current survey supports those earlier findings showing that among Millennials, those with higher incomes, those who are married and those who attend church weekly are among the happiest. When it comes to trusting other people, the public is skeptical at best. When asked whether most people can be trusted or if you can’t be too careful in dealing with people, nearly two-thirds of adults (64%) say you can’t be too careful in dealing with people. Only 31% say most people can be trusted. Currently the views of young people do not differ significantly from those of older age groups on this question: 28% of those ages 18-29 say most people can be trusted, compared with 32% of those ages 30 and older who say the same. In recent years, there has been a larger gap in trust across age groups. Younger people have consistently been less trusting. Academic researchers have been tracking this gap in social trust over the past several decades. Some have suggested that the changing values of young people in the 1970s and 1980s have contributed to the erosion of social trust among this age group.12 Interestingly, according to the current survey, the gap has diminished significantly since 2006 as the level of trust among those ages 30 and older has fallen sharply. In 2006, 44% of those ages 30 and older said that most people could be 11 See Pew Research Center Social & Demographics Trends Project, “Growing Old in America: Expectations vs. Reality,” June 29, 2009 (http://pewsocialtrends.org/pubs/736/getting-old-in-america) and Paul Taylor, Pew Research Center, “Republicans: Still Happy Campers,” October 23, 2008(http://pewsocialtrends.org/pubs/718/republicans-happier). 12 See Wendy M. Rahn and John E. Transue, “Social Trust and Value Change: The Decline of Social Capital in American Youth, 1976-1995,” Political Psychology, vol. 19, no. 3, 1998, pp. 545-565. Measuring Social Trust % who say most people can be trusted 0 10 20 30 40 50 60 1997 1998 2001 2003 2006 2010 18-29 30+ 48 35 32 28 Source: Data from 1997 through 2006 are from surveys conducted by the Pew Research Center for the People & the Press.
  30. Chapter 3: Identity, Priorities, and Outlook 24 trusted; now only

    32% express that opinion. There has been little change in the level of interpersonal trust expressed by those under age 30 over that period of time. Trust is strongly correlated with socioeconomic factors such as income and education. This is true among Millennials as well as older age groups. Adults who have attended or graduated from college are more trusting than those with less education. Race and ethnicity are also linked to interpersonal trust. Among Millennials, 33% of non-Hispanic whites say most people can be trusted. That compares with 15% of non-Hispanic blacks and 24% of Hispanics. Similarly, among those ages 30 and older, 39% of non-Hispanic whites say most people can be trusted, compared with 6% of blacks and 18% of Hispanics.
  31. Chapter 4: Technology and Social Media 25 Chapter 4: Technology

    and Social Media Technological change and generational change often go hand in hand. That’s certainly the story of the Millennials and their embrace of all things digital. The internet and mobile phones have been broadly adopted in America in the past 15 years, and Millennials have been leading technology enthusiasts. For them, these innovations provide more than a bottomless source of information and entertainment, and more than a new ecosystem for their social lives. They also are a badge of generational identity. Many Millennials say their use of modern technology is what distinguishes them from other generations (For details, see Chapter 3). Millennials13 outpace older Americans in virtually all types of internet and cell use. They are more likely to have their own social networking profiles, to connect to the internet wirelessly when away from home or work, and to post video of themselves online. Similarly, while a majority in all age groups have a cell phone, significantly more Millennials than members of any other generation use their phone for texting. Among survey respondents who report that they texted in the past 24 hours, the typical Millennial sent or received 20 texts in that period, compared with a dozen for a Gen Xer and five for a Baby Boomer. The young are also much more likely than older people to text while driving. Nearly two-thirds of Millennials say they’ve done so, compared with almost half of Xers, one-in-five Boomers and virtually no Silents. Within the Millennial generation are demographic differences in various kinds of online and wireless behaviors. For example, Millennials who have attended college are more likely than those who have no college experience to be online, use social networking sites, watch and post video online, connect to the internet wirelessly, and send and receive text messages. Younger Millennials are more likely than older Millennials use the internet and social networking sites, and to have sent or received a larger number of text messages in the past 24 hours. And on some of these behaviors, there are also gender and racial-ethnic differences among Millennials. 13 This survey and report deals with Millennial adults ages 18 to 29. There is a body of work about teens and their technology use at the Pew Research Center’s Internet & American Life Project that parallels many of these findings. It can be accessed at http://pewinternet.org/topics/Teens.aspx. Reports can be browsed by clicking on “By content type” and choosing “Report.” Millennials Outpace Older Americans in Technology Use Millennial Gen X Boomer Silent (18-29) (30-45) (46-64) (65+) Internet behaviors % % % % Created social networking profile 75 50 30 6 Wireless internet away from home 62 48 35 11 Posted video of themselves online 20 6 2 1 Use Twitter 14 10 6 1 Cell phones and texting Use cell to text 88 77 51 9 Texted in past 24 hours 80 63 35 4 Texted while driving 64 46 21 1 Have a cell phone/no landline 41 24 13 5 Median # texts in past 24 hours 20 12 5 -- Note: Median number of texts based on those who texted in past 24 hours.
  32. Chapter 4: Technology and Social Media 26 Views of Technology

    What do Americans think about the digital revolution? Do they believe it has made life easier or more complicated? Brought people together or made them more isolated? Led people to waste time or to use it more efficiently? In each case, a majority of the public takes the positive view of modern technology. But a substantial minority also takes the negative view on each evaluation. Millennials tilt the most positively, not surprising in light of their heavy use. But in general the age group differences on these attitudinal questions are relatively modest. Like the rest of the public, Millennials see both the good and the bad in their array of digital gadgets, services, platforms and applications. Overall, more than twice as many Americans think that new technology makes life easier (64%) rather than more complicated (26%). This view is shared across age groups, but more Millennials (74%) and Gen Xers (69%) say that new technology makes life easier than Boomers (60%) and those in the Silent generation (50%). A modest majority (52%) says that new technology allows people to use their time more efficiently rather than makes people waste too much time (35%). A majority of Millennials (56%), Gen Xers (52%) and Boomers (54%) think technology helps people use their time more efficiently, but those in the Silent generation are more divided in their views (41% say it helps people use their time more efficiently, and an equal share say it encourages people to waste too much time). Half of the public says that new technology makes people closer to their friends and family, but 39% say that new technology makes people more isolated. A majority of Millennials (54%) and Gen Attitudes about Technology: Many Positive, Some Negative 26 18 21 30 36 64 74 69 60 50 All Millennial Gen X Boomer Silent New technology makes life more complicated New technology makes life easier 39 35 36 42 44 50 54 52 48 44 All Millennial Gen X Boomer Silent New technology makes people more isolated New technology makes people closer to their friends and family 35 33 34 35 41 52 56 52 54 41 All Millennial Gen X Boomer Silent New technology makes people waste too much time New technology allows people to use their time more efficiently Note: “Don’t know/Refused” responses not shown.
  33. Chapter 4: Technology and Social Media 27 Xers (52%) think

    that new technology makes people closer to each other rather than more isolated. But Boomers and members of the Silent generation are more divided in their opinion. Among Boomers, 48% say technology makes people closer but nearly as many (42%) say that it makes people more isolated. Similarly, equal proportions of the Silent generation say that technology makes people closer (44%) as say it makes people more isolated (44%). Many Americans Online About three-fourths (77%) of Americans use email or the internet, at least occasionally. This is up from 14% in 199514 and 68% in 2005. The proportion of the public that is online has remained fairly consistent since 2006.15 There continue to be substantial age differences in internet use. In this survey, 90% of Millennials and 87% of Gen Xers use the internet, compared with 79% of Baby Boomers. Only 40% of the Silent generation uses the internet even occasionally. The proportion in each generation who use the internet has changed only modestly since 2005. Even among Millennials there are significant differences in internet use. More than nine-in-ten whites (95%) and blacks (91%) are online. By comparison, only 73% of Hispanic Millennials say they use the internet or email at least occasionally. A report by the Pew Hispanic Center and the Pew Research Center’s Internet & American Life Project found that the gap between young Latinos and whites had narrowed from 2006 to 2008.16 But both the 2008 data and the current 2010 survey indicate that among the young, Hispanics still lag behind whites, and to a lesser extent blacks, in their use of the internet. Educational attainment still matters as a factor in internet adoption, even among Millennials. Nearly all (96%) young people who are currently in college or have 14 See Pew Research Center for the People & the Press, “Americans Going Online … Explosive Growth, Uncertain Destinations: Technology in the American Household,” Oct. 16, 1995 (http://people-press.org/report/136/americans-going-online--explosive-growth-uncertain- destinations). 15 Trend data from the Pew Research Center’s Internet & American Life Project can be downloaded as an Excel spreadsheet by clicking on the link labeled “Usage Over Time” on this page. (http://www.pewinternet.org/Static-Pages/Trend-Data.aspx). 16 See Pew Hispanic Center, “Latinos Online, 2006-2008: Narrowing the Gap,” Dec. 22, 2009 (http://pewhispanic.org/reports/report.php?ReportID=119 ). Internet Use: 2005-2010 % of public who use the internet or send and receive email at least occasionally 2005 2010 Change All 68 77 +9 Millennial 83 90 +7 Gen X 84 87 +3 Boomer 73 79 +6 Silent 36 40 +4 Note: 2005 Data are from Pew Research Center’s Internet & American Life Project survey conducted May 4–June 7, 2005. Internet Use Among Millennials % of Millennials who use the internet or send or receive email at least occasionally 90 92 88 95 91 73 96 83 All Millennials 18-24 25-29 Whites Blacks Hispanics College No college Note: Based on adults ages 18 to 29.
  34. Chapter 4: Technology and Social Media 28 attended college use

    the internet at least occasionally, compared with 83% of those who have not attended college. There are no significant age differences in internet use between younger and older Millennials. More Millennials Use Social Networking Sites Use of social networking sites has grown rapidly over the past five years. In 2005, only 5% of the public used social networking sites. That share grew to 11% in 2006 and 27% in 2008. In the current survey, 41% say they have created their own profile on a social networking site, such as Facebook, MySpace or LinkedIn. Millennials far outpace older Americans in the use of social networking sites. Three-fourths (75%) of Millennials have created a social networking profile compared with 50% of Gen Xers. Only 30% of Boomers and 6% of members of the Silent generation have created their own profile on a social networking site. Use of social networking sites has grown since 2005 for all adults under 65, particularly among Millennials. Only 7% of young people used social networking sites in 2005, but that jumped to 51% in 2006. The share of Millennials using social networking sites has been fairly stable since 2008, with 75% now saying they have created their own social networking profile. Growth in online social networking among Millennials is followed closely by increases among Gen Xers. Currently, 50% of Gen Xers use social networking sites, up from 38% in 2008 and 10% in 2006. Use of social networking sites also has grown among Baby Boomers. In 2005 and 2006, only about 5% of Boomers used these sites, but by 2008 13% did so; that has grown to 30% in the current survey. Social networking use among the Silent generation, however, remains quite Millennials Make Frequent Visits to Social Networking Sites % of social networking users who visit the site they use most often … 21 29 19 11 23 26 19 26 23 20 24 25 34 25 39 38 All Social Networking Users Millennial Gen X Boomer Several times a day Once a day Every few days Once a week or less Note: Based on adults who have their own social networking profile. Silent Generation not shown because of small sample size. “Don’t know/Refused” responses not shown. Social Networking Users % of adults who use social networking sites Feb/Mar Aug Nov/Dec Jan 05-10 2005* 2006* 2008* 2010** Change All 5 11 27 41 +36 Millennial 7 51 71 75 +68 Gen X 7 10 38 50 +43 Boomer 5 4 13 30 +25 Silent 2 * 2 6 +4 *Data from surveys conducted by the Pew Research Center’s Internet & American Life Project. Question wording varied from 2005 to 2008. The 2005 item was worded “Use online social or professional networking sites like Friendster or LinkedIn.” The 2006 item was worded “Use an online social networking site like MySpace, Facebook or Friendster.” The 2008 item was worded “Use a social networking site like MySpace, Facebook or LinkedIn.com.” **Question wording: Have you ever created your own profile on any social networking site?
  35. Chapter 4: Technology and Social Media 29 low—just 6% say

    they have created their own profile. Among those who use social networking sites, Millennials stand out from other age groups in the frequency with which they use these sites. They are more likely than older social networking users to visit these sites several times a day. About three-in-ten Millennials (29%) who have their own social networking profile make several visits a day to the site they use most often. By comparison, 19% of Gen Xers and 11% of Boomers visit a social networking site multiple times a day. More than half (55%) of social networking Millennials visit these sites at least once a day, and an additional 20% do so every few days. Only a quarter visit social networking sites weekly (10%) or less often (15%). Differences among Millennials in Social Networking Use Within the Millennial generation, there is variance in usage of social networking sites. Younger Millennials are more likely than their older counterparts to use social networking sites and to visit them more often. About eight-in-ten (81%) 18- to 24-year-olds have created their own social networking profile, compared with 66% of those ages 25 to 29. Similarly, 58% of young Millennial social networking users visit the site they use most often at least daily, compared with 48% of older Millennials. Social networking is especially popular with young women. While roughly similar proportions of young men and women have created their own social networking profile, more women (33%) than men (24%) social networking users visit a social networking site several times a day. There also are differences by race and ethnicity. White Millennials are the most likely to have created a social networking profile (83%). By comparison, 71% of blacks and 52% of Hispanics have done that. But among those who have created their own profile, blacks are more likely to use these sites multiple times a day (45% vs. 25% of whites). Millennials who have attended college are significantly more likely than those with less educational attainment to have their own social networking profile; 86% of those with at least some college experience have created their own social networking profile, compared with 59% of those with no college experience. Similarly, 60% of social networking users who have attended college visit these sites at least once day; of those who have not attended college, fewer visit the sites daily (44%). Social Networking Use among Millennials Visit** Created Several About once profile* times/day a day % % % All Millennials 75 29 26 18-24 81 31 27 25-29 66 25 23 Men 72 24 28 Women 77 33 23 Whites 83 25 29 Blacks 71 45 11 Hispanics 52 -- -- College 86 30 30 No college 59 28 16 *Based on all adults ages 18 to 29. **Based on adults ages 18 to 29 who created their own social networking profile. Those who visit less often than daily or don’t know not shown. Insufficient number of Hispanics for analysis.
  36. Chapter 4: Technology and Social Media 30 Twitter Some 8%

    of all adults use Twitter. According to research by the Pew Research Center’s Internet & American Life Project, use of Twitter and online status updating increased from 2008 to 2009 but has leveled off since fall 2009.17 Roughly comparable proportions of Millennials (14%) and Gen Xers (10%) use Twitter. By comparison, only 6% of Boomers and 1% of Silents use Twitter. There are no significant differences by age, gender, or race and ethnicity in Twitter usage among Millennials. But college- educated Millennials are more likely to tweet; 17% of young people who have attended college use Twitter, compared with 9% of Millennials who have not attended college. More Millennials Posting Videos Online Only 7% of the public has ever posted a video of themselves online, but Millennials are much more likely than older Americans to have done so. One-in-five Millennials (20%) have posted video of themselves online, compared with only 6% of Gen Xers, 2% of Boomers and 1% of those in the Silent generation. There are significant differences among Millennials by age, gender and education. About a quarter (24%) of younger Millennials have posted a video of themselves on the internet, compared with 14% of older Millennials. In addition, more men (24%) than women (16%) have posted video of themselves online. Millennials with at least some college education are also more likely to have uploaded video of themselves; 23% of those with college experience have posted their videos online, compared with 16% of Millennials who have never attended college. 17 See Pew Research Center’s Internet & American Life Project, “Social Media and Young Adults,” Feb. 3, 2010 (http://www.pewinternet.org/Reports/2010/Social-Media-and-Young-Adults.aspx). Do You Ever Use Twitter? % saying yes 8 14 10 6 1 All Millennial Gen X Boomer Silent More Young Men Than Women Have Posted a Video of Themselves Online % of Millennials who have ever posted a video of themselves online 20 24 14 24 16 23 16 All Millennials 18-24 25-29 Men Women College No college Note: Based on adults ages 18 to 29.
  37. Chapter 4: Technology and Social Media 31 Connecting to the

    Internet Wirelessly About four-in-ten Americans (41%) connect to the internet wirelessly using a laptop or hand-held device when away from home or work. This is up from 36% in April 2009.18 Far more Millennials than those in older generations use wireless connections to surf the internet. About six-in-ten Millennials (62%) connect to the internet wirelessly when away from home or work, as do 48% of Gen Xers. Only 35% of Boomers and 11% of the Silent generation use wireless internet connections away from home or work. There are no significant differences among Millennials by age or gender. But as with other online activities, fewer young Hispanics use wireless internet connections away from home or work. About half (47%) of Hispanic Millennials connect to the internet wirelessly using a laptop or hand-held device, compared with 64% of whites and 66% of blacks. Far more Millennials who have attended college than those without college experience connect to the internet wirelessly: 74% who have been to college use wireless connections away from home or work, compared with 47% of those who have not attended college. The question did not specifically mention use of wireless connections at school. However, these findings likely reflect to some degree the general situation on many campuses, where wireless connectivity is ubiquitous. 18 See Pew Research Center for the People & the Press, “Independents Take Center Stage in Obama Era,” May 21, 2009 (http://people-press.org/report/517/political-values-and-core-attitudes). More Millennials Connect to Internet Wirelessly % who connect to the internet wirelessly using a laptop or hand- held when away from home or work 41 62 48 35 11 All Millennial Gen X Boomer Silent Differences Among Millennials in Wireless Connectivity % of Millennials who connect to the internet wirelessly when away from home or work 62 64 66 47 74 47 All Millennials Whites Blacks Hispanics College No college Note: Based on adults ages 18 to 29.
  38. Chapter 4: Technology and Social Media 32 Age Differences in

    Cell Phone Use More than eight-in-ten (86%) adults now have a cell phone, including majorities across all age groups. Millennials are somewhat more likely than all other age groups to have a cell phone: 94% have one, as do 90% of Gen Xers and 89% of Boomers. Although significantly fewer in the Silent generation have a cell phone, even 62% among this group now have a cell phone. According to the Pew Research Center’s recent projections, based on data from the National Health Interview Survey (NHIS),19 21% of all adults depend exclusively on a cell phone for calls and do not have landline phones in their homes. The proportion of adults who have only a cell phone has steadily increased since 2003; the share of adults who have both a landline and cell phone has also grown during this time. Millennials continue to be far more likely than other age groups to rely only on a cell phone for their communication needs. In the survey, 41% of Millennials were reached on a cell phone and say they have no landline at home. By comparison, 24% of Gen Xers, 13% of Boomers and 5% of those in the Silent generation have become cell phone-only. Millennials are more likely than older Americans to treat their cell phones as a necessary and important appendage. Many even bring their cell phones to bed. A majority (57%) of the public has placed their cell phone on or right next to their bed while sleeping. Millennials are more likely than their elders to do so: 83% have placed their cell phone on or right next to their bed while sleeping. A large majority (68%) of Gen Xers also have slept with or near their cell phone, as have 50% of Boomers. Of the Silent generation, the least likely to have a cell phone, just 20% have kept their cell phones nearby while sleeping. 19 Stephen J. Blumberg and Julian V. Luke, “Wireless Substitution: Early Release of Estimates from the National Health Interview Survey, January-June 2009,” National Center for Health Statistics, December 2009. Available from: (http://www.cdc.gov/nchs/nhis.htm). More Millennials Are Cell-Only Have a Are cell phone cell-only* % % All 86 21 Millennial 94 41 Gen X 90 24 Boomer 89 13 Silent 62 5 *Have a cell phone but do not have a landline phone at home. Who Has Slept with Cell Nearby? % who have placed their cell phone on or right next to their bed while sleeping 57 83 68 50 20 All Millennial Gen X Boomer Silent
  39. Chapter 4: Technology and Social Media 33 Texting Behavior A

    majority of Americans (59%) say they use their cell phone to send or receive text messages, while 26% have not used their cell phones to text and 14% do not use cell phones at all. Nearly half of the public (48%) reports sending or receiving text messages in the 24 hours preceding the survey. Among those who texted in the previous 24 hours, the median number of messages sent and received is 10. Millennials are more likely than older adults to use their cell phones to send and receive text messages: 88% use their cell phones to text, as do 77% of Gen Xers and 51% of Boomers. Only 9% of those in the Silent generation use their cell phones to text. A similar pattern is evident when it comes to texting in the previous 24 hours, but the gap between Millennials and those in other age groups is even larger. Four-in-five (80%) Millennials texted in the previous 24 hours, compared with 63% of Gen Xers, 35% of Boomers and 4% of Silents. Among those who texted in the 24 hours preceding the survey, the median number of texts sent and received by Millennials is 20, compared with 12 for Gen Xers and five for Boomers. And within the Millennial generation, there are a notable number of power-texters. A quarter (25%) say they sent more than 50 messages in the previous 24 hours. Among Millennials who have texted in the last 24 hours, there are age and racial differences in the number of texts sent and received. Among younger Millennials (those 18 to 24), the median number sent or received is 40, compared with 12 for Millennials ages 25 to 29. Similarly, among blacks who have texted in the previous day, the median number of texts sent or received is 50 compared with 20 among whites. Millennials Are the Most Avid Texters Ever Text Median # text* in past day* in past day** % % # All 59 48 10 Millennial 88 80 20 Gen X 77 63 12 Boomer 51 35 5 Silent 9 4 -- Note: *Based on all adults. **Based on adults who texted in past 24 hours. Silent generation not shown because of small sample size.
  40. Chapter 4: Technology and Social Media 34 Cell Phone Use

    and Driving An array of recent research has focused on the issue of distracted driving and the problems it causes on the roads. The new survey finds that a majority of Americans (66%) say they have talked on a cell phone while driving and 34% say they have sent or received a text message while driving. Millennials are no more likely than Gen Xers or Boomers to have talked on a cell phone while driving; about three-fourths of those in each age group have done so. But texting while driving is a different story. More Millennials than those in older age groups use their cell phones to text, so it is not surprising that more also text while driving. Nearly two-thirds (64%) of Millennials say they have sent or received a text message while driving, compared with 46% of Gen Xers and 21% of Boomers. Members of the Silent generation are the least likely to have talked on a cell phone or texted while driving; 27% of Silents have talked on a cell phone while driving, and only 1% have sent or received a text message while behind the wheel. Younger and older Millennials are equally as likely to say they have talked or texted while driving, but there are other significant demographic differences among Millennials. More men than women have talked on a cell phone while driving (80% vs. 71%), but there are no gender differences in texting while driving. Whites are more likely than blacks or Hispanics to have talked on a cell phone or texted while driving. More Millennials who have attended college have used their cell phones while driving than those who have not attended college (84% vs. 64%). Similarly, 74% of young adults who have attended college have sent or received a text message while driving, compared with 52% of those without college experience. Majority of Millennials Have Talked or Texted While Driving 75 74 78 80 71 86 61 84 64 58 64 65 63 66 63 72 58 49 74 52 All Millennials 18-24 25-29 Men Women Whites Blacks Hispanics College No college Talked on cell phone while driving Sent or received a text message while driving Note: Based on adults ages 18 to 29. While Driving, Have You… Talked on a Sent or received cell phone a text message % % All 66 34 Millennial 75 64 Gen X 75 46 Boomer 72 21 Silent 27 1
  41. Chapter 4: Technology and Social Media 35 Internet Rivals TV

    for Main News Source Among Millennials and Gen Xers The proportion of Americans who turn to the internet for most of their national and international news grew substantially from 2007 to 2009, and young people have been a large part of that increase. Among Millennials and Gen Xers, nearly as many now cite the internet as their main source for national and international news as cite television. Among Millennials, 65% say television and 59% cite the internet as their main source for news. Far fewer get most of their national and international news from newspapers (24%) and radio (18%). There is a similar pattern among Gen Xers: 61% get most of their news from television and 53% from the internet, while only 24% get most of their news from newspapers and 22% by listening to the radio. By comparison, television is the primary news source among Baby Boomers (76%) and the Silent generation (82%). Among Boomers, about as many get most of their news from newspapers (34%) as from the internet (30%). But among Silents, far more get most of their national and international news from newspapers (50%) than from the internet (13%). Millennials are about as likely as those in older age groups to get their television news from cable or local TV news. Millennials and Gen Xers are less likely than Boomers and Silents to get most of their national and international news from the major networks (ABC, CBS and NBC). When asked what sites they go to most often for news and information, one-fifth (20%) of Millennials mention Yahoo, 18% cite CNN, 10% Google and 7% MSN. Less than 5% get news online from the New York Times, MSNBC, AOL or other outlets. Among Gen Xers, 16% get online news from CNN, 12% from Yahoo, 8% from MSN, 5% use Google and another 5% use Fox. Those in older age groups who get most of their news online are less likely to cite Yahoo or CNN as their main news sources. How Do You Get Most of Your News? Millennial Gen X Boomer Silent Main news source* % % % % Television 65 61 76 82 Internet 59 53 30 13 Newspapers 24 24 34 50 Radio 18 22 20 15 Other 4 5 3 5 Television source* Any cable source 43 34 40 47 CNN 24 19 21 22 Fox news channel 19 15 19 26 MSNBC 7 6 6 6 Any network source 18 19 30 30 ABC 9 8 14 14 CBS 8 6 11 11 NBC 7 9 16 13 Local TV 16 16 20 14 Number of respondents 355 658 1149 690 Internet source** % % % % Yahoo 20 12 6 3 CNN 18 16 5 3 Google 10 5 3 1 MSN 7 8 5 1 Fox 4 5 4 1 New York Times 4 3 2 2 MSNBC 3 3 2 2 AOL 3 1 2 1 Number of respondents 189 346 571 322 *Main news source and television news source based on combined data from surveys conducted by the Pew Research Center for the People & the Press in July and December 2009. Respondents could name multiple news sources. **Online news source based only on the December survey. Respondents could name up to three sources. Most frequently mentioned web sites shown.
  42. Chapter 4: Technology and Social Media 36 What Did You

    Do in the Past 24 Hours? To get a broad measure of some lifestyle differences among the age groups, several questions were asked about activities people might have pursued “in the past 24 hours.” Their answers show how Millennials stand out from their elders in the activities they pursue and how they allocate their time. A majority of Americans watched more than an hour of television (71%), read a daily newspaper (55%), and sent or received email in the 24 hours preceding the survey interview (51%). Far fewer watched video online (18%), posted a message to someone’s personal online profile (17%) or played video games (16%). But the proportion who posted a message to someone’s personal online profile is up from 9% in September 2006 to 17% now. There are large differences in the share engaging in these activities by age. Millennials are more likely than all other age groups to have watched video online and to have posted a message to someone’s online profile in the previous 24 hours. About a third of Millennials (32%) watched video online over that period, compared with 23% of Gen Xers, and less than 10% of Boomers and Silents. A nearly identical pattern is evident on posting to an online profile. In addition, about twice as many Millennials (28%) as Gen Xers (14%) and Boomers (15%) played video games in the previous 24 hours; only 6% of those in the Silent generation did that. There are no significant differences among Millennials, Gen Xers and Boomers in the share that sent or received an email in the previous 24 hours, but fewer than half as many Silents emailed over that period. Millennials are the least likely to have watched an hour of television in the previous 24 hours. Even so, a majority (57%) of Millennials did that. Two-thirds (67%) of Gen Xers watched more than an hour of TV, as did 78% of Boomers and 82% of those in the Silent generation. Fewer Millennials read a daily newspaper than did those in any other age group; 43% of young people did that, compared with 50% of Gen Xers, 58% of Boomers and 73% of those in the Silent generation. Among Millennials, the only significant difference by age is on posting to an online profile; more younger Millennials than older ones did that in the previous 24 hours (37% vs. 26%). There also are some differences by gender. More young men than women played video games (37% vs. 18%) and watched a video online (39% vs. 26%) in the 24 hours prior to the survey. But more women posted a message to someone’s online profile (37% vs. 28%). There are very few differences by race and ethnicity; however, more white Millennials (61%) sent or received an email in the previous 24 hours than did blacks (47%) or Hispanics (45%). What Did You Do in the Past 24 Hours? % saying they have … Millennial Gen X Boomer Silent Millennials more likely to have… % % % % Watched a video online 32 23 9 7 Posted a message to an online profile 32 22 9 3 Played video games 28 14 15 6 Millennials as likely to have… Sent or received an email 56 57 54 26 Older Americans more likely to have… Watched more than an hour of TV 57 67 78 82 Read a daily newspaper 43 50 58 73 Number of respondents 830 351 487 319
  43. Chapter 4: Technology and Social Media 37 There are several

    differences among Millennials by education. Nearly twice as many Millennials who have attended college emailed in the previous 24 hours than did those who did not attend college (71% vs. 36%). Also, more watched a video online (40% vs. 22%). Similarly, more Millennials with college experience posted a message to an online profile in the previous 24 hours than did those with no college experience (37% vs. 25%), and more read a daily newspaper (47% vs. 37%).
  44. 38

  45. Chapter 5: Work and Education 39 Chapter 5: Work and

    Education The recession has hurt all Americans but has been particularly hard on the Millennial generation, according to the latest Pew Research Center survey. As jobs vanished and businesses closed, America’s newest entrants into the labor force have often found themselves among the last hired and the first to lose their jobs. A Pew Research Center survey in 2006 found that half of all 18- to 29-year-olds were employed in full-time jobs. Then came the Great Recession. In our 2010 survey, as a battered economy struggles to rebound, about four-in-ten (41%) people in the same age group say they are working full time—a decline of 9 percentage points. In contrast, about the same proportion of older adults reported working full time in both the 2006 and 2010 surveys. Millennials are also more likely than older Americans to report they recently lost a job (10% vs. 6% for adults ages 30 or older). Even those Millennials who are working say times are tough. Among members of this generation who are employed full time or part time, less than a third (31%) say they earn enough money to lead the kind of lives they want. That judgment contrasts sharply with the majority of workers ages 46-64 who say they are satisfied with their current income (52%). Then again, young people never think they have enough spending money. In a Pew Research Center survey conducted in 1997 during an economic boom, only three-in-ten adults ages 18 to 29 said they made enough to live their ideal life. In the arc of most people’s lives, income and earning power tend to be relatively low in one’s youth and to rise through middle age. For many Millennials, mom and dad help ease the sting of a skimpy paycheck or a financial setback. More than a third of all Millennials (36%) say they depend on financial support from their families, including 14% of all young adults who are working full time. In contrast, only 6% of Gen Xers under 40, a group with higher incomes and more job security, say they rely on financial help from loved ones. Many of these measures of financial well-being are driven by life-cycle effects. In the 18-29 age range, many young adults typically move through different stages—finishing their education, finding a first job, beginning a career, starting a family and buying a house—and their economic circumstances change rapidly during this Full-time Employment Drops among Young Adults % of 18- to 29-year-olds in each year who were… 41 24 13 22 50 21 10 18 Working full time Working part time Student, not working Not employed 2010 2006 -9 +3 +3 +4 Change Note: The “Not employed” and “Student, not working” categories include those who are unemployed and those who are not actively seeking work.
  46. Chapter 5: Work and Education 40 passage into full adulthood.

    Then again, losing a job, being underemployed or trying to land that first full-time job when no one is hiring is rarely a good thing, regardless of age or life circumstances. And because of where they are in life, young people have been affected by the recession in ways that members of other generations have not. A Pew Research Center survey conducted in October 2009 found that 13% of those ages 22 to 2920 have moved back in with their parents after living on their own “because of the recession,” more than double the proportion of adults ages 30-45 who have returned home. And fully 15% of younger adults say they have moved in with a roommate to cut costs, triple the proportion of those ages 30-45 who say they were forced by the recession to share living quarters with someone else.21 In key ways, adults ages 18 to 29 have always been more vulnerable to economic swings than older Americans. The Millennial generation is no exception. Relatively few young people have accumulated enough assets or personal wealth to carry them through bad times. They are the least likely of any generation to own their own home (22% vs. 71% for adults ages 30 and older) and, like most Americans, a majority worry that they aren’t saving as much as they should. While these young adults are, as a group, healthier than older Americans, Millennials are also the least likely of any generation to say they are covered by health insurance (61% vs. 82% for those 30 and older). However, even though the recession has been hard on young people, it has not dimmed their optimism. About two-thirds of Millennials (68%) say they are not earning enough money to live the kind of life they want. However, within that group the vast majority (88%) say they expect to earn enough in the future to live the good life. That is significantly higher than the percentage of Gen Xers (76%) or Baby Boomers (46%) who share this hopeful view. Millennials have a reason to be optimistic: Time is on their side. When the jobs return, the survey results suggest these young people will be prepared. Millennials appear to be on track to becoming the most educated generation in America’s history. Millennials have not yet matched the educational attainment of Gen Xers. So far, 19% are college graduates compared with 35% of Gen Xers. About four-in-ten Millennials are still in school. Separately, 30% of those not in school say they plan to go back to earn a college degree, according to the Pew Research Center survey. What’s holding them back? Money and time. Of all Millennials who have not earned a college degree and are not in school, more than a third (36%) say that they can’t afford to go to school right now, and an additional 35% say they simply do not have the time. 20 The more restrictive age range was used because a disproportionately large share of Millennials ages 18 to 21 are not living on their own but instead are still living with parents or are in school. 21 For a more detailed look at the impact of the recession on young adults, see Wendy Wang and Rich Morin, “Home for the Holidays … and Every Other Day,” Pew Research Center Report, Nov. 24, 2009 (http://pewsocialtrends.org/assets/pdf/home-for-the-holidays.pdf). Millennials and College % of Millennials who… 6% 19% 31% 44% Have no plans to graduate from college Already graduated from college Don't know Plan to graduate from college
  47. Chapter 5: Work and Education 41 But Millennials are accustomed

    to meeting challenges. Many find the time for both work and school. Almost a quarter attend school and work full time (10%) or part time (14%). In comparison, only about 8% of Gen Xers work and attend school, in part because a larger proportion already have finished their formal education and are well along in their chosen career. The remainder of this chapter will examine in more detail the education and employment characteristics of Millennials. The first sections analyze the educational attainment of this generation and compare it to that of older adults. The later sections examine the working lives of Millennials, including their attitudes toward their job and career as well as their concerns about personal finances. Education Millennials have not yet matched the educational achievements of their Gen X older brothers and sisters—but give them time. About four-in- ten (39%) are still in college, high school or trade school. According to the Pew Research Center survey, Millennials may be on track to emerge as the most educated generation ever. So far only about one-in-five Millennials (19%) are college graduates.22 An additional 26% are currently in school and plan to graduate from college, while an additional 30% are not in school but expect to someday earn a college degree. These numbers suggest that when Millennials have finished their formal education, a majority could be college graduates. Half of Gen Xers are college graduates or plan to get their degree sometime in the future. Educational Aspirations of Millennials When it comes to education, this generation aims high. Millennials currently enrolled in high school, college or graduate school are particularly ambitious—about half want to go on to earn a graduate or professional school degree. A somewhat smaller share (34%) plan to end their formal education after they graduate from college. For the remainder, a high school diploma, degree from a community college, or a certificate from a trade or vocational school will mark the end of their formal schooling. Being out of school has not ended the educational aspirations of most young people. About two-thirds (65%) of all young adults ages 18-29 who are currently not in school say they plan to go back someday. The educational goals of this group are not quite as high as others in their generation who are currently in school: Roughly a third plan to go to graduate or professional school (32%). Still, that’s a nine percentage point increase in the proportion of 18- to 29-year-olds with similar aspirations in 2006. 22 Consists of 14% who are college graduates and 5% who are college graduates who are attending graduate or professional school. Educational Profile of Millennials Still in school 39% % currently attending: College/undergraduate 26 Grad or professional school 5 HS or trade school* 8 Not in school 61% % who completed: HS grad or less 34 Some college/ trade school* 14 College grad/ undergrad degree 11 Grad or professional school 3 *Includes trade, vocational and technical school. Percentages may not add to 100% because of rounding.
  48. Chapter 5: Work and Education 42 An additional 30% intend

    to go back to school and get a four-year college degree, while an almost equal proportion (28%) want to get their high school diploma, go to trade or vocational school, or get a degree from a community college. Will Millennials fulfill their dreams of academic achievement? Only time will tell. But for now, according to a recent Pew Research Center report, the share of 18- to 24-year-olds attending U.S. colleges recently hit an all-time high,23 with nearly all of the recent growth occurring in community college enrollments. And U.S. Census Bureau surveys find that a majority of Millennials (54%) already have attended some college or have graduated, compared with just slightly fewer Gen Xers (49%) at a similar age. Who Has a College Degree—and Who Wants One According to the Pew Research survey, Millennial women are slightly more likely than men to be college graduates (21% vs. 16%). Younger whites are about twice as likely as blacks or Hispanics to have finished college (22% vs. 10% for both blacks and Latinos). But blacks are significantly more likely than whites or Hispanics to say they want to earn a college diploma. Predictably, Millennials ages 18 to 24 are significantly less likely than older Millennials to be college graduates (9% vs. 31%). But they are significantly more likely to say they plan to get their degrees (57% vs. 27%), in large part because a large number of younger Millennials are currently attending college and advancing toward a degree. When these results are analyzed together, younger and older Millennials look roughly similar: 66% of younger Millennials already have a college degree or plan to get one, compared with 58% of older Millennials. 23 For a more detailed look at changes in college enrollment and employment among young adults, see Richard Fry, “College Enrollment Hits All-Time High, Fueled by Community College Surge,” Pew Research Center Report, Oct. 29, 2009 (http://pewsocialtrends.org/pubs/747/college-enrollment-hits-all-time-high-fueled-by-community-college-surge). The Millennials: College Diplomas, College Dreams % of each group… 19 16 21 22 10 10 9 31 44 40 48 42 55 39 57 27 31 36 26 29 29 44 29 35 All Millennials Men Women Whites Blacks Hispanics 18-24 25-29 Already a college graduate Plan to graduate from college Do not plan to graduate from college Note: Figures based on Millennials who have completed their education, those who are still in school and those who are out of school but plan to return.
  49. Chapter 5: Work and Education 43 Reasons for Not Continuing

    in School Despite their plans and good intentions, about half (48%) of all Millennials are not college graduates and are not currently in school. So what, if anything, is holding them back? Too little money and too little time. According to the survey, more than a third (36%) of this group say they cannot afford school, a judgment that may reflect the soaring cost of higher education as much as it does the impact of the recession. An additional 35% say they don’t have the time. Only 14% say they are not attending school because they don’t need more education. Men and women are about equally likely to say money or time is the reason that they are not in school. The sample of minorities without college degrees and who are not currently enrolled in school is too small to draw firm conclusions. Studying and Working Many Millennials work; many others go to school. And many Millennials do both. Overall, about one-in- four 18- to 29-year-olds (24%) are employed and enrolled in school. About one-in-ten Millennials study and work full time, while an additional 14% study and hold part-time jobs. About four-in-ten of all Millennials are employed full time or part time and are not going to school. This group includes 30% of younger Millennials and more than half of those ages 25 to 29 Biggest Reason for Not Completing College % of Millennials who are not college graduates or currently enrolled 36 35 14 14 Can't afford school Don't have the time Don't need more education Other/DK Note: Percentages may not add to 100% because of rounding. Studying and Working % of Millennials who… 31 10 10 14 13 19 9 11 20 20 10 9 5 48 4 Work full time, do not go to school Work full time, go to school Work part time, do not go to school Work part time, go to school Do not work, go to school All Millennials 18-24 25-29 Note: Those who are going to school may be either full or part time students. Those not working and not in school not shown.
  50. Chapter 5: Work and Education 44 (57%), many of whom

    have finished their formal schooling and are well on their way to launching careers and families. Almost identical proportions of younger and older Millennials—about one-in-ten of each group—are employed full time and going to school. Younger Millennials are four times as likely as those ages 25 and older to say they are working part-time jobs while they hit the books (20% vs. 5%). As a group, younger Millennials who are enrolled in school are about twice as likely to work part time as they are to hold a full-time job (20% vs. 9%). That pattern is reversed among Millennials ages 25 to 29; about 10% work full time while going to school, and 5% are employed part time. Younger Millennials also are significantly more likely than their older generational counterparts to be non-working students (20% vs. 4%). Employment and Millennials Nearly two-thirds of all Millennials have full- or part-time jobs.24 As a group, they are less likely to be working than their Gen X brothers and sisters (65% vs. 75%) and about as likely to be employed as Baby Boomers (68%). But the comparison is deceptive. Fully 13% of all Millennials are students who do not work for pay, compared with only 1% of Gen Xers and even fewer Baby Boomers. When the share of students in the Millennial generation is factored into the equation, the profiles of the generations look remarkably the same: About three-quarters of both generations are employed or attending school (80% for Millennials vs. 78% for Gen Xers). While a somewhat smaller share of Baby Boomers is working (68%), the difference is largely due to the fact that 13% of Baby Boomers have already retired. 24 While this estimate of 65% is based on the latest Pew Research Center survey, it is virtually identical to official government estimates of employment. According to Census Bureau figures collected last year, about 63% of Millennials are defined as “civilian employed” while 37% are either unemployed or not in the labor force. Generations at Work % of each generation who are… 41 65 54 35 25 13 24 10 32 Millennial Gen X Boomer Employed full time Employed part time Not employed Note: The category “Not employed” includes those who are not actively seeking work.
  51. Chapter 5: Work and Education 45 The Demographics of Employment

    Among Millennials and in the population as a whole, men and college graduates are more likely to be employed, more likely to work full time and less likely to be unemployed than women or those who are not college grads. According to the survey, nearly half of all Millennial men (46%) are employed full time, compared with 35% of young women. This 11 percentage point gap about equals the 13-point employment gender gap that exists among all men and women (53% of men are employed full time, compared with 40% of women). Predictably, Millennials ages 18 to 24 are significantly less likely than those 25 to 29 to hold full-time jobs (28% vs. 58%). At the same time, these younger Millennials are far more likely to work part time (31% vs. 14%) or be non-working students (20% vs. 4%). Full-time Employment Declines among Millennials Millennials are significantly less likely to be working full time (41%) than Gen Xers (65%) or Boomers (54%), reflecting in part the very different life circumstances of Millennials. At the same time, these youngest members of the labor force are about twice as likely to work part time (24%) as are members of the Gen X (10%) or Baby Boom (13%) generations. Full-time employment among 18-to-29-year-olds has dropped significantly in the past four years while remaining largely unchanged for older working-age adults. According to Pew Research Center surveys, the share of 18-to-29-year-olds employed full time declined 9 percentage points from 2006 to 2010. In comparison, full-time employees make up about the same proportion of 30-to-45-year-olds (63% in 2006 and 65% in the latest survey) and 46-to-64-year-olds (53% in 2006 and 54% today). Work Status of Millennials % of each group who are… 41 46 35 44 34 38 28 58 24 23 25 23 25 23 30 15 14 13 15 13 16 10 20 5 10 11 9 9 13 13 11 9 12 7 17 12 17 11 14 11 All Millennials Men Women Whites Blacks Hispanics 18-24 25-29 Employed full-time Employed part-time Students, not working Unemployed-lost/quit job Other/Don't know Note: The category “Not employed” includes those who are not actively seeking work.
  52. Chapter 5: Work and Education 46 The recession has changed

    the work experience of many Millennials. For some, hard times have meant a part-time job instead of full-time employment. For others, the recession has led to delayed entry into the labor market, either by enrolling in school or lingering longer in college. For still others, it has meant a lengthier wait for a job. The proportion of Millennials employed full time has fallen from 50% in 2006 to 41% today. At the same time, the proportion of this generation who work part time or are full-time students has increased by 3 percentage points to 24% and 13%, respectively, and the share of those ages 18 to 29 who are not employed increased by 4 percentage points to 24%. While these smaller shifts are not statistically significant, they are roughly similar to the declines that have been documented by government employment statistics collected over the past four years. Census statistics also tell another story. About six-in-ten Millennials (63%) are currently employed. That is a significantly smaller share than the proportion of Gen Xers (70%) or Baby Boomers (66%) who were working when those generations were the same age. Career and Job-Switching among Millennials Predictably, America’s newest workers are far more likely than older workers to say they are likely to switch careers or to change employers sometime in their work lives. According to the Pew Research Center survey, about two-thirds of all employed Millennials say it is “very likely” (39%) or “somewhat likely” (27%) they will switch careers sometime in their working life, compared with 55% of Gen Xers and 31% of Baby Boomers. Remarkably, nearly six-in-ten employed Millennials say they already have switched careers at least once, suggesting that many Millennials are trying out different careers or that some respondents equated a job change with a career switch. Full-time Employment by Generation, 2006-2010 % of each generation employed full time… 41 65 54 50 63 53 Millennial Gen X Boomer 2010 2006 -9 +2 +1 Change Attitudes toward Job, Career % of each generation who say it is likely they will… 66 42 55 62 31 84 Switch careers sometime in their work life Stay at current job rest of working life Millennial Gen X Boomer Note: Based on those who are employed full time or part time.
  53. Chapter 5: Work and Education 47 Millennials also are job-hoppers,

    not surprising because most of them will be working at least three more decades. Members of this generation are far more likely than members of others to say they will one day be working for someone other than their current employers. Nearly six-in-ten younger workers (57%) say it is not very likely or not likely at all that they will stay with their current employers for the remainder of their working life. Among Gen X workers, those numbers are virtually reversed: A 62% majority say it’s likely they will never leave their current employer, while only 36% expect to someday be working for someone else. Baby Boomers, many of whom are at or approaching retirement age, are even more settled: 84% expect to remain with their current employer for the rest of their working life. But not all Millennials expect to someday move on. One-third of Millennials say their current job is their career. Among these fortunate few who have found their life’s work, nearly two-thirds (63%) say it is likely that they will remain with their current employer the rest of their working lives. But co-workers can expect to say goodbye and wish good luck to the majority of Millennials who see their current position as either a steppingstone to a career or just a job to help them get by. Among those who see their current position as a springboard to another job, six-in-ten (61%) expect to be working for someone else while 37% say they likely will never leave their current employer. And among those who see their current job as merely a job, three-quarters (75%) expect to be working for somebody else sometime in their working life. Older Millennials: Young, Employed—and Happy Previous surveys conducted by the Pew Research Center have consistently found that people who are employed are generally happier than people without a job.25 And the latest survey finds that older Millennials with full-time jobs may just be the happiest workers in America. Fully a third of all Millennials with full- time jobs (35%) say they are “very happy” with their lives; 27% of Gen Xers who work full time and 29% of Baby Boomers who work full time say this. That proportion rises to 42% among Millennials ages 25-29 who work full 25 For a detailed analysis of the predictors of happiness, see “Are We Happy Yet?” Pew Research Center Report, Feb. 13, 2006. (http://pewresearch.org/pubs/301/are-we-happy-yet). Happiness is a Full time Job for Older Millennials % of full time workers in each group who are “very happy” with their lives… 23 64 13 42 51 7 58 14 27 12 58 29 Very happy Pretty happy Not too happy Millennial 18-24 Millennial 25-29 Gen X Boomer Note: Based only on those who are employed full time.
  54. Chapter 5: Work and Education 48 time though just 23%

    of younger Millennials ages 18 to 24 who work full time say they are “very happy” with their lives. Personal Finances As the effects of the Great Recession linger, most Americans are keeping a sharper eye on their personal finances and young people are no exception. A majority of 18- to 29-year-olds (55%) say they are watching their spending “very closely” these days, up from 43% of 18- to 29-year-olds who shared that view in 2006. That increase almost matches the 11-point rise in the overall proportion of adults who are keeping a closer eye on their finances these days (46% in 2006 vs. 57% now). Adults under age 30 continue to worry that they aren’t saving or investing enough (72% in 2006, 77% today). That is about equal to the percentage of those ages 30 to 45 (78%) who say they are concerned about growing their nest eggs. One reason Millennials are particularly vulnerable to hard times is that they are by far the least likely of any generation to be covered by health insurance; about six-in-ten (61%) of all Millennials say they are covered by some form of health plan, compared with 73% of Gen Xers, 83% of Baby Boomers and 95% of the Silent generation (most of the oldest group are eligible for Medicare or receive health benefits as part of their retirement plans). Among Millennials, as in the population as a whole, Hispanics are more likely to be one serious injury or illness away from financial disaster. Only about four-in-ten Latinos ages 18 to 29 have health insurance (42%), compared with 64% of blacks and 67% of whites. But in these hard times, Millennials have a resource they can tap in times of financial stress that is either unavailable or untapped by other generations: their families. Help from Family More than a third of all Millennials (36%) depend on their parents or other family members for financial assistance. Predictably, Millennials ages 18 to 24—a group that includes a disproportionately large share of full-time students—are far more likely to get help from families than are older Millennials (50% vs. 16%). Nearly four-in-ten whites (38%), 33% of blacks and 28% of Hispanics say they rely on money from family members to get by. Who Gets Help from the Family? % of each group who say they depend on family for financial assistance 36 37 34 38 33 28 50 16 63 62 64 61 65 70 48 83 All Millennials Men Women Whites Blacks Hispanics 18-24 25-29 Depend on family Do not depend on family Note: “Don’t Know/Refused” responses are not shown.
  55. Chapter 5: Work and Education 49 Not surprisingly, Millennials who

    are attending school and are not employed are the most likely to be receiving financial support (77%). Still, about one-in-seven Millennials with a full-time job—and about half who work part time—say they depend on family members to help them get by. About a third of Millennials who don’t have a job and are not in school get significant help from their parents or other family members.
  56. 50

  57. Chapter 6: Family Values 51 Chapter 6: Family Values Millennials

    are more tolerant than adults in other generations of a wide range of nontraditional behaviors related to marriage and parenting. Whether the trend is more single women having children, more people living together without being married, more mothers of young children working outside the home, more people of different races marrying one another or more gay couples raising children, Millennials are more receptive than their elders to these newer patterns of behavior. They are also the only generation to favor the legalization of gay marriage —they do so by a 50% to 36% margin, with the remainder undecided. When it comes to the other generations, support for gay marriage declines in a fairly straight progression from young to old: 43% of Gen Xers, 32% of Baby Boomers and 24% of Silents favor legalizing gay marriage. The pattern is similar on most of the other nontraditional family behaviors tested in this portion of the survey: Younger adults are generally the most accepting; older adults the least, and middle-aged adults fall in between. On the issues of single women having children and gay couples adopting, Millennials are more in line with Gen Xers, and the generation gap is between the two younger generations and the two older ones. It needs to be noted, however, that the Millennials’ receptivity to these new trends is high only in relative terms. Their tolerance does not translate into outright approval. In fact, no more than 34% of Millennials describe any of these trends as “good for society.” On four of the five trends tested, a majority or plurality decline to pass judgment; they say the trend is neither good nor bad for society. And when it comes to one of the trends —more single women having children—they voice strong disapproval. Nearly six-in-ten (59%) Millennials say it is bad for society, compared with just 6% who say it is good and a third (34%) who say it is neither bad nor good. Millennials Assess Trends in Marriage and Parenting % saying the trend is a … 59 32 23 22 5 34 46 40 63 60 19 33 14 34 6 Bad thing No difference Good thing More single women having children More gay couples raising children More mothers of young children working outside the home More people living together without getting married More people of different races marrying each other Note: “Don’t Know/Refused” responses are not shown.
  58. Chapter 6: Family Values 52 Millennials also tilt negative—albeit by

    less lopsided numbers—on gay couples raising children (32% say this is bad for society; 19% say it is good; the rest say it makes no difference) and on people living together without getting married (22% bad; 14% good). They tilt positive on mothers of young children working outside the home (33% good; 23% bad) and on people of different races marrying each other (34% good; 5% bad). On all but one of these trends, the judgments of those ages 30 and older are significantly more negative. For example, some 42% of adults ages 30 and older say it is bad for society that more people are living together without getting married. Just 22% of Millennials agree. The generation gap is nearly as large on attitudes about mothers of young children working outside the home. Just 23% of Millennials—compared with 35% of adults ages 30 and older—say this trend is bad for society. On this question, attitudes of both the old and the young are fairly evenly divided. Among Millennials, 23% say the trend is bad, 33% say it is good and 40% say it is neither. Among adults ages 30 and over, 35% say it is bad, 26% say it is good and 33% say it is neither. There is also a generation gap in views about interracial marriage. Among Millennials, about a third (34%) say the trend is a good thing, just 5% say it is a bad thing and six-in-ten say it is neither. The share describing this trend as a bad thing rises to 10% among Xers, 14% among Boomers and 26% among Silents. The Silents are the only generation more inclined to call this trend bad (26%) than good (15%). But as with all other generations, a majority of Silents say it is neither. Silents are much more negative about three other trends: 72% say that more single women having children is bad for society; 58% say the same about more people living together without being married; and 55% say the same about gay couples raising children. Weighing Trends in Marriage and Parenthood, by Generation % saying this is a bad thing for society Millennial Gen X Boomer Silent (18-29) (30-45) (46-64) (65+) More single women deciding to have children 59 54 65 72 More gay couples raising children 32 36 48 55 More mothers of young children working outside the home 23 29 39 38 More people living together without getting married 22 31 44 58 More people of different races marrying each other 5 10 14 26 Note: “Good thing”, “Doesn’t make much difference”, and “Don’t know/Refused” responses not shown.
  59. Chapter 6: Family Values 53 Of all the trends examined,

    the one that draws the most negative assessments across all four generations is more single women having children. A majority of Silents (72%), Boomers (65%), Xers (54%) and Millennials (59%) say this trend is bad for society. (In 2007, 39.7% of all children in the United States were born out of wedlock. In 1970, that figure was just 10.7%.)26 While the public tends to see more bad than good in this set of trends, its level of disapproval has moderated in recent years. Compared with similarly aged respondents to a Pew Research Center survey conducted in 2007, Millennials are anywhere from 6 to 15 percentage points less disapproving of these trends now than they had been then. Likewise, those ages 30 and older are anywhere from 5 to 9 percentage points less disapproving now. Millennials’ views of changes in the American family may be shaped at least in part by their own experiences growing up. Only 62% of Millennials say that their parents were married during the time they were growing up. That compares with 71% of Gen Xers, 85% of Boomers and 87% of Silents. Roughly one quarter of Millennials (24%) say their parents were divorced or separated, and 11% say their parents were never married (2% say their parents were widowed and 1% did not answer the question). As a result, three-in-ten Millennials (31%) say they lived with only one parent while they were growing up (27% lived with their mothers, 4% with their fathers), while 61% lived with both parents. Gen Xers are more likely than Millennials to have grown up in a household with both parents (68%). And among Boomers and Silents, 80% 26 1970 data is from Ventura, Stephanie J. and Christine A. Bachrach. Nonmarital Childbearing in the United States, 1940-1999. National Vital Statistics Reports; vol 48, no. 16. Hyattsville, Maryland: National Center for Health Statistics. 2000. 2007 data is from Ventura, Stephanie J. Changing Patterns of Nonmarital Childbearing in the United States. NCHS Data Brief, no. 18. Hyattsville, Maryland: National Center for Health Statistics. 2009. Changes since 2007 in Attitudes about Marriage and Parenting % of 18- to 29-year-olds saying each is a bad thing for society 2007 2010 Change More gay couples raising children 47 32 -15 More people living together w/o getting married 32 22 -10 More mothers of young children working outside home 30 23 -7 More single women having children 65 59 -6 Note: “Good thing”, “Doesn’t make much difference”, and “Don’t know/Refused” responses not shown. Source for 2007 data: Pew Social and Demographic Trends survey report, “As Marriage and Parenthood Drift Apart, Public is Concerned about Social Impact,” July 1, 2007. Growing Up with One Parent or Two Who did you live with most of the time while you were growing up?(%) 61 68 80 80 31 25 16 14 7 7 4 6 Millennial Gen X Boomer Silent Both parents Only one parent Neither parent Note: “Don’t Know/Refused” responses not shown.
  60. Chapter 6: Family Values 54 had both parents at home.

    Across age groups, whites are more likely than nonwhites to have grown up with both parents in their home. Differences among Millennials Millennials are not of a single mind about these trends, nor are members of other generations. Within generations opinions vary according to gender, partisanship, religious affiliation, and other factors. Among Millennials, for the most part, these subgroup differences tend to be rather modest. For example, when it comes to views about the trend toward more single women having children, two-thirds of male Millennials say it is bad for society, compared with just half of female Millennials. There’s a similarly sized divide on this question by partisanship: two- thirds of Republicans or Republican leaners say this trends is bad for society, compared with 53% of Millennials who are Democrats or lean that way. These same gaps exist among older generations. Some 66% of black Millennials say this trend is bad for society, compared with 57% of whites and 59% of Hispanics. Because of the relatively small size of the black and Hispanic subgroups in the survey, these differences fall short of statistical significance. Nonetheless, the percentages are notable in light of the fact that single parenthood is much more prevalent among blacks than whites. Religious beliefs also impact views about these societal trends. Millennials who are atheist, agnostic or otherwise unaffiliated with a religious denomination are more accepting of single women having children. Less than half of unaffiliated Millennials (47%) disapprove of this trend, compared with 61% of those with a clear religious affiliation. Millennials are more accepting of the trend toward mothers of young children working outside the home and the trend toward couples living together without getting married. Less than a quarter of Millennials disapprove of each of these trends. On these questions, there are subgroup differences by partisanship. For example, 33% of Millennials who are Republican or lean Republican disapprove of cohabitation without marriage, compared with 14% of those who are Democrats or lean Democratic. Difference in Family Values among Millennials % who disapprove of “single women having children” 59 66 51 66 53 66 57 59 61 47 All Millennials Men Women Rep/Lean Rep Dem/Lean Dem Black White Hispanic Religiously affiliated Unaffiliated Note: Based on adults ages 18-29.
  61. Chapter 6: Family Values 55 The marital circumstances of the

    family home in which a Millennial was raised is also associated with attitudes toward some of these trends. For example, 27% of Millennials whose parents were married disapprove of cohabitation without marriage, compared with 15% of those whose parents were divorced or separated. Attitudes toward Gay Marriage Gay marriage has been a heated political and civil rights issue for the better part of a decade, and Millennials have a distinctive set of views on the matter. Fully half either strongly favor (21%) or favor (29%) legalization of gay marriage, while just 36% oppose, making Millennials the only living generation that tilts positive on this question. The views of Xers are not significantly different from Millennials on the issue of gay marriage, though Xers oppose legalization by a narrow margin (46% oppose and 43% favor). Silents oppose gay marriage by a ratio of nearly three-to-one; Boomers by a ratio of nearly two-to-one. Among Millennials, women are more supportive of legalizing gay marriage than are men. Democrats are more supportive than either Republicans or independents. Religion makes a difference as well. Millennials who are religiously affiliated are much less supportive of gay marriage than are those with no religious affiliation (45% vs. 67%). And whites and Hispanics are more supportive than blacks. Views about Gay Marriage, by Generation % who favor/oppose allowing gay and lesbian couples to marry legally 38 50 43 32 24 51 36 46 58 66 All Millennial Gen X Boomer Silent Strongly favor/Favor Stongly oppose/Oppose Views on Living Together without Marriage % of Millennials saying this is a bad thing for society 33 14 27 15 Rep/Lean Rep Dem/Lean Dem Married Divorced or separated Among Millennials whose parents were… Note: Based on adults ages 18-29.
  62. Chapter 6: Family Values 56 When it comes to the

    size of these various gaps, partisanship stands out. Fully 63% of Millennials who are Democrats or lean to the Democratic Party support gay marriage. This compares with just 37% of self-described Republicans or Republican leaners. This partisan gap is not unique to Millennials. In fact, it is even sharper among those ages 30 and older: 47% of Democrats and those who lean to the Democratic Party favor gay marriage, compared with only 21% of Republicans and Republican leaners. Views about Gay Marriage among Millennials % saying they favor legalization … 50 44 56 37 63 47 45 67 53 36 51 All Millennials Men Women Rep/Lean Rep Dem/Lean Dem Independent Religiously affiliated Unaffiliated Whites Blacks Hispanics Note: Based on adults ages 18-29.
  63. Chapter 7: Lifestyle 57 Chapter 7: Lifestyle In many of

    their lifestyle choices, Millennials are not much different from adults of other generations. And it’s often their ideology or socioeconomic status, rather than their age, that drives their behaviors. In realms as disparate as gun ownership and going green, Millennials are in the mainstream. But in some corners of their lives, they find unique ways to express themselves. Technology usage, as noted in Chapter 4, is one. Body art is another. Tattoos have become something of a trademark for Millennials—nearly four-in-ten (38%) have at least one. Gen Xers are not far behind; 32% say they have a tattoo. Only 15% of Baby Boomers and 6% of Silents wear body art. Moreover, one tattoo isn’t enough for many Millennials. While 31% of tattooed Millennials have just one tattoo, half have two to five tattoos. And fully 18% have six or more. Among adults ages 30 and older who have tattoos, nearly half (47%) have just one. Only 9% say they have six or more tattoos. Among all adults, men and women are equally likely to have a tattoo. Among Millennials, those who have not attended college are more likely than those with at least some college experience to have a tattoo (47% vs. 30%). If you see a Millennial with a tattoo, he or she is more likely to have voted for Barack Obama than for John McCain in the 2008 presidential election. There is no evidence to suggest that tattoos are a form of political expression for Millennials. However, both party and ideology are correlated with having a tattoo. Among adults under age 30, 44% of Democrats or independents who lean Democratic have at least one tattoo. Among Republicans and independents who lean Republican, 31% have a tattoo. Similarly, 43% of Millennials who identify themselves as liberals have a Tattoos, by Generation % who have a tattoo 23 38 32 15 6 All Millennial (18-29) Gen X (30-45) Boomer (46-64) Silent (65+) The Politics of Tattoos Based on Millennials 31 44 32 37 43 69 56 68 63 57 Rep/Lean Rep Dem/Lean Dem Conservative Moderate Liberal Yes No Do you have a tattoo? (%) Note: Based on adults ages 18-29. Sample sizes of subgroups are as follows: Rep/Lean Rep, n=268; Dem/Lean Dem, n=425; Conservative, n=233; Moderate, n=275; Liberal n=249. “Don’t know/Refused” responses not shown.
  64. Chapter 7: Lifestyle 58 tattoo, versus 32% of conservatives who

    have one. Most adults with tattoos, whether young or old, don’t display them for all the world to see. When asked if their tattoos are usually visible, the vast majority (72%) say that they are not. This is true for Millennials and their older counterparts. Among those with at least one tattoo, 70% of Millennials and 73% of those ages 30 and older say their tattoos are not usually visible. Men are more likely than women to have tattoos that can be seen by all—23% vs. 13%. This pattern is consistent across age groups. When asked whether their tattoos are usually visible, roughly one-in-ten tattooed women volunteered that it depends on what they are wearing. In addition to tattoos, many Millennials choose to alter their appearance with body piercings. Nearly a quarter of Millennials (23%) say they have a piercing in a place other than an ear lobe. In this regard, Millennials lead all other generations. One-in-ten Gen Xers (9%) have a piercing somewhere other than an ear lobe, and among those ages 45 and older, only 1% has one. Young women are much more likely than young men to have a body piercing: 35% of women under age 30 have a piercing somewhere other than an ear lobe, compared with 11% of men. Tattoos: Public or Private? Based on all adults with tattoos 18 23 13 72 68 76 All adults with tattoos Men with tattoos Women with tattoos Yes No Are your tattoos usually visible or not? (%) Note: Sample sizes of sub-groups are as follows: all adults with tattoos n=492; men, n=244; women, n=248. “Depends on what I’m wearing”; “Some visible, some not”; and “Don’t know/Refused” responses not shown. Body Piercings % who have a piercing somewhere other than an ear lobe 8 23 9 1 All Millennial Gen X Boomer
  65. Chapter 7: Lifestyle 59 Going Green Protecting the planet is

    a multi-generational cause these days. Most Millennials recycle and try to buy green products, but the same can be said of adults of all ages. In fact, Millennials lag behind their older counterparts in terms of recycling. This is probably more an outcome of their stage in life than a measure of their commitment to the environment. Roughly seven-in-ten Millennials (69%) say they recycle paper, plastic or glass at home. That compares with 77% of Gen Xers, 72% of Boomers and 77% of Silents who recycle. Among all age groups, those with at least some college education are more likely to recycle than those who have never attended college. The gap is particularly wide among Millennials: 78% of those who have gone to college recycle, compared with 60% of those who have not. Millennials are just as likely as other age groups to say they try to buy green or environmentally friendly products, even if they are more expensive. Just over half of Millennials (53%) say they buy green products. Roughly the same proportion of Gen Xers (55%), Boomers (54%) and Silents (51%) say they do so as well. Income is a barrier to buying green products for adults of all ages—63% of Millennials with annual household income of $75,000 or more say they try to buy green products, as do 62% of those 30 and older in the same income category. That compares with less than half of those whose annual income is below $30,000. More than a third of all adults say they try to buy organic foods, even if they are more expensive. This includes nearly equal proportions of Millennials (36%), Gen Xers (38%) and Boomers (35%). Members of the Silent generation are less likely to buy organic foods (27%). Among both Millennials and older age groups, women are more likely than men to buy organic. Environmentally Conscious Behaviors % who do each 69 53 36 77 55 38 72 54 35 77 51 27 Recycle from home Buy green products Buy organic foods Millennial Gen X Boomer Silent
  66. Chapter 7: Lifestyle 60 Exercise and Leisure Exercise is a

    big part of the lives of most Millennials. More than half say they got some kind of vigorous exercise, such as jogging, biking or working out at a gym, in the 24 hours before they were interviewed for the survey. Gen Xers are somewhat less likely to exercise daily—48% of those surveyed said they had gotten vigorous exercise in the previous 24 hours. Roughly four-in-ten Boomers (42%) and members of the Silent generation (39%) say they exercised in the past 24 hours. The differences across age groups are likely due at least in part to life-cycle effects. Not only are Millennials younger and healthier, but they also are less likely than their older counterparts to be married or have children, and so probably have more time available for exercise. Among Millennials, men are much more likely than women to exercise: 63% of men ages 18-29 say they got vigorous exercise in the past 24 hours, compared with 48% of women. The gender gap among older adults is significantly smaller. While Millennials are more likely than older adults to exercise on a daily basis, they are less likely to watch TV. Some 57% say they watched more than an hour of television programming in the past 24 hours. Two- thirds of Gen Xers (67%) watched more than an hour of TV, as did 80% of Boomers and Silents. Much of the reality TV programming these days may seem to be geared toward young viewers, but Millennials are no more likely than Gen Xers or Boomers to actively participate in reality TV. One-in- five Millennials say they have voted for a contestant in a televised talent contest such as “American Idol” or “Dancing with the Stars.” Nearly as many (18%) of Gen Xers and Boomers say they have voted, while only 11% of Silents have done this. Women are much more likely than men to have voted on a show like “American Idol,” and this is true for young and old alike. Among Millennials, those who use social networking sites such as Facebook or MySpace are nearly twice as likely as those who do not use social Who Votes on ‘American Idol’? % saying they have voted for a contestant in a televised talent contest 14 9 27 24 Millennial 30+ Men Women Millennials and Exercise % saying they got vigorous exercise in the past 24 hours 46 56 48 42 39 All Millennial Gen X Boomer Silent
  67. Chapter 7: Lifestyle 61 networking sites to have cast a

    vote for a reality TV contestant (23% vs. 12%). Nearly 28% of Millennials say they have a gun, rifle or pistol in their home. They fall slightly below the general population in gun ownership (34% of all adults say they own at least one gun). Baby Boomers are more likely than any other age group to own a gun—42% of Boomers have a gun, compared with 31% of Gen Xers and 32% of Silents. Men are more likely than women to own a gun, and Republicans are much more likely than Democrats to do so. This is true among Millennials as well as those ages 30 and older. Gay Friends and Family Members Millennials are different from members of other generations when it comes to their experience with and exposure to gay people. More than half of Millennials (54%) say they have a close friend or family member who is gay. That compares with 46% of Gen Xers, 44% of Boomers and 26% of members of the Silent generation. Millennials are more likely to favor gay marriage than are members of other generations. And for Millennials, having a close friend or family member who is gay is strongly linked to support for legalizing gay marriage. Among those ages 18-29 who have a gay friend or relative, nearly two-thirds (65%) favor allowing gay and lesbian couples to marry, while 23% are opposed to this. For those ages 30 and older, the correlation is not as strong. Roughly half of those over the age of 29 (51%) who have a gay friend or relative favor gay marriage, while 40% oppose it. Among Millennials, women are much more likely than men to say they have a close friend or family member who is gay (63% vs. 45%). The gender gap among those ages 30 and older is not nearly as wide. Party identification and education are also correlated with knowing someone who is gay, and this is true for both young and old. Democrats as well as those who have attended or graduated from college are much more likely than Republicans and those who have not gone to college to have a gay family member or close friend. When Gay Marriage Gets Personal % who… 65 51 23 40 Under 30 and have a gay friend or family member 30 + and have a gay friend or family member Favor gay marriage Oppose gay marriage Millennials and Guns % saying they have a gun in their home 34 28 31 42 32 All Millennial Gen X Boomer Silent
  68. 62

  69. Chapter 8: Politics, Ideology and Civic Engagement 63 Chapter 8:

    Politics, Ideology and Civic Engagement In the 2008 presidential election, Millennials made a big splash. They supported Barack Obama over John McCain by a lopsided margin of 66% to 32% while voters ages 30 and older were dividing their votes almost evenly (Obama 50%; McCain 48%).27 This was the largest disparity between younger and older voters recorded in four decades of modern exit polling. Moreover, after decades of low voter participation by the young, the turnout gap in 2008 between voters under and over the age of 30 was the smallest it had been in any election since 18- to 20-year-olds were given the right to vote in 1972. Even before Millennial voters lent such strong support to Obama, their partisan leanings had already become clear. In both the 2004 and 2006 elections, a significantly greater share of young adults than older adults voted Democratic. By 2008, the Democratic Party’s advantage in party affiliation among young voters, including those who “lean” to a party, had reached a whopping 62% to 30%—larger than for any other age group. Yet since 2008, both the partisan leanings and political activism of Millennials have ratcheted down. In recent elections in Virginia, New Jersey and Massachusetts, turnout among young voters was notably low (both in absolute terms and relative to the turnout of older voters). By the end of 2009, the Democratic Party’s advantage among Millennials had been cut by more than half, to a still sizable but much narrower 54% to 40% edge over the GOP. In addition, Millennials today are evenly split on whether or not Obama has changed the way Washington works, and his job approval rating among them has fallen considerably, just as it has among older adults. To be sure, Millennials remain significantly more liberal than members of other generations. This is reflected not just in their partisan identification and voting patterns, but also in their overall views about the role of government and about a range of social and national security issues. More than half of Millennials (53%) say government should do more to solve problems, while 42% say government is doing too many things better left to businesses and individuals. Support for an activist government is not as strong among other generations of Americans. The distinctiveness of members of the Millennial generation is particularly evident in their social values, where they stand out for their acceptance of homosexuality, interracial dating, expanded roles for women and immigrants. At the same time, however, their views are not particularly distinctive in other areas, such as attitudes about business and the social safety net. 27 See National Exit Poll results as published by CNN (http://www.cnn.com/ELECTION/2008/results/polls.main/). Millennials Are More Pro-Government % identifying with statement closest to their view 53 45 43 39 42 47 50 47 Millennial (18-29) Gen X (30-45) Boomer (46-64) Silent (65+) Government should do more to solve problems Government is doing too many things better left to businesses and individuals Note: “Don’t know/Refused”responses not shown.
  70. Chapter 8: Politics, Ideology and Civic Engagement 64 In their

    civic engagement, Millennials present a mixed picture. On some measures, such as volunteering or boycotting a product or service, Millennials match their elders. On other measures, such as frequency of voting, Millennials lag behind other generations. It is true that Millennials narrowed the age gap in voter turnout in 2004 and 2008. But the relatively low turnout of Millennials in more recent elections raises questions about the durability of that change. Moreover, even though Millennials made extensive use of social media in the 2008 campaign, it is too early to judge the long-term impact of these technologies on their level of engagement. This chapter draws on data from a number of sources, including the January 2010 survey of Millennials, as well as regular political surveys conducted by the Pew Research Center for the People & the Press and the Center’s ongoing study of political values that began in 1987. Some of the material in this chapter was recently published in “Democrats’ Edge among Millennials Slips: A Pro-Government, Socially Liberal Generation,” the Pew Research Center for the People & the Press’s report on the political values and partisanship of the Millennials. About the Values Surveys For more than two decades, the Pew Research Center for the People & the Press’s ongoing political values surveys have tracked a broad range of beliefs and values that shape public opinion and ultimately influence voting behavior. The study has been conducted 14 times since 1987 and asks respondents whether they agree or disagree with a series of approximately 80 statements covering core beliefs about government, business, religion and several other topics. The most recent study in the series was conducted March 31-April 21, 2009, with a nationwide sample of 3,013. To get a clearer sense of the broad trends in each of several different kinds of attitudes and values, related questions in each substantive area were combined into a summary index. Respondents were sorted into generations (also referred to as cohorts) according to their age at the time of the interview. Index scores for each generation of respondents are then presented graphically. Each line on the graph follows one cohort through the series of surveys. The Millennial cohort first appears in the 2003 survey, when enough interviews with adult members of that group were available for reliable reporting. Millennials in 2009, who ranged in age from 18 to 28, can usefully be compared with Gen X in 1994, when that cohort was roughly the same age. This allows a comparison of two cohorts at the same point in their own life cycles, though the circumstances of the political world in 1994 and 2009 were very different. Portions of this chapter are also available in a report by the Pew Research Center for the People & the Press entitled “Democrats' Edge among Millennials Slips: A Pro-Government, Socially Liberal Generation.”
  71. Chapter 8: Politics, Ideology and Civic Engagement 65 Views of

    Obama and Change in Washington During the 2008 presidential campaign, candidate Obama said again and again that if elected president he would change the way things work in Washington. According to the current Millennials survey, the public is split on whether or not Obama’s election has accomplished this overarching goal—47% say Obama’s arrival in Washington has changed the way it works, while 47% say things have not changed. Even though Millennials were among Obama’s biggest supporters in the 2008 election, today they are just as split as the general public on Obama’s impact on Washington. Some 46% say yes, things have changed, but nearly half (48%) say no, the way Washington works has not changed. Other generations are also split on whether the way Washington works has changed. Obama voters, whether young or old, see more change in Washington than those who did not vote for him. When asked why Obama has failed to change Washington, six-in-ten (60%) survey respondents who see no change say it is because opponents and special interests have prevented change. One-quarter (25%) place the blame on Obama; they say that he has not really tried to change things. As is the case with older age groups, more Millennials (56%) who see no change in Washington blame opponents and special interests for this, rather than Obama (30%). Public Split on Whether Obama Has Changed the Way Things Work in Washington Since Barack Obama has been in office, do you think the way things work in Washington (%) … 47 46 51 41 49 47 48 43 52 43 All Millennial Gen X Boomer Silent Has changed Has not changed Note: “Don’t know/Refused” responses not shown.
  72. Chapter 8: Politics, Ideology and Civic Engagement 66 Obama’s Job

    Approval Rating President Obama’s job approval rating has fallen substantially in the past year across all age groups, Millennials included. In Pew Research’s February 2010 survey, 57% of Millennials approved of the way Obama was handling his job as president, down from 73% in February 2009. Moreover, Millennials have become much more critical of Obama’s handling of several major issues, especially the war in Afghanistan. In January, Millennials were the only age group in which more disapproved than approved of Obama’s handling of the situation in Afghanistan. Even as Millennials have grown more critical of some of Obama’s major policies—and his job approval among them has fallen—he remains personally very popular with young people. In November, 75% of Millennials said they had a favorable impression of Obama, which was virtually unchanged from January 2009. Meantime, Obama’s personal favorable ratings fell by double digits among older age groups, including by 25 points among members of the Silent generation. Over this period, the share of Millennials expressing unfavorable opinions of Obama remained relatively stable (19% in November). Negative opinions of Obama in older age groups have increased markedly: Among Baby Boomers, 32% expressed an unfavorable opinion of Obama in November, up from 13% in January. Among the Silent generation, 38% viewed Obama unfavorably in November, compared with just 8% less than a year earlier. Obama Job Rating among Millennials Still Positive, Less Glowing % who approve of Obama’s job peformance 39 63 49 62 73 57 30 55 80 Silent Boomer GenX Millennial Feb June Sept Feb 2009 2010 Source: Pew Research Center surveys Obama Still Personally Popular with Millennials Favorability of Barack Obama Jan 2009 April 2009 Nov 2009 Jan-Nov Un- Un- Un- change Fav fav Fav fav Fav fav in fav % % % % % Total 79 15 73 24 65 30 -14 Millennial 73 23 82 16 75 19 +2 Gen X 79 14 75 23 69 27 -10 Boomer 82 13 69 28 63 32 -19 Silent 81 8 66 29 56 38 -25 Note: “Never heard of/Can’t rate/Refused” responses not shown. Source: Pew Research Center surveys
  73. Chapter 8: Politics, Ideology and Civic Engagement 67 Political Party

    Identification—A Declining Democratic Advantage among Millennials As Millennials have arrived on the political scene, they have consistently identified more with the Democratic Party than the Republican Party. Interviews with more than 18,000 registered voters nationwide in 2009 found an average of 37% of Millennial voters identifying as Democrats and 22% as Republicans. A substantial share of Millennials called themselves independent (38%), while the rest mentioned another party or did not state a preference. The 2009 Democratic advantage was even larger when the partisan leaning of independents is taken into account. An additional 20% of Millennial voters said they leaned toward the Democratic Party, 13% toward the Republican Party and 8% did not lean either way. When these leaners are combined with partisans, 57% of Millennial voters identified with or leaned toward the Democratic Party; only 35% identified with or leaned toward the Republican Party. The Democratic advantage among Millennials peaked in 2008 when 62% favored the Democrats and only 30% the Republicans. From 2003 to 2007, the Democrats held an advantage of 11 to 21 points in leaned party identification among Millennials. The partisan leanings of the Millennial generation have consistently stood apart from older generations. On average in 2009, the Democrats held a 22-point edge over Republicans in leaned party identification among Millennial voters. This compares with more modest advantages among voters in Gen X (50% to 41%) and in the Baby Boom (50% to 40%) and Silent generations (49% to 41%). In 2003, the balance of Republican and Democratic identification was virtually even among all three older generations, while Millennials favored the Democrats by 50% to 39%. Leaned Party Identification by Generation: 1990-2009 50 62 57 35 45 55 65 Greatest <1928 Silent 1928-1945 Boomer 1946-64 GenX 1965-80 Millennial 1981+ Democrat/Lean Democratic 50 62 57 25 45 65 1990 1997 2003 2009 Republican/Lean Republican 39 30 35 1990 1997 2003 2009 Note: Based on registered voters. Data points represent annual totals based on all Pew surveys of the general public conducted in each calendar year. Source: Pew Research Center surveys
  74. Chapter 8: Politics, Ideology and Civic Engagement 68 Republican Gains

    in 2009 Between the 2004 and 2008 presidential election years, the Democratic Party opened a substantial advantage nationwide in party identification. In 2004, Democrats held a slim 47% to 44% advantage in leaned party identification among registered voters. By 2008, this lead had expanded to 51% to 39%. But the Democrats’ advantage peaked in 2008 and early 2009, and it has decreased over the past year. In the first quarter of 2009, 53% of registered voters identified with or leaned to the Democratic Party, compared with 38% who identified with or leaned to the Republican Party. But in the final quarter, Democrats had only a 49% to 42% advantage over Republicans among voters. This overall shift has taken place within most age groups. The share of Millennial voters who identified or leaned Democratic fell from 60% at the beginning of 2009 to 54% at the end of the year, while the share who identified or leaned Republican rose from 31% to 40%. While the Democratic Party still maintained an advantage among Millennials at the end of 2009, the margin had shrunk substantially. Democrats also enjoyed a double-digit advantage among voters in the other generations at the start of the 2009. But as the year came to a close, the Democratic Party’s edge among Boomers and those in the Silent generation had all but disappeared. Leaned party affiliation among Generation X ended the year much as it started, with a modest Democratic advantage. Changes in Party Identification in 2009 by Generation % who approve of Obama’s job peformance 53 52 49 49 60 58 56 54 51 53 46 50 52 51 49 47 54 48 48 46 38 37 41 42 31 31 37 41 37 44 41 39 38 39 44 38 40 42 44 40 Jan-Mar April-June July-Sept Oct-Dec Jan-Mar April-June July-Sept Oct-Dec Jan-Mar April-June July-Sept Oct-Dec Jan-Mar April-June July-Sept Oct-Dec Jan-Mar April-June July-Sept Oct-Dec Dem/lean Dem Rep/lean Rep A A A Millennial (1981+) GenX (1965-80) Boomer (1946-64) Silent (1928-1945) Dem adv N All registered voters + 15 3473 +15 5423 +8 5426 +7 4147 +29 330 +27 491 +19 485 +14 352 + 10 743 +16 1100 +2 1063 +9 824 + 13 1397 +13 2234 +10 2208 +3 1698 + 16 783 +8 1256 +6 1367 +2 1014 Source: Pew Research Center surveys
  75. Chapter 8: Politics, Ideology and Civic Engagement 69 Younger Voters

    over Time The Millennial generation is more Democratic in their party affiliation than Gen Xers when they were young but are not substantially more Democratic than young Boomers or members of the Silent generation at comparable points in time. To understand how each of the generations identified politically when they were young, selected years were chosen where the members of each generation were about the same age as Millennials are today. These years also align with key presidential or midterm elections that may have helped shape the political views each of the respective generations. In 2008, at the height of the Democratic Party’s advantage, 41% of Millennial voters identified with the Democratic Party, while only 22% identified with the GOP. By comparison, Republicans had a slight advantage over Democrats among Gen Xers when they were roughly the same age as Millennials are today. In 1994, a strongly Republican year, 34% of voters in Gen X said they were Republicans and 30% said they were Democrats. In recent years, Gen Xers have become more Democratic, along with the public as a whole. When Boomers and members of the Silent generation were the same ages as Millennials are today, they also identified more with the Democratic Party than the Republican Party. In 1974—a year in which a Republican president resigned from office—nearly half of Boomer voters (47%) identified with the Democratic Party and just 17% identified with the Republican Party. At that time, older generations also were more Democratic in their party affiliation. In 1956, a better time for the Republican Party, 45% of voters of the Silent generation identified as Democratic, compared with 28% who identified with the Republican Party. The Greatest generation, whose formative experiences included the Great Depression, the presidency of Franklin D. Roosevelt and the Second World War, remained more Democratic in affiliation than other cohorts throughout much of the second half of the 20th century, even though they—along with the rest of the populace—had become more Republican by 1994.28 28 Many of the cohort analyses in this chapter separate members of the Greatest generation (born 1910-1927) from the Silent generation (born 1928-1945). With the exception of Chapter 9, most of the other analysis in this report, including all discussions of the January 2010 survey, does not separate the Silent and Greatest generations because it deals with relatively recent data, in which the number of respondents from the Greatest generation is too small to tabulate separately. Party Identification over Time % of those in each generation who say they are… 1956* 1974* 1994 2008 % % % % Republican 35 22 33 28 Millennial (1981+) -- -- -- 22 GenX (1965-80) -- -- 34 29 Boomer (1946-64) -- 17 34 29 Silent (1928-1945) 28 23 31 31 Greatest (1910-1927) 30 26 33 -- Democrat 44 44 33 38 Millennial (1981+) -- -- -- 41 GenX (1965-80) -- -- 30 36 Boomer (1946-64) -- 47 30 37 Silent (1928-1945) 45 46 36 38 Greatest (1910-1927) 47 51 39 -- Independent 21 31 30 29 Millennial (1981+) -- -- -- 32 GenX (1965-80) -- -- 34 31 Boomer (1946-64) -- 35 34 29 Silent (1928-1945) 26 29 28 25 Greatest (1910-1927) 22 22 22 -- Note: Based on registered voters. “Other party” and “Don’t know/Refused” responses not shown. Source: *1956 and 1974 data based on surveys conducted by the Gallup organization and provided by the Roper Center. 1994 and 2008 based on Pew Research Center surveys.
  76. Chapter 8: Politics, Ideology and Civic Engagement 70 Political and

    Social Values Millennials are far more likely than older people to describe themselves as liberals. In the fourth quarter of 2009, as many Millennial voters identified themselves as liberals (29%) as conservatives (28%), while 40% said they are moderates. In every other age group, far more voters described their views as conservative than liberal. Among voters in Gen X, 38% described their political views as moderate and 38% said they were conservative; only 20% described themselves as liberal. More Baby Boomers and members of the Silent generation described their political views as conservative than moderate; 43% of Baby Boomer voters said they are conservative, 36% described themselves as moderate and only 18% said they are liberal. Similarly, 45% of voters in the Silent generation described their views as conservative, 35% as moderate and 15% as liberal.29 29 Self-reported ideology trend results are based on annual averages among registered voters from Pew Research Center surveys. While slightly different, the January 2010 Pew Research Center survey reports that among Millennial registered voters, 29% say their political views are liberal, 34% say they are moderates and 32% are conservative. For a complete tabulation by generation, see the survey topline in the Appendix. Self-Reported Ideology by Generation: 1997-2009 Liberal 15 18 20 29 10 20 30 40 50 1997 2003 2009 Conservative 45 43 38 28 1997 2003 2009 10 20 30 40 50 Silent 1928-1945 Boomer 1946-64 GenX 1965-80 Millennial 1981+ Note: Based on registered voters. Source: Pew Research Center surveys
  77. Chapter 8: Politics, Ideology and Civic Engagement 71 Millennials are

    significantly less critical of government on a number of dimensions than are other age cohorts. This tendency has been seen on a variety of individual survey questions as well as on a three-question index of items from the political values survey; this index covers opinions about government’s effectiveness, government regulation of business and whether the government has too much control over people’s lives. The public’s attitudes about the role of government have fluctuated over the years in response to political events and in reaction to the leadership at the time. For example, support for an active government reached a low point in 1994, the year of sweeping Republican victories in the congressional elections that fall. And support fell again in 2007 as much of the public lost faith in the Bush administration. Baby Boomers were more supportive of active government than the Silent generation through much of the period covered by the survey, but in 2007 and 2009 the views of these two cohorts converged. Generation X has been more supportive than the Boomers throughout the period, a result at odds with the fact that this generation has been somewhat more Republican than other cohorts throughout much of its existence. The Millennials are more supportive of government than is Gen X, but they are currently no more supportive than Gen X was in 2002, a few months after the 9/11 attacks. One key indicator in this series explores the public’s views about government efficiency. Majorities of the public since 1987 have agreed with a statement that asserts that the government is often wasteful and inefficient, though the size of that majority has varied substantially over the period. Since their appearance in the Pew Research Center values surveys in 2003, Millennials have been less likely than other age cohorts to agree with that statement. In 2009, just 42% did so, compared with 55% for Generation X, 66% for Baby Boomers and 62% for the Silent generation. Scope of Government Index Government is generally effective, pro-regulation Government is ineffective, anti-regulation 87 88 90 92 94 97 99 02 03 07 09 Silent Boomer GenX Millennial Source: Pew Research Center surveys When Something Is Run by the Government, It Is Usually Inefficient and Wasteful % who agree 20 40 60 80 Silent Boomer GenX Millennial 87 88 90 92 94 97 99 02 03 07 09 Source: Pew Research Center surveys
  78. Chapter 8: Politics, Ideology and Civic Engagement 72 In 1994,

    when Generation X spanned roughly the same ages (18 to 28) as the adult Millennials last year, 55% of that cohort agreed that government was wasteful and inefficient, considerably greater than the share of Millennials who said that last year (42%). It is unclear whether Millennials will continue to be less critical of government going forward, especially because overall anti-government sentiment is considerably lower now than in 1993. But, compared with older cohorts, Gen Xers have remained less opposed to active government for more than a decade, suggesting that these attitudes, once formed, tend to persist, at least in comparison with other age cohorts. Views of the role of government are not the same across all Millennials. Nearly two-thirds (64%) of Hispanics and 61% of blacks say government should do more to solve problems. In contrast, less than half (47%) of white Millennials say the same. Young women are more likely than young men to say government should do more—59% vs. 46%. Millennial college graduates, current college students and those with some college experience are more likely than Millennials with no college experience to say that government does too much —46% vs. 37%. Among Millennials, Women and Minorities Most Pro-Government % identifying with statement closest to their view 53 55 50 46 59 47 61 64 50 55 42 40 44 47 36 49 46 37 35 25 All Millennials 18-24 25-29 Men Women Whites Blacks Hispanics College No college Government should do more to solve problems Government is doing too many things better left to businesses and individuals Note: Based on adults ages 18-29. “Don’t know/Refused” responses not shown.
  79. Chapter 8: Politics, Ideology and Civic Engagement 73 Millennials Socially

    Liberal Not only are Millennials more likely than other generations to say they are politically liberal, but they stand out as significantly more liberal than other generations in terms of social values. On an index composed of questions about family, homosexuality and gender roles, members of Generation X are somewhat more conservative than Millennials but are more similar to them on social values than are the two older generations. Baby Boomers are slightly more conservative than Gen X and have become less conservative since first being polled in 1987. The most conservative group is the Silent generation. Even though they have become slightly more progressive in their views over time, they continue to hold much more traditional social values than other age groups. In the 2009 survey, 82% of the Silent generation agreed that they have “old-fashioned values about family and marriage.” By contrast, 61% of Millennials agreed. Members of Generation X in 2009 were only slightly more likely than Millennials to agree with the statement (67% did so). But in 1994, when members of Gen X were about the same ages as the Millennials were in 2009, 77% of Gen X agreed. One of the underlying factors in the strong generational pattern in social values is religion. Younger cohorts are less likely than older ones to express strong religious sentiment and are more apt to be religiously unaffiliated (for an extensive analysis of generational differences in religion, see Chapter 9). On an index of three questions measuring traditional religious values, Millennials register as less religious than other generations. Social Conservatism Index Conservative views on family, homosexuality, civil liberties Liberal views on family, homosexuality, civil liberties 87 88 90 92 94 97 99 02 03 07 09 Silent Boomer GenX Millennial Source: Pew Research Center surveys I Have Old-Fashioned Values about Family and Marriage % who agree 40 60 80 100 Silent Boomer GenX Millennial 87 88 90 92 94 97 99 02 03 07 09 Source: Pew Research Center surveys
  80. Chapter 8: Politics, Ideology and Civic Engagement 74 Views of

    Business Millennials’ views of business are not substantially different from those of older generations. On a three- question index of attitudes about business power and profits, Millennials’ opinions mirror those of Gen Xers and members of the Silent generation and are slightly less critical of business than are the views of Baby Boomers. Millennials are no more likely than other cohorts to say that big companies have too much power, and Millennials are nearly as likely as other cohorts to agree that the country’s strength is mostly built on the success of American business. On one question, Millennials appear more supportive of business than their elders. A higher percentage of Millennials than other cohorts agrees that “business corporations generally strike a fair balance between making profits and serving the public interest.” Among Millennials, 44% agree, compared with 35% each for Gen X and Boomers, and 32% for the Silent generation. Throughout much of their early adulthood, members of Generation X had also been more pro-business on this measure; in 2009, their views converged with those of the two older cohorts. Business Attitudes Index Businesses make fair profits and are not too powerful Businesses make too much profit and have too much power 87 88 90 92 94 97 99 02 03 07 09 Silent Boomer GenX Millennial Source: Pew Research Center surveys Business Corporations Generally Strike a Fair Balance between Making Profits and Serving the Public Interest % who agree 20 40 60 80 Silent Boomer GenX Millennial 87 88 90 92 94 97 99 02 03 07 09 Source: Pew Research Center surveys
  81. Chapter 8: Politics, Ideology and Civic Engagement 75 Which Has

    More Influence: Government or Business? Millennials are more supportive of activist government than other generations, yet are not much different in their attitudes about business compared to other generations. Which do Millennials think has more influence over their lives? In answer to this question, Millennials are evenly split. Four-in-ten (40%) say government has more influence over their lives, while 42% say business corporations do. The remainder say both or have no opinion. Like Millennials, Gen Xers are split about the influence of government and business corporations on their lives— 39% identify government as having the biggest role, and 41% identify business corporations. Among older generations, views about which has more influence are somewhat different from those of Millennials and Gen Xers. Baby Boomers are slightly more likely to point to government as having a greater influence than business corporations over their lives—42% vs. 35%. And among members of the Silent generation, more than twice as many say the government has more influence on how they live their lives than business corporations—48% vs. 18%. The Influence of Government and Business Which of these do you think has the most influence over how you live your life these days? 40 39 42 48 42 41 35 18 10 7 10 12 8 13 13 22 Millennial Gen X Boomer Silent Government Business Corporations Both (vol.) Don't know (vol.) Source: January 2010 Pew Research Center survey
  82. Chapter 8: Politics, Ideology and Civic Engagement 76 Social Safety

    Net While Millennials are less skeptical than older age groups about the effectiveness of government, they are not particularly supportive of an expanded government social safety net. In the 2009 survey, those younger than 30 were no more likely than Baby Boomers—and only somewhat more likely than the Silent generation—to favor an activist role for government in helping the poor on a three-question social safety net index. Since 2007, there has been a decline in the overall proportion favoring more generous assistance for the poor, a downturn that was true for Millennials as well as for older groups. In 2009, for instance, 51% of Millennials agreed that “the government should help more needy people even if it means going deeper in debt”; two years earlier, 59% of Millennials agreed with that statement. The decline was equally large among Gen Xers (from 55% in 2007 to 45% in 2009). On this measure, Millennials’ views came closest to those of Baby Boomers, with Gen Xers and members of the Silent generation less supportive of the government providing more aid for the needy if it means incurring more debt. Social Safety Net Index Silent Boomer GenX Millennial Government has a responsibility to help those in need It is not the government's role to guarantee a safety 87 88 90 92 94 97 99 02 03 07 09 Source: Pew Research Center surveys The Government Should Help More Needy People Even if It Means Going Deeper in Debt % who agree 20 40 60 80 Silent Boomer GenX Millennial 87 88 90 92 94 97 99 02 03 07 09 Source: Pew Research Center surveys
  83. Chapter 8: Politics, Ideology and Civic Engagement 77 Equal Rights

    The Millennial generation is somewhat more supportive of efforts to ensure equal rights than are members of older age groups, though it not clear that this difference is truly a generational one. Differences among the three older cohorts on this measure have narrowed over time. On an index of three questions measuring support for ensuring equal rights and opportunities, Millennials have been more in favor than other age groups in each survey since 2003. In the early 1990s, members of Generation X were at least as supportive as the Millennials are now. Gen X was distinct from older cohorts in those earlier years, but differences among the older three cohorts have vanished. The largest percentage difference between Millennials and other cohorts in the area of equal rights is on a question about improving the position of blacks and other minorities “even if it means giving them preferential treatment.” Among Millennials in 2009, 45% agreed that this should be done, a much higher level of support than among Gen Xers (30%), Boomers (27%) or the Silent generation (25%). But support for such efforts among Millennials has fluctuated over time as more members of the cohort have reached adulthood, with 53% supporting them in 2003 and fully 62% doing so in 2007. Among members of Generation X in 1993, 45% supported making efforts to improve the position of blacks and other minorities, even with preferential treatment, the same share as among the Millennials today. Affirmative Action % who agree “We should make every possible effort to improve the position of blacks and other minorities, even if it means giving them preferential treatment” 10 30 50 70 Silent Boomer GenX Millennial 87 88 90 92 94 97 99 02 03 07 09 Source: Pew Research Center surveys Equal Opportunity Index Ensure equal opportunity, even if preferential treatment Too far on equal rights, oppose preferential treatment 87 88 90 92 94 97 99 02 03 07 09 Silent Boomer GenX Millennial Source: Pew Research Center surveys
  84. Chapter 8: Politics, Ideology and Civic Engagement 78 Another question

    that looks at attitudes about race, but is not included in the equal opportunity index, concerns interracial dating. This question shows a strong increase in approval over time within all age cohorts, as well as large and persistent differences among cohorts. In the 2009 survey, 93% of Millennials agreed that it was OK for blacks and whites to date. Among Gen Xers and Boomers, 86% and 83%, respectively, agreed. Among the members of the Silent generation, just 68% were supportive of blacks and whites dating. Members of all three older cohorts have all grown much more accepting of interracial dating over the past two decades. National Security In 2009, young people expressed less support for an assertive national security policy than did older people. The young were less supportive of remaining in Iraq and Afghanistan and less likely to say that the best way to achieve peace is through military strength. But the relationships among age, generation and attitudes about national security are complex and defy easy generalization. Generational differences are evident from an index of three values questions about national security policy. Members of the Silent generation tend to be more supportive of an assertive approach to national security, compared with members of other cohorts. At times, Baby Boomers have been more hawkish than the two younger generations, though often the differences among the cohorts have been quite small. The Millennials appear distinctively less hawkish in 2009, but that was not the case in 2007 or 2003. I Think It’s All Right for Blacks and Whites to Date Each Other % who agree 40 60 80 100 Silent Boomer GenX Millennial 87 88 90 92 94 97 99 02 03 07 09 Source: Pew Research Center surveys National Security Index Assertive approach to national security Less assertive approach to national security 87 88 90 92 94 97 99 02 03 07 09 Silent Boomer GenX Millennial Source: Pew Research Center surveys
  85. Chapter 8: Politics, Ideology and Civic Engagement 79 One of

    the key questions driving the pattern in the index asks people to agree or disagree with the statement that “the best way to achieve peace is through military strength.” With only a few exceptions, Generation X has been significantly less likely than the two older cohorts to agree with this statement. The Millennials first appeared in the 2003 survey, when 47% agreed. That was close to the 45% among Gen Xers who agreed and lower than the 55% of Boomers and 60% of the Silent generation who did so. In 2009, just 38% of Millennials agreed that peace is best achieved through military strength. Another dimension of attitudes about foreign affairs relates to immigration. Pew Research Center surveys in the past few years have found younger people more tolerant of immigrants than are older people. Especially in 2007 and 2009, older cohorts were more apt to say immigrants have a negative impact on American customs and values. Millennials were not particularly different from members of Gen X in either 2003 or 2007, but stood out as much more accepting of immigrants in 2009. Another question with a large age difference in 2009 found Millennials much less supportive of further restrictions on immigration than were other cohorts. Still, a 59% majority of Millennials said the U.S. should restrict and control immigrants more than it does now; at least 76% of each of the older cohorts agreed. The Best Way to Ensure Peace Is Through Military Strength % who agree 20 40 60 80 Silent Boomer GenX Millennial 87 88 90 92 94 97 99 02 03 07 09 Source: Pew Research Center surveys The Growing Number of Newcomers from Other Countries Threaten Traditional American Customs and Values % who agree 20 40 60 80 Silent Boomer GenX Millennial 87 88 90 92 94 97 99 02 03 07 09 Source: Pew Research Center surveys
  86. Chapter 8: Politics, Ideology and Civic Engagement 80 Political and

    Civic Engagement among Millennials From voting to volunteering to contacting their local government officials, citizens have many ways to get involved in their communities. Over the past 10 years, Millennials have matched other adults in some civic engagement activities, such as volunteering and consumer activism, but have lagged in others, such as voting and contacting public officials.30 In the 2010 Millennials survey, respondents were asked about their participation in eight different civic engagement activities, including how often they vote, whether they volunteer, whether they contacted a government official, whether they signed any petitions, and whether they bought products or refused to buy products because of the social and political values of a company.31 Political Engagement Younger Americans traditionally lag behind older Americans in their attention to politics and voting participation and in other forms of political activity. The Millennials today are no exception to this pattern. However, the presidential elections of 2004 and 2008 produced a significant uptick in voter turnout among young people, reducing the gap in turnout between younger and older Americans. It is unclear whether this pattern reflects a generational change or is mostly a result of circumstances unique to the highly polarized elections of recent times. 30 See Mark Hugo Lopez, Peter Levine, Deborah Both, Abby Kiesa, Emily Kirby and Karlo Marcelo, “The 2006 Civic and Political Health of the Nation: A Detailed Look at How Youth Participate in Politics and Communities,” Center for Information and Research on Civic Learning and Engagement, October 2006. 31 While this is a long list of civic engagement activities, it is by no means exhaustive. For a more complete list of civic engagement activities, see A New Engagement? Political Participation, Civic Life, and the Changing American Citizen by Cliff Zukin, Scott Keeter, Molly Andolina, Krista Jenkins, and Michael X. Delli Carpini (Oxford University Press, 2006). Measures of Political and Civic Engagement • Regular voting • Voter turnout In the past 12 months: • Spent time participating in any community service or volunteer activity • Contacted a government official in person, by phone or by letter • Contacted a government official by sending an email or posting a message on the official’s website or social networking page • Signed a petition online • Signed a paper petition • Bought a certain product or service because you like the social or political values of the company that provides it (buycotted) • Decided NOT to buy a product or service because you disagree with the social or political values of the company that provides it (boycotted)
  87. Chapter 8: Politics, Ideology and Civic Engagement 81 The percentage

    of young adults who turned out to vote jumped from 40% in the 2000 election to 49% in 2004, while turnout among older adults rose only 3 percentage points, to 68%. Turnout among the young rose again in 2008, to 51%, while among those 30 and older, turnout was virtually unchanged, at 67%. Looking across the 36 years for which reliable estimates of turnout by age are available, the gap in turnout percentage between older and younger people has not been as small since 1972, the first year that 18-year-olds were guaranteed the right to vote. The higher youth turnout in 2004 and 2008 may have been the product of many things, including highly charged campaigns, polarization over the president and two wars, and significant efforts on the part of the parties, campaigns and nonprofit organizations to mobilize young voters. The higher turnout also might signal an increased engagement that is generational in nature but that is difficult to prove at this point. Indeed, elections held since 2008 throw some cold water on the notion of a permanently engaged young cohort. The 2009 gubernatorial elections in New Jersey and Virginia were marked by low turnout among young voters. According to the Center for Information and Research on Civic Learning and Engagement (CIRCLE) at Tufts University, just one-in-ten (10%) Virginia voters in last year’s gubernatorial election were under 30. In contrast, the share of Virginia voters in November 2008 who were ages 18 to 29 was more than twice as large—21%. In New Jersey, fewer than one-in-ten (9%) voters in last year’s gubernatorial election were under 30, down from 17% in November 2008. Similarly, estimates of the number of young people who voted in the Massachusetts special election for the U.S. Senate in January 2010 were also quite low. According to a Washington Post-Kaiser Foundation-Harvard University special election poll, 13% of voters in the special election were Millennials Less Likely to Be Regular Voters % of registered voters who say they “always” or “almost always” vote 69 85 89 91 Millennial Gen X Boomer Silent Note: Based on registered voters. Voter Turnout in Presidential Election Years 49 48 49 44 52 40 40 49 51 55 71 71 69 72 64 65 68 67 67 70 1972 1976 1980 1984 1988 1992 1996 2000 2004 2008 18-29 30+ Size of age gap: 15 18 23 22 25 20 24 25 19 16 Source: Center for Information and Research on Civic Learning and Engagement (CIRCLE) tabulations from the Census Bureau’s Current Population Survey, November Supplements.
  88. Chapter 8: Politics, Ideology and Civic Engagement 82 under age

    30, down from 17% of voters in November 2008. Another way to assess the level of political engagement among registered voters is to ask them how often they vote. When asked this question in the 2010 Millennial survey, young people were least likely of any age group to say they always or almost always vote. Nearly seven-in-ten (69%) Millennial registered voters say they always or nearly always vote, compared with 85% of Gen X, 89% of Boomer and 91% of Silent registered voters. One reason young people may be less likely to identify themselves as regular voters is that, having recently turned 18, they have had fewer opportunities than others to vote. However, even among Millennials ages 25 to 29, the share saying they always or nearly always vote (75%) is lower than other generations. Generations and the 2010 Midterm Elections Millennials stand out for their support of Democrats in early surveys of voting intentions for the 2010 midterm elections. In combined data from January and February 2010, 51% of those younger than 30 said they support the Democratic candidate in their district, while 37% favor the Republican. In no other age group do the Democrats have a significant lead. In the fall of 2006, Millennials favored the Democratic candidate by 20 points (53% to 33%). A generational analysis of recent midterms finds that, as might be expected, the Silent generation has become much more Republican in its voting intentions. In the 2010 surveys, 48% of those in the Silent generation support the Republican candidate, compared with 39% who back the Democrat. In 2006 and 2002, the Silent generation supported the Democrat, while in the fall of 1994 members of this age cohort were evenly divided (45% Democrat, 43% Republican). Regular Voters among Millennials % of registered voters who say they “always” or “almost always” vote 69 65 75 70 69 76 60 All Millennials 18-24 25-29 Men Women College No college Note: Based on registered voters ages 18-29. 2010 Midterms: Millennials Favor Democrats % who say they will vote for the (Republican/Democratic) candidate for Congress in their district 1994 2002 2006 2010 Rep Dem Rep Dem Rep Dem Rep Dem % % % % % % % % All registered voters 45 43 42 46 39 49 43 45 Millennial -- -- -- -- 33 53 37 51 Gen X 48 46 43 44 40 46 44 45 Boomer 48 40 44 45 40 49 42 46 Silent 43 45 40 48 41 49 48 39 Note: All surveys of registered voters. Preferences include those who lean toward party’s candidate. 1994, 2002 election weekend surveys; 2006 surveys from October and election weekend; 2010 surveys conducted Jan. 6-10 and Feb. 3-9.
  89. Chapter 8: Politics, Ideology and Civic Engagement 83 Volunteering Volunteering

    for an organization or helping others without being paid is one way many Americans are involved in their communities. Nearly six-in-ten (57%) Millennials say that they had volunteered in the past 12 months, which is no higher than the proportion of Gen Xers (54%) who said they had done this. About half of Baby Boomers (52%) and just 39% of those in the Silent generation say they volunteered in the past year.32 Expression of Political Voice There are many ways citizens can express their point of view in their communities and to their elected leaders. One way is to sign a petition. On this measure of civic engagement, Millennials are just as likely as other generations to say they had done this in the past year. About two-in-ten (21%) Millennials say they had signed a petition online, a share equal to that among Gen Xers (19%) and Boomers (21%). Millennials are also just as likely as members of other generations to say they signed a paper petition. Nearly one-in-four (24%) Millennials say they had done this in the last year, as did 23% of Gen Xers and 20% of Silents. Boomers were the most likely to say they had signed a paper petition in the last year. Three-in-ten (30%) Boomers say they had done this. Another way to express one’s voice is to contact a government official, either electronically or in person. Fewer than one-in- 32 Volunteering is a difficult civic engagement activity to measure because measurement depends on survey question framing and context. According to an analysis of the Census Bureau’s Current Population Survey September supplement, the Corporation for National and Community Service reports a much lower volunteering rate than the current survey (52%). In 2008, 26.4% of Americans say they had volunteered for an organization in the year prior to the survey (Corporation for National and Community Service, 2009). Who Volunteers? % who say they volunteered in the past 12 months 57 54 52 39 Millennial Gen X Boomer Silent Expressing Political Voice % who say in the past 12 months they… 21 24 17 18 25 22 21 30 29 29 20 23 19 10 22 13 Signed a petition online Signed a paper petition Contacted an official by email, or the official's website or social networking page Contacted an official in person, by phone or letter Millennial Gen X Boomer Silent
  90. Chapter 8: Politics, Ideology and Civic Engagement 84 five Millennials

    (17%) say they contacted a government official by email, or through the official’s website or social networking site in the past 12 months; that is not much higher than the proportion of Silents (13%) that have done this. By comparison, 25% of Gen Xers and 29% of Boomers say they contacted a government official electronically. When asked if they had contacted a government official in person, by phone or by letter, fewer than one-in-five (18%) Millennials say they had done so in the past 12 months. Some 22% of Gen Xers and Silents said they had contacted a government official in person, by phone or by letter, in the last year. Boomers are slightly more likely to say they have contacted a government official in person, by phone or by letter. Nearly three-in-ten (29%) say they have done that in the past year. Political Consumerism Another way to express one’s voice is through consumer activism. This can come in two forms. Consumers can choose not to buy certain products or services because they disagree with the social or political values of the company that provides it—in short, they can engage in their own personal boycott. Alternatively, consumers can choose to buy the products of a company because they like the social or political values of the company that provides the product or service. This is called “buycotting.”33 When asked if they had decided NOT to buy a product or service in the past year because they disagreed with the social or political values of the company that provides that product or service, roughly a third of Millennials (35%), Gen Xers (34%), and Boomers (36%) say they had boycotted a company in the past year. A smaller share of Silents (25%) said they had done that in the past year. The Millennial survey also finds that nearly as many Americans say they had bought a product in the past year because they agree with the social or political values of a company as said they boycotted a company. About one- in-three (34%) Millennials said they have buycotted a company in the past 12 months; about as many Gen Xers (30%) report doing this. Some 27% of Boomers and 18% of Silents say they have buycotted a company in the past year. 33 Boycotting and buycotting are among the more common forms of political expression among the American public. In a 2006 survey from the Center for Information and Research on Civic Learning and Engagement (CIRCLE), more than one-in-three (35%) Americans said they had boycotted and nearly one-in-three (32%) said they had buycotted in the year prior to the survey. See Mark Hugo Lopez, Peter Levine, Deborah Both, Abby Kiesa, Emily Kirby and Karlo Marcelo, “The 2006 Civic and Political Health of the Nation: A Detailed Look at How Youth Participate in Politics and Communities.” Political Consumerism % who say in the past 12 months they… 35 30 36 34 34 27 25 18 Boycotted Buycotted Millennial Gen X Boomer Silent
  91. Chapter 9: Religious Beliefs and Behaviors 85 Chapter 9: Religious

    Beliefs and Behaviors By some key measures, Americans ages 18 to 29 are considerably less religious than older Americans. Fewer young adults belong to any particular faith than older people do today. They also are less likely to be affiliated than their parents’ and grandparents’ generations were when they were young. Fully one-in-four members of the Millennial generation are unaffiliated with any particular faith. Millennials are also more unaffiliated than members of Gen Xers were at a comparable point in their life cycle (20% in the late 1990s) and twice as unaffiliated as Baby Boomers were as young adults (13% in the late 1970s). Young adults also attend religious services less often than older Americans today. And compared with their elders today, fewer young people say that religion is very important in their lives. Yet in other ways, Millennials remain fairly traditional in their religious beliefs and practices. Pew Research Center surveys show, for instance, that young adults’ beliefs about life after death and the existence of heaven, hell and miracles closely resemble the beliefs of older people today. Though young adults pray less often than their elders do today, the number of young adults who say they pray every day rivals the portion of young people who said the same in prior decades. And though belief in God is lower among young adults than among older adults, Millennials say they believe in God with absolute certainty at rates similar to those seen among Gen Xers a decade ago. This suggests that some of the religious differences between younger and older Americans today are not entirely generational but result in part from people’s tendency to place greater emphasis on religion as they age. Young People Less Religiously Affiliated % unaffiliated with a religion, by generation Source: General Social Surveys Question wording: What is your religious preference? Is it Protestant, Catholic, Jewish, some other religion or no religion? Daily Prayer Among Young Adults, by Decade Among adults ages 18-29 in the… 1980s 1990s 2000s Pray daily 41 40 45 Pray less often 59 60 55 100 100 100 N 2,130 1,224 1,679 Source: General Social Surveys Question wording: About how often do you pray? [RESPONSE CATEGORIES INCLUDE: Several times a day, once a day, several times a week, once a week, less than once a week, never.]
  92. Chapter 9: Religious Beliefs and Behaviors 86 In their social

    and political views, young adults are clearly more accepting than older Americans of homosexuality, more inclined to see evolution as the best explanation of human life and less prone to see Hollywood as threatening their moral values. At the same time, Millennials are no less convinced than their elders that there are absolute standards of right and wrong. And they are slightly more supportive than their elders of government efforts to protect morality, as well as somewhat more comfortable with involvement in politics by churches and other houses of worship. These and other findings are discussed in more detail in the remainder of this report by the Pew Research Center’s Forum on Religion & Public Life. It explores the degree to which the religious characteristics and social views of young adults differ from those of older people today, as well as how Millennials compare with previous generations when they were young. Religious Affiliation Compared with their elders today, young people are much less likely to affiliate with any religious tradition or to identify themselves as part of a Christian denomination. Fully one-in-four adults under age 30 (25%) are unaffiliated, describing their religion as “atheist,” “agnostic” or “nothing in particular.” This compares with less than one-fifth of people in their 30s (19%), 15% of those in their 40s, 14% of those in their 50s and 10% or less among those 60 and older. About two-thirds of young people (68%) say they are members of a Christian denomination and 43% describe themselves as Protestants, compared with 81% of adults ages 30 and older who associate with Christian faiths and 53% who are Protestants. A Note on Sources and Methods This chapter is based on data from a variety of sources, including Pew Research Center surveys, which are used primarily to compare young adults with older adults today. General Social Surveys and Gallup surveys are used primarily for cohort analyses, which compare young adults today with previous generations when they were in their 20s and early 30s. While the surveys explore similar topics, exact question wording and results vary from survey to survey. Present-day comparisons are made between adults ages 18-29 and those 30 and older. By contrast, the cohort analyses define generations based on respondents’ year of birth. There is significant—but not complete— overlap between the two approaches. That is, in the present-day analyses, depending on the year of the survey being analyzed, some in the 18-29 age group are actually young members of Generation X (defined here as those born from 1965 to 1980) and not true members of the Millennial Generation (defined here as those born after 1980). This chapter is also available on the Pew Forum on Religion & Public Life’s website as a report titled “Religion Among the Millennials.”
  93. Chapter 9: Religious Beliefs and Behaviors 87 Religious Composition of

    Age Groups Total Total Total Pop. 18-29 30+ 30-39 40-49 50-59 60-69 70+ % % % % % % % % Christian 78 68 81 76 80 80 84 88 Protestant 51 43 53 47 52 54 57 62 Evangelical Churches 26 22 27 26 28 27 29 30 Mainline Churches 18 12 19 16 17 20 21 26 Historically Black Churches 7 8 7 6 7 7 7 6 Catholic 24 22 24 25 25 23 24 23 Mormon 2 2 2 2 2 1 2 1 Jehovah’s Witness 1 1 1 1 1 1 1 1 Orthodox 1 1 1 1 1 1 <0.5 1 Other Christian <0.5 <0.5 <0.5 <0.5 <0.5 <0.5 1 <0.5 Other Religions 5 6 4 5 4 5 5 4 Jewish 2 2 2 1 1 2 2 2 Muslim 1 1 <0.5 1 <0.5 <0.5 <0.5 <0.5 Buddhist 1 1 1 1 1 1 1 <0.5 Hindu <0.5 <0.5 <0.5 1 <0.5 <0.5 <0.5 <0.5 Other World Religions <0.5 <0.5 <0.5 <0.5 <0.5 <0.5 <0.5 <0.5 Other Faiths 1 2 1 1 1 1 1 1 Unaffiliated 16 25 14 19 15 14 10 8 Religious Unaffiliated* 6 9 5 7 6 5 3 3 Secular Unaffiliated* 6 9 6 7 6 6 4 3 Atheist 2 3 1 2 1 1 1 1 Agnostic 2 4 2 2 2 2 2 1 DK/REF 1 1 1 1 1 1 1 1 100 100 100 100 100 100 100 100 N 35,556 4,242 30,453 5,085 6,738 7,379 5,517 5,734 Source: 2007 U.S. Religious Landscape Survey, Pew Forum on Religion & Public Life Throughout this analysis, figures may not add to 100 and nested figures may not add to the subtotals indicated due to rounding. *The "religious unaffiliated" category includes those who describe their faith as "nothing in particular" but say that religion is somewhat or very important in their lives. The "secular unaffiliated" category includes those who describe their faith as "nothing in particular" and say that religion is not too important or not at all important in their lives (or who decline to say how important religion is in their lives). For more details on question wording and the classification of Protestant traditions, see the U.S. Religious Landscape Survey report, http://religions.pewforum.org/pdf/report-religious-landscape-study-full.pdf.
  94. Chapter 9: Religious Beliefs and Behaviors 88 The large proportion

    of young adults who are unaffiliated with a religion is a result, in part, of the decision by many young people to leave the religion of their upbringing without becoming involved with a new faith. In total, nearly one-in-five adults under age 30 (18%) say they were raised in a religion but are now unaffiliated with any particular faith. Among older age groups, fewer say they are now unaffiliated after having been raised in a faith (13% of those ages 30-49, 12% of those ages 50-64, and 7% of those ages 65 and older). Young people’s lower levels of religious affiliation are reflected in the age composition of major religious groups, with the unaffiliated standing out from other religious groups for their relative youth. Roughly one-third of the unaffiliated population is under age 30 (31%), compared with 20% of the total population. Religious Switching, by Age Switched from… One faith to Affiliated to Unaffiliated to another/switched Have not unaffiliated affiliated within tradition* switched N % % % % Total population 13 4 27 57=100 35,556 Ages 18-29 18 4 20 58=100 4,242 Ages 30+ 11 4 29 56=100 30,453 Ages 30-49 13 4 27 56=100 11,823 Ages 50-64 12 3 30 55=100 10,484 Ages 65+ 7 3 30 60=100 8,146 Source: 2007 U.S. Religious Landscape Survey, Pew Forum on Religion & Public Life *Includes people who have switched faiths within religious traditions such as within Protestantism (e.g., from Baptist to Methodist) and within the unaffiliated (e.g., from atheist to agnostic). Also includes respondents who refused to specify childhood faith but did specify current faith, as well as those who refused to specify current faith but did specify childhood faith. Age Composition of Major Religious Traditions 18-29 30-49 50-64 65+ N % % % % Total Population 20 39 25 16=100 34,695 Protestant 17 38 26 20=100 18,494 Evangelical Churches 17 39 26 19=100 9,281 Mainline Churches 14 36 28 23=100 7,271 Hist. Black Churches 24 36 24 15=100 1,942 Catholic 18 41 24 16=100 7,856 Mormon 24 42 19 15=100 565 Jehovah’s Witness 21 39 25 14=100 207 Orthodox 18 38 27 17=100 358 Jewish 20 29 29 22=100 664 Muslim* 29 48 18 5=100 1,027 Buddhist 23 40 30 7=100 410 Hindu 18 58 19 5=100 250 Unaffiliated 31 40 20 8=100 4,947 Religious Unaffiliated 30 43 20 7=100 1,662 Secular Unaffiliated 29 41 21 8=100 1,965 Atheist 37 36 16 12=100 502 Agnostic 34 34 22 9=100 818 *Source for Muslims is “Muslim Americans: Middle Class and Mostly Mainstream,” Pew Research Center, 2007. All other results from the 2007 U.S. Religious Landscape Survey, Pew Forum on Religion & Public Life. Percentages have been adjusted to exclude nonresponse.
  95. Chapter 9: Religious Beliefs and Behaviors 89 Data from the

    General Social Surveys (GSS), which have been conducted regularly since 1972, confirm that young adults are not just more unaffiliated than their elders today but are also more unaffiliated than young people have been in recent decades. In GSS surveys conducted since 2000, nearly one-quarter of people ages 18- 29 have described their religion as “none.” By comparison, only about half as many young adults were unaffiliated in the 1970s and 1980s. Among Millennials who are affiliated with a religion, however, the intensity of their religious affiliation is as strong today as among previous generations when they were young. More than one-third of religiously affiliated Millennials (37%) say they are a “strong” member of their faith, the same as the 37% of Gen Xers who said this at a similar age and not significantly different than among Baby Boomers when they were young (31%). Intensity of Religious Affiliation, by Generation % saying they are a “strong” member of their religion Source: General Social Surveys. Based on those affiliated with a religion. Question wording: Would you call yourself a strong [INSERT RELIGIOUS PREFERENCE] or a not very strong [INSERT RELIGIOUS PREFERENCE]? Religious Affiliation Among Young Adults, by Decade Among adults ages 18-29 in the… 1970s 1980s 1990s 2000s Unaffiliated % % % % (no religion) 12 12 16 23 Affiliated 88 88 84 77 100 100 100 100 N 2,722 3,434 2,525 2,711 Source: General Social Surveys Question wording: What is your religious preference? Is it Protestant, Catholic, Jewish, some other religion or no religion? Percentages have been adjusted to exclude nonresponse.
  96. Chapter 9: Religious Beliefs and Behaviors 90 Worship Attendance In

    the Pew Forum’s 2007 Religious Landscape Survey, young adults report attending religious services less often than their elders today. One-third of those under age 30 say they attend worship services at least once a week, compared with 41% of adults 30 and older (including more than half of people 65 and older). But generational differences in worship attendance tend to be smaller within religious groups (with the exception of Catholics) than in the total population. In other words, while young people are less likely than their elders to be affiliated with a religion, among those who are affiliated, generational differences in worship attendance are fairly small. Religious Attendance Attend services at least weekly N % Total Population 39 35,556 Ages 18-29 33 4,242 Ages 30+ 41 30,453 Ages 30-49 36 11,823 Ages 50-64 40 10,484 Ages 65+ 53 8,146 Religiously Affiliated 46 30,236 Ages 18-29 43 3,163 Ages 30+ 47 26,360 Unaffiliated 5 5,048 Ages 18-29 5 1,034 Ages 30+ 5 3,913 Evangelical Protestant Churches 58 9,472 Ages 18-29 55 929 Ages 30+ 59 8,352 Mainline Protestant Churches 35 7,470 Ages 18-29 33 528 Ages 30+ 35 6,743 Hist. Black Protestant Churches 59 1,995 Ages 18-29 55 356 Ages 30+ 60 1,586 Catholic 41 8,054 Ages 18-29 34 926 Ages 30+ 43 6,930 Source: 2007 U.S. Religious Landscape Survey, Pew Forum on Religion & Public Life Question wording: Aside from weddings and funerals, how often do you attend religious services...more than once a week, once a week, once or twice a month, a few times a year, seldom, or never?
  97. Chapter 9: Religious Beliefs and Behaviors 91 The long-running GSS

    also finds that young people attend religious services less often than their elders. Furthermore, Millennials currently attend church or worship services at lower rates than Baby Boomers did when they were younger; 18% of Millennials currently report attending religious services weekly or nearly weekly, compared with 26% of Boomers in the late 1970s. But Millennials closely resemble members of Generation X when they were in their 20s and early 30s, when one-in-five Gen Xers (21%) reported attending religious services weekly or nearly weekly. Attendance at Religious Services, by Generation % saying they attend several times a week, every week or nearly every week Source: General Social Surveys. Question wording: How often do you attend religious services? [RESPONSE CATEGORIES, USED AS PROBES AS NECESSARY: Never, less than once a year, about once or twice a year, several times a year, about once a month, two to three times a month, nearly every week, every week, several times a week.]
  98. Chapter 9: Religious Beliefs and Behaviors 92 Other Religious Practices

    Consistent with their lower levels of affiliation, young adults engage in a number of religious practices less often than do older Americans, especially the oldest group in the population (those 65 and older). For example, the 2007 Religious Landscape Survey finds that 27% of young adults say they read Scripture on a weekly basis, compared with 36% of those 30 and older. And one-quarter of adults under 30 say they meditate on a weekly basis (26%), compared with more than four-in- ten adults 30 and older (43%). These patterns hold true across a variety of religious groups. In addition, less than half of adults under age 30 say they pray every day (48%), compared with 56% of Americans ages 30-49, 61% of those in their 50s and early 60s, and more than two-thirds of those 65 and older (68%). Age differences in frequency of prayer are most pronounced among members of historically black Protestant churches (70% of those under age 30 pray every day, compared with 83% among older members) and Catholics (47% of Catholics under 30 pray every day, compared with 60% among older Catholics). The differences are smaller among evangelical and mainline Protestants. Scripture Reading, Prayer and Meditation Read Scripture Pray Meditate weekly daily weekly N % % % Total Population 35 58 39 35,556 Ages 18-29 27 48 26 4,242 Ages 30+ 36 60 43 30,453 Ages 30-49 33 56 35 11,823 Ages 50-64 37 61 46 10,484 Ages 65+ 43 68 56 8,146 Religiously Affiliated 40 65 42 30,236 Ages 18-29 34 58 28 3,163 Ages 30+ 41 66 45 26,360 Unaffiliated 9 22 26 5,048 Ages 18-29 8 18 21 1,034 Ages 30+ 10 24 28 3,913 Evangelical Protestant Churches 60 78 46 9,472 Ages 18-29 51 73 28 929 Ages 30+ 62 79 50 8,352 Mainline Protestant Churches 27 53 35 7,470 Ages 18-29 23 49 18 528 Ages 30+ 28 54 37 6,743 Hist. Black Protestant Churches 60 80 55 1,995 Ages 18-29 45 70 37 356 Ages 30+ 64 83 61 1,586 Catholic 21 58 36 8,054 Ages 18-29 17 47 24 926 Ages 30+ 22 60 39 6,930 Source: 2007 U.S. Religious Landscape Survey, Pew Forum on Religion & Public Life Question wording: Please tell me how often you do each of the following. How often do you [read Scripture outside of religious services/meditate]? Would you say at least once a week, once or twice a month, several times a year, seldom, or never? People practice their religion in different ways. Outside of attending religious services, do you pray several times a day, once a day, a few times a week, once a week, a few times a month, seldom, or never?
  99. Chapter 9: Religious Beliefs and Behaviors 93 Although Millennials report

    praying less often than their elders do today, the GSS shows that Millennials are in sync with Generation X and Baby Boomers when members of those generations were younger. In the 2008 GSS survey, roughly four-in-ten Millennials report praying daily (41%), as did 42% of members of Generation X in the late 1990s. Baby Boomers reported praying at a similar rate in the early 1980s (47%), when the first data are available for them. GSS data show that daily prayer increases as people get older. Daily Prayer, by Generation % saying they pray daily Source: General Social Surveys Question wording: About how often do you pray? [RESPONSE CATEGORIES, USED AS PROBES AS NECESSARY: Several times a day, once a day, several times a week, once a week, less than once a week, never.]
  100. Chapter 9: Religious Beliefs and Behaviors 94 Religious Attitudes and

    Beliefs Less than half of adults under age 30 say that religion is very important in their lives (45%), compared with roughly six-in-ten adults 30 and older (54% among those ages 30-49, 59% among those ages 50-64 and 69% among those ages 65 and older). By this measure, young people exhibit lower levels of religious intensity than their elders do today, and this holds true within a variety of religious groups. Importance of Religion Religion is very important N % Total Population 56 35,556 Ages 18-29 45 4,242 Ages 30+ 59 30,453 Ages 30-49 54 11,823 Ages 50-64 59 10,484 Ages 65+ 69 8,146 Religiously Affiliated 64 30,236 Ages 18-29 57 3,163 Ages 30+ 66 26,360 Unaffiliated 16 5,048 Ages 18-29 12 1,034 Ages 30+ 17 3,913 Evangelical Protestant Churches 79 9,472 Ages 18-29 71 929 Ages 30+ 80 8,352 Mainline Protestant Churches 52 7,470 Ages 18-29 42 528 Ages 30+ 53 6,743 Hist. Black Protestant Churches 85 1,995 Ages 18-29 81 356 Ages 30+ 86 1,586 Catholic 56 8,054 Ages 18-29 45 926 Ages 30+ 58 6,930 Source: 2007 U.S. Religious Landscape Survey, Pew Forum on Religion & Public Life Question wording: How important is religion in your life … very important, somewhat important, not too important, or not at all important?
  101. Chapter 9: Religious Beliefs and Behaviors 95 Gallup surveys conducted

    over the past 30 years that use a similar measure of religion’s importance confirm that religion is somewhat less important for Millennials today than it was for members of Generation X when they were of a similar age. In Gallup surveys in the late 2000s, 40% of Millennials said religion is very important, as did 48% of Gen Xers in the late 1990s. However, young people today look very much like Baby Boomers did at a similar point in their life cycle; in a 1978 Gallup poll, 39% of Boomers said religion was very important to them. Importance of Religion, by Generation % saying religion is very important in their lives Source: Gallup surveys Question wording: How important would you say religion is in your [own] life … [would you say] very important, fairly important, or not very important?
  102. Chapter 9: Religious Beliefs and Behaviors 96 Similarly, young adults

    are less convinced of God’s existence than their elders are today; 64% of young adults say they are absolutely certain of God’s existence, compared with 73% of those ages 30 and older. In this case, differences are most pronounced among Catholics, with younger Catholics being 10 points less likely than older Catholics to believe in God with absolute certainty. In other religious traditions, age differences are smaller. Belief in God Absolutely certain belief in God N % Total Population 71 35,556 Ages 18-29 64 4,242 Ages 30+ 73 30,453 Ages 30-49 71 11,823 Ages 50-64 73 10,484 Ages 65+ 77 8,146 Religiously Affiliated 79 30,236 Ages 18-29 74 3,163 Ages 30+ 80 26,360 Unaffiliated 36 5,048 Ages 18-29 34 1,034 Ages 30+ 37 3,913 Evangelical Protestant Churches 90 9,472 Ages 18-29 86 929 Ages 30+ 91 8,352 Mainline Protestant Churches 73 7,470 Ages 18-29 70 528 Ages 30+ 73 6,743 Hist. Black Protestant Churches 90 1,995 Ages 18-29 88 356 Ages 30+ 91 1,586 Catholic 72 8,054 Ages 18-29 64 926 Ages 30+ 74 6,930 Source: 2007 U.S. Religious Landscape Survey, Pew Forum on Religion & Public Life Question wording: Do you believe in God or a universal spirit? [IF YES, ASK:] How certain are you about this belief? Are you absolutely certain, fairly certain, not too certain, or not at all certain?
  103. Chapter 9: Religious Beliefs and Behaviors 97 But GSS data

    show that Millennials’ level of belief in God resembles that seen among Gen Xers when they were roughly the same age. Just over half of Millennials in the 2008 GSS survey (53%) say they have no doubt that God exists, a figure that is very similar to that among Gen Xers in the late 1990s (55%). Levels of certainty of belief in God have increased somewhat among Gen Xers and Baby Boomers in recent decades. (Data on this item stretch back only to the late 1980s, making it impossible to compare Millennials with Boomers when Boomers were at a similar point in their life cycle.) Certain Belief in God, by Generation % saying they know God exists, with no doubts Source: General Social Surveys Question wording: Please look at this card and tell me which statement comes closest to expressing what you believe about God: I don't believe in God; I don't know whether there is a God and I don't believe there is any way to find out; I don't believe in a personal God, but I do believe in a Higher Power of some kind; I find myself believing in God some of the time but not at others; While I have doubts, I feel that I do believe in God; I know God really exists and I have no doubts about it.
  104. Chapter 9: Religious Beliefs and Behaviors 98 Differences between young

    people and their elders today are also apparent in views of the Bible, although the differences are somewhat less pronounced. Overall, young people are slightly less inclined than those in older age groups to view the Bible as the literal word of God. Interestingly, age differences on this item are most dramatic among young evangelicals and are virtually nonexistent in other groups. Although younger evangelicals are just as likely as older evangelicals (and more likely than people in most other religious groups) to see the Bible as the word of God, they are less likely than older evangelicals to see it as the literal word of God. Less than half of young evangelicals interpret the Bible literally (47%), compared with 61% of evangelicals 30 and older. Views of Scripture Scripture is word of God Not word of NET word Literal, word Not God / Other / of God for word literal Don’t know N % % % % Total Population 63 33 30 37=100 35,556 Ages 18-29 59 28 31 41=100 4,242 Ages 30+ 64 34 30 36=100 30,453 Ages 30-49 63 32 30 37=100 11,823 Ages 50-64 62 33 29 38=100 10,484 Ages 65+ 70 39 31 30=100 8,146 Religiously Affiliated 71 37 34 29=100 30,236 Ages 18-29 71 35 37 29=100 3,163 Ages 30+ 71 38 33 29=100 26,360 Unaffiliated 25 11 14 75=100 5,048 Ages 18-29 26 11 15 74=100 1,034 Ages 30+ 25 11 14 75=100 3,913 Evangelical Protestant Churches 88 59 29 12=100 9,472 Ages 18-29 88 47 41 12=100 929 Ages 30+ 88 61 27 12=100 8,352 Mainline Protestant Churches 61 22 38 39=100 7,470 Ages 18-29 60 21 39 40=100 528 Ages 30+ 61 23 39 39=100 6,743 Hist. Black Protestant Churches 84 62 22 16=100 1,995 Ages 18-29 83 59 24 17=100 356 Ages 30+ 84 63 21 16=100 1,586 Catholic 62 23 39 38=100 8,054 Ages 18-29 62 25 36 38=100 926 Ages 30+ 62 22 40 38=100 6,930 Source: 2007 U.S. Religious Landscape Survey, Pew Forum on Religion & Public Life Question wording: Which comes closest to your view? [HOLY BOOK*] is the word of God, or [HOLY BOOK] is a book written by men and is not the word of God? [IF WORD OF GOD, ASK:] And would you say that [HOLY BOOK] is to be taken literally, word for word, OR not everything in [HOLY BOOK] should be taken literally, word for word? *For Christians and the unaffiliated, "the Bible" was inserted for HOLY BOOK; for Jews, "the Torah" was inserted; for Muslims, "the Koran" was inserted; for members of other faiths, "the holy scripture" was inserted.
  105. Chapter 9: Religious Beliefs and Behaviors 99 On this measure,

    too, Millennials display beliefs that closely resemble those of Generation X in the late 1990s. In the 2008 GSS survey, roughly a quarter of Millennials (27%) said the Bible is the literal word of God, compared with 28% among Gen Xers when they were young. This is only slightly lower than among Baby Boomers in the early 1980s (33%) and is very similar to the 29% of Boomers in the late 1980s who said they viewed the Bible as the literal word of God. Views of the Bible, by Generation % saying Bible is actual, literal word of God Source: General Social Surveys Question wording: Which of these statements comes closest to describing your feelings about the Bible? a. The Bible is the actual word of God and is to be taken literally, word for word; b. The Bible is the inspired word of God but not everything in it should be taken literally, word for word; c. The Bible is an ancient book of fables, legends, history, and moral precepts recorded by men.
  106. Chapter 9: Religious Beliefs and Behaviors 100 On still other

    measures of religious belief, there are few differences in the beliefs of young people compared with their elders today. Adults under 30, for instance, are just as likely as older adults to believe in life after death (75% vs. 74%), heaven (74% each), hell (62% vs. 59%) and miracles (78% vs. 79%). In fact, on several of these items, young mainline Protestants and members of historically black Protestant churches exhibit somewhat higher levels of belief than their elders. Beliefs about Afterlife, Miracles, and Angels and Demons Believe in… Life after Angels and death Heaven Hell Miracles demons N % % % % % Total Population 74 74 59 79 68 35,556 Ages 18-29 75 74 62 78 67 4,242 Ages 30+ 74 74 59 79 69 30,453 Ages 30-49 74 75 61 79 71 11,823 Ages 50-64 75 72 58 80 69 10,484 Ages 65+ 71 74 57 76 62 8,146 Religiously Affiliated 79 81 65 83 74 30,236 Ages 18-29 82 84 72 85 76 3,163 Ages 30+ 79 80 64 83 74 26,360 Unaffiliated 48 41 30 55 40 5,048 Ages 18-29 54 46 34 58 42 1,034 Ages 30+ 45 39 28 53 40 3,913 Evangelical Protestant Churches 86 86 82 88 87 9,472 Ages 18-29 86 89 85 87 85 929 Ages 30+ 86 86 81 89 87 8,352 Mainline Protestant Churches 78 77 56 81 65 7,470 Ages 18-29 86 85 70 84 68 528 Ages 30+ 77 77 54 81 65 6,743 Hist. Black Protestant Churches 79 91 82 88 87 1,995 Ages 18-29 84 94 88 93 92 356 Ages 30+ 77 90 80 87 86 1,586 Catholic 77 82 60 83 69 8,054 Ages 18-29 78 82 63 85 70 926 Ages 30+ 77 82 59 83 69 6,930 Source: 2007 U.S. Religious Landscape Survey, Pew Forum on Religion & Public Life Question wording: Do you believe in life after death? Do you think there is a heaven, where people who have led good lives are eternally rewarded? Do you think there is a hell, where people who have led bad lives and die without being sorry are eternally punished? Here are a few statements. For each one, please tell me if you completely agree with it, mostly agree with it, mostly disagree with it, or completely disagree with it. The first/next one is [miracles still occur today as in ancient times/angels and demons are active in the world].
  107. Chapter 9: Religious Beliefs and Behaviors 101 Young people who

    are affiliated with a religion are more inclined than their elders to believe their own religion is the one true path to eternal life (though in all age groups, more people say many religions can lead to eternal life than say theirs is the one true faith). Nearly three-in-ten religiously affiliated adults under age 30 (29%) say their own religion is the one true faith leading to eternal life, higher than the 23% of religiously affiliated people ages 30 and older who say the same. This pattern is evident among all three Protestant groups but not among Catholics. Interestingly, while more young Americans than older Americans view their faith as the single path to salvation, young adults are also more open to multiple ways of interpreting their religion. Nearly three-quarters of affiliated young adults (74%) say there is more than one true way to interpret the teachings of their faith, compared with 67% of affiliated adults ages 30 and older. Obtaining Eternal Life, Interpreting Religious Teachings Own religion is Many Only one one true faith religions true way to More than that leads to can lead to interpret one true eternal life eternal life own religion way N % % % % Total Affiliated 24 70 27 68 30,236 Ages 18-29 29 66 23 74 3,163 Ages 30+ 23 71 28 67 26,360 Ages 30-49 24 71 26 70 9,882 Ages 50-64 20 73 28 68 9,062 Ages 65+ 24 68 33 59 7,416 Evangelical Protestant Churches 36 57 41 53 9,472 Ages 18-29 43 52 33 64 929 Ages 30+ 35 58 43 51 8,352 Mainline Protestant Churches 12 83 14 82 7,470 Ages 18-29 18 79 11 87 528 Ages 30+ 11 84 15 81 6,743 Hist. Black Protestant Churches 34 59 39 57 1,995 Ages 18-29 39 55 34 63 356 Ages 30+ 33 61 40 55 1,586 Catholic 16 79 19 77 8,054 Ages 18-29 17 78 15 82 926 Ages 30+ 15 79 20 76 6,930 Results based on those affiliated with a religion. Source: 2007 U.S. Religious Landscape Survey, Pew Forum on Religion & Public Life Question wording: Now, as I read a pair of statements, tell me whether the FIRST statement or the SECOND statement comes closer to your own views even if neither is exactly right. First/next ...My religion is the one true faith leading to eternal life, OR Many religions can lead to eternal life. There is only ONE true way to interpret the teachings of my religion, OR There is MORE than one true way to interpret the teachings of my religion.
  108. Chapter 9: Religious Beliefs and Behaviors 102 Social and Culture

    War Issues Young people are more accepting of homosexuality and evolution than are older people. They are also more comfortable with having a bigger government, and they are less concerned about Hollywood threatening their values. But when asked generally about morality and religion, young adults are just as convinced as older people that there are absolute standards of right and wrong that apply to everyone. Young adults are also slightly more supportive of government efforts to protect morality and of efforts by houses of worship to express their social and political views. According to the 2007 Religious Landscape Survey, almost twice as many young adults say homosexuality should be accepted by society as do those ages 65 and older (63% vs. 35%). Young people are also considerably more likely than those ages 30-49 (51%) or 50-64 (48%) to say that homosexuality should be accepted. Stark age differences also exist within each of the major religious traditions examined. Compared with older members of their faith, significantly larger proportions of young adults say society should accept homosexuality. Views of Homosexuality Homosexuality should be accepted by society N % Total Population 50 35,556 Ages 18-29 63 4,242 Ages 30+ 47 30,453 Ages 30-49 51 11,823 Ages 50-64 48 10,484 Ages 65+ 35 8,146 Religiously Affiliated 46 30,236 Ages 18-29 58 3,163 Ages 30+ 43 26,360 Unaffiliated 71 5,048 Ages 18-29 79 1,034 Ages 30+ 67 3,913 Evangelical Protestant Churches 26 9,472 Ages 18-29 39 929 Ages 30+ 24 8,352 Mainline Protestant Churches 56 7,470 Ages 18-29 69 528 Ages 30+ 54 6,743 Hist. Black Protestant Churches 39 1,995 Ages 18-29 51 356 Ages 30+ 36 1,586 Catholic 58 8,054 Ages 18-29 72 926 Ages 30+ 55 6,930 Source: 2007 U.S. Religious Landscape Survey, Pew Forum on Religion & Public Life Question wording: Now I’m going to read you a few pairs of statements. For each pair, tell me whether the FIRST statement or the SECOND statement comes closer to your own views — even if neither is exactly right: Homosexuality is a way of life that should be accepted by society, OR homosexuality is a way of life that should be discouraged by society.
  109. Chapter 9: Religious Beliefs and Behaviors 103 In the 2008

    GSS survey, just over four- in-ten (43%) Millennials said homosexual relations are always wrong, similar to the 47% of Gen Xers who said the same in the late 1990s. These two cohorts are significantly less likely than members of previous generations have ever been to say that homosexuality is always wrong. The views of the various generations on this question have fluctuated over time, often in tandem. Views of Homosexuality, by Generation % saying same-sex sexual relations are always wrong Source: General Social Surveys Question wording: What about sexual relations between two adults of the same sex … do you think it is always wrong, almost always wrong, wrong only sometimes, or not wrong at all?
  110. Chapter 9: Religious Beliefs and Behaviors 104 Roughly half of

    young adults (52%) say abortion should be legal in all or most cases. On this issue, young adults express slightly more permissive views than do adults ages 30 and older. However, the group that truly stands out on this issue is people 65 and older, just 37% of whom say abortion should be legal in most or all cases. Interestingly, this pattern represents a significant change from earlier polling. Previously, people in the middle age categories (i.e., those ages 30-49 and 50-64) tended to be more supportive of legal abortion, while the youngest and oldest age groups were more opposed. In 2009, however, attitudes toward abortion moved in a more conservative direction among most groups in the population, with the notable exception of young people. The result of this conservative turn among those in the 30-49 and 50-64 age brackets means that their views now more closely resemble those of the youngest age group, while those in the 65-and- older group now express the most conservative views on abortion of any age group. Views on Abortion Abortion should be… Legal in all/ Illegal in all/ Don’t most cases most cases know N % % % Total Population 47 44 9=100 5,534 Ages 18-29 52 44 5=100 761 Ages 30+ 46 45 10=100 4,679 Ages 30-49 48 44 8=100 1,627 Ages 50-64 48 42 10=100 1,664 Ages 65+ 37 51 12=100 1,388 Religiously Affiliated 42 49 9=100 4,648 Ages 18-29 45 50 5=100 541 Ages 30+ 42 49 10=100 4,039 Unaffiliated 68 25 7=100 807 Ages 18-29 67 28 5=100 210 Ages 30+ 69 23 8=100 582 White Evangelical Protestant 23 71 6=100 1,266 Ages 18-29 Sample size too small for analysis Ages 30+ 23 70 6=100 1,162 White Mainline Protestant 55 34 11=100 1,116 Ages 18-29 55 37 8=100 115 Ages 30+ 56 34 11=100 980 Catholic 45 45 10=100 1,199 Ages 18-29 45 51 4=100 156 Ages 30+ 44 44 11=100 1,025 Source: Aggregated Pew Research Center surveys, 2009 Question wording: Do you think abortion should be legal in all cases, legal in most cases, illegal in most cases or illegal in all cases? [Response categories read in reverse order for half of sample] Note: Most of the analyses in this report compare responses among Protestant groups as defined by denominational affiliation. In this table, however, Protestants are categorized as "white evangelicals" or "white mainline Protestants" on the basis of their race and their responses to a question asking if they think of themselves as "born-again or evangelical" Christians.
  111. Chapter 9: Religious Beliefs and Behaviors 105 Surveys also show

    that large numbers of young adults (67%) say they would prefer a bigger government that provides more services over a smaller government that provides fewer services. Among older Americans, only 41% feel this way. Fewer young people than older people see their moral values as under assault from Hollywood; one-third of adults under age 30 agree that Hollywood and the entertainment industry threatens their values, compared with 44% of people 30 and older. And more than half of young adults (55%) believe that evolution is the best explanation for the development of human life, compared with 47% of people in older age groups. These patterns are seen both in the total population and within a variety of religious traditions, though the link between age and views on evolution is strongest among Catholics and members of historically black Protestant churches. Evolution, Hollywood and Size of Government Evolution best Agree Prefer bigger explanation for Hollywood government, human life threatens values more services N % % % Total Population 48 42 46 35,556 Ages 18-29 55 33 67 4,242 Ages 30+ 47 44 41 30,453 Ages 30-49 49 41 48 11,823 Ages 50-64 47 46 39 10,484 Ages 65+ 40 48 31 8,146 Religiously Affiliated 44 45 46 30,236 Ages 18-29 49 36 68 3,163 Ages 30+ 43 47 41 26,360 Unaffiliated 72 28 48 5,048 Ages 18-29 73 25 64 1,034 Ages 30+ 71 29 41 3,913 Evangelical Protestant Churches 24 53 41 9,472 Ages 18-29 27 42 65 929 Ages 30+ 23 55 36 8,352 Mainline Protestant Churches 51 41 37 7,470 Ages 18-29 52 32 62 528 Ages 30+ 50 42 33 6,743 Hist. Black Protestant Churches 38 35 72 1,995 Ages 18-29 47 29 81 356 Ages 30+ 36 36 69 1,586 Catholic 58 43 51 8,054 Ages 18-29 68 35 73 926 Ages 30+ 56 45 46 6,930 Source: 2007 U.S. Religious Landscape Survey, Pew Forum on Religion & Public Life Question wording: Now, as I read some statements on a few different topics, please tell me if you completely agree, mostly agree, mostly DISagree or completely disagree with each one. [Evolution is the best explanation for the origins of human life on earth / I often feel that my values are threatened by Hollywood and the entertainment industry] If you had to choose, would you rather have a smaller government providing fewer services, or a bigger government providing more services?
  112. Chapter 9: Religious Beliefs and Behaviors 106 But differences between

    young adults and their elders are not so stark on all moral and social issues. For instance, more than three- quarters of young adults (76%) agree that there are absolute standards of right and wrong, a level nearly identical to that among older age groups (77%). More than half of young adults (55%) say that houses of worship should speak out on social and political matters, slightly more than say this among older adults (49%). And 45% of young adults say that the government should do more to protect morality in society, compared with 39% of people ages 30 and older. Morality, Religion and Government Agree there are Government Houses of worship absolute standards should do should express of right and more to protect views on social and wrong morality political issues N % % % Total Population 77 40 50 35,556 Ages 18-29 76 45 55 4,242 Ages 30+ 77 39 49 30,453 Ages 30-49 77 41 52 11,823 Ages 50-64 77 35 47 10,484 Ages 65+ 78 39 42 8,146 Religiously Affiliated 79 43 53 30,236 Ages 18-29 80 50 61 3,163 Ages 30+ 79 41 51 26,360 Unaffiliated 67 27 34 5,048 Ages 18-29 67 32 39 1,034 Ages 30+ 67 24 32 3,913 Evangelical Protestant Churches 85 50 64 9,472 Ages 18-29 85 54 72 929 Ages 30+ 85 49 62 8,352 Mainline Protestant Churches 77 33 46 7,470 Ages 18-29 78 46 50 528 Ages 30+ 77 31 45 6,743 Hist. Black Protestant Churches 78 48 69 1,995 Ages 18-29 83 52 77 356 Ages 30+ 77 47 66 1,586 Catholic 79 43 48 8,054 Ages 18-29 77 48 56 926 Ages 30+ 79 41 46 6,930 Source: 2007 U.S. Religious Landscape Survey, Pew Forum on Religion & Public Life Question wording: Now, as I read some statements on a few different topics, please tell me if you completely agree, mostly agree, mostly DISagree or completely disagree with each one: There are clear and absolute standards for what is right and wrong. Now I’m going to read you a few pairs of statements. For each pair, tell me whether the FIRST statement or the SECOND statement comes closer to your own views — even if neither is exactly right: The government should do more to protect morality in society, OR I worry the government is getting too involved in the issue of morality. In your opinion, should churches and other houses of worship keep out of political matters, or should they express their views on day-to-day social and political questions?
  113. Chapter 9: Religious Beliefs and Behaviors 107 GSS surveys show

    Millennials are more permissive than their elders are today in their views about pornography, but their views are nearly identical to those expressed by Gen Xers and Baby Boomers when members of those generations were at a similar point in their life cycles. About one-in-five Millennials today say pornography should be illegal for everyone (21%), similar to the 24% of Gen Xers who said this in the late 1990s and the 22% of Boomers who took this view in the late 1970s. Data for the Silent and Greatest generations at similar ages are not available, but data from the 1970s onward suggest that people become more opposed to pornography as they age. Views on Pornography, by Generation % saying pornography should be illegal for people of all ages Source: General Social Surveys Question wording: Which of these statements comes closest to your feelings about pornography laws? There should be laws against the distribution of pornography whatever the age, OR there should be laws against the distribution of pornography to persons under 18, OR there should be no laws forbidding the distribution of pornography.
  114. Chapter 9: Religious Beliefs and Behaviors 108 Similarly, Millennials at

    the present time stand out from other generations for their opposition to Bible reading and prayer in schools, but they are less distinctive when compared with members of Generation X or Baby Boomers at a comparable age. During early adulthood, about half of Boomers (51%) and Gen Xers (54%) said they approved of U.S. Supreme Court rulings that banned the required reading of the Lord’s Prayer or Bible verses in public schools; 56% of Millennials took this view in 2008. Generation X and the Boomer generation have become less supportive of the court’s position over time, while the pattern in the views of the Silent and Greatest generations has been less clear. Opposition to Bible Reading, Lord’s Prayer in Schools % saying they approve of Supreme Court ruling banning required reading of Lord’s Prayer or Bible verses in public schools Source: General Social Surveys Question wording: The United States Supreme Court has ruled that no state or local government may require the reading of the Lord's Prayer or Bible verses in public schools. What are your views on this - do you approve or disapprove of the court ruling?.
  115. Chapter 9: Religious Beliefs and Behaviors 109 Selected Religious Beliefs

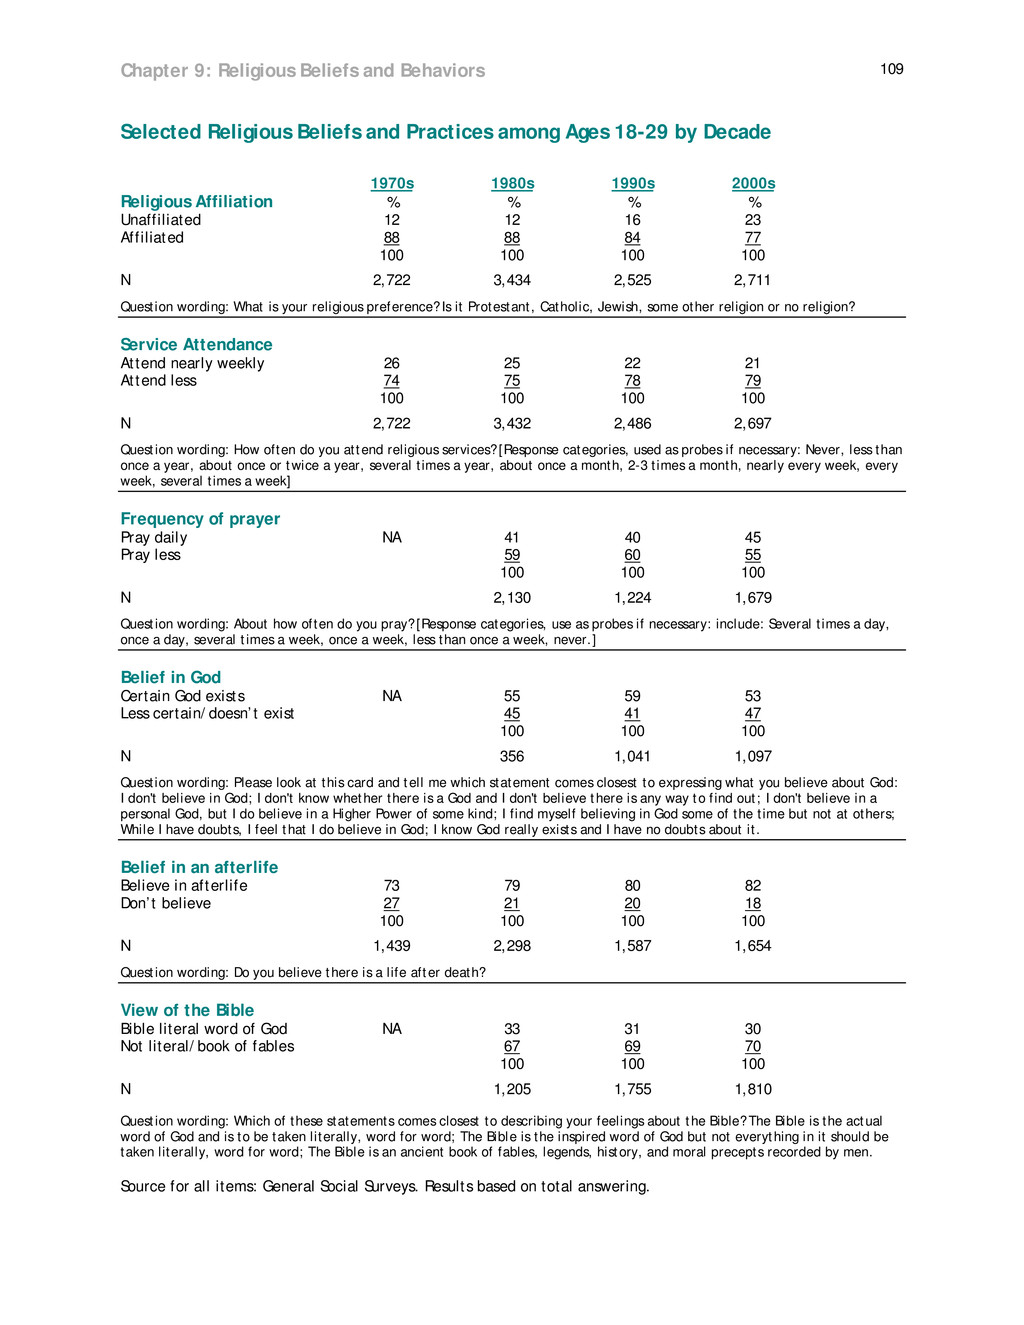
    and Practices among Ages 18-29 by Decade 1970s 1980s 1990s 2000s Religious Affiliation % % % % Unaffiliated 12 12 16 23 Affiliated 88 88 84 77 100 100 100 100 N 2,722 3,434 2,525 2,711 Question wording: What is your religious preference? Is it Protestant, Catholic, Jewish, some other religion or no religion? Service Attendance Attend nearly weekly 26 25 22 21 Attend less 74 75 78 79 100 100 100 100 N 2,722 3,432 2,486 2,697 Question wording: How often do you attend religious services? [Response categories, used as probes if necessary: Never, less than once a year, about once or twice a year, several times a year, about once a month, 2-3 times a month, nearly every week, every week, several times a week] Frequency of prayer Pray daily NA 41 40 45 Pray less 59 60 55 100 100 100 N 2,130 1,224 1,679 Question wording: About how often do you pray? [Response categories, use as probes if necessary: include: Several times a day, once a day, several times a week, once a week, less than once a week, never.] Belief in God Certain God exists NA 55 59 53 Less certain/doesn’t exist 45 41 47 100 100 100 N 356 1,041 1,097 Question wording: Please look at this card and tell me which statement comes closest to expressing what you believe about God: I don't believe in God; I don't know whether there is a God and I don't believe there is any way to find out; I don't believe in a personal God, but I do believe in a Higher Power of some kind; I find myself believing in God some of the time but not at others; While I have doubts, I feel that I do believe in God; I know God really exists and I have no doubts about it. Belief in an afterlife Believe in afterlife 73 79 80 82 Don’t believe 27 21 20 18 100 100 100 100 N 1,439 2,298 1,587 1,654 Question wording: Do you believe there is a life after death? View of the Bible Bible literal word of God NA 33 31 30 Not literal/book of fables 67 69 70 100 100 100 N 1,205 1,755 1,810 Question wording: Which of these statements comes closest to describing your feelings about the Bible? The Bible is the actual word of God and is to be taken literally, word for word; The Bible is the inspired word of God but not everything in it should be taken literally, word for word; The Bible is an ancient book of fables, legends, history, and moral precepts recorded by men. Source for all items: General Social Surveys. Results based on total answering.
  116. Appendix 1: Survey Methodology 110 ABOUT THE DATA IN THIS

    REPORT Results for the January 2010 Millennial Survey are based on telephone interviews conducted under the direction of Abt SRBI Inc. among a national sample of 2,020 adults living in the continental United States, 18 years of age and older, from Jan. 14 to 27, 2010 (851 respondents were interviewed on a landline telephone, and 1,169 were interviewed on a cell phone, including 538 who had no landline telephone). Both the landline and cell phone samples were provided by Survey Sampling International. Interviews were conducted in English and Spanish. Five separate samples were used for data collection to obtain a representative sample that included an oversample of 18- to 29-year-olds. The first sample was a list-assisted random digit dial (RDD) landline sample. A total of 739 interviews were completed using this RDD landline sample. The sample design also included a RDD cellular sample. A total of 744 interviews were completed using this RDD cellular sample. In addition, a RDD cellular sample was used to screen an oversample of 18- to 29-year-olds; 181 interviews with 18- to 29- year-olds were completed using this additional RDD cellular sample. These interviews were supplemented with two callback samples (landline and cellular) to obtain additional interviews with 18- to 29-year-olds. Callback samples came from recent national Abt SRBI Inc. surveys and Pew Research Center surveys in which respondents said they were between the ages of 18 and 29. An additional 112 interviews were completed by calling back landline sample and 244 interviews were completed by calling back cellular sample. A total of 830 18- to 29-year-olds were interviewed across the five samples. Number of Interviews by Sample Source New RDD Callback Total Landline 739 112 851 Cellular (incl. 18-29 oversample) 925 244 1169 Total 1664 356 2020 As many as seven attempts were made to contact every sampled telephone number. Calls were staggered over times of day and days of the week to maximize the chance of making contact with potential respondents. Each phone number received at least one daytime call in an attempt to find someone at home. The introduction and screening procedures differed depending on the sample. For each contacted household in the main RDD landline sample, interviewers asked, based on a random rotation, to speak with either the youngest male or female adult currently at home. If no male/female was available at the time of the call, interviewers asked to speak with the youngest adult of the other sex. This systematic respondent selection technique has been shown to produce samples that closely mirror the population in terms of age and gender when combined with a cellular sample. For the RDD cellular sample, interviews were conducted with the person who answered the phone once it was confirmed that he or she was 18 years of age or older and was in a safe place to talk. For the oversample from the RDD cellular sample, interviews were conducted with the
  117. Appendix 1: Survey Methodology 111 person who answered the phone

    once it was confirmed that he or she was between the ages of 18 to 29 and was in a safe place to talk. For the landline callback sample, interviewers asked to speak with the person based on age and gender who participated in a survey earlier in the year. For the cellular callback sample, interviews were conducted with the person who answered the phone once it was confirmed that he or she was an adult and was in a safe place to talk. For both the landline and callback samples, interviews confirmed that respondents were still between the ages of 18 and 29. Weighting is generally used in survey analysis to adjust for effects of the sample design and to compensate for patterns of nonresponse that might bias results. The weighting was accomplished in multiple stages to account for the different sample frames as well as the oversampling of certain groups. Weighting also balances sample demographic distributions to match known population parameters. The first stage of weighting accounted for the disproportionately stratified RDD sample design of the main landline sample and also included a probability-of-selection adjustment for the RDD landline sample to correct for the fact that respondents in the landline sample have different probabilities of being sampled depending on how many adults live in the household (e.g., people who live with no other adults have a greater chance of being selected than those who live in multiple-adult households). Lastly, the first stage of weighting also accounted for the overlap in the landline and cellular RDD frames. In the second weighting stage, the demographic composition of each age group (18- to 29-year-olds, 30 and older) was raked to match national parameters for gender, age, education, race/ethnicity and region using parameters from the Census Bureau’s March 2009 Current Population Survey (CPS). In addition, each age group was weighted to match national parameters for telephone status (cell phone only vs. not), based on extrapolations from the 2008 National Health Interview Survey. After each of the two age groups was weighted to its population parameters, the total sample was weighted to match national parameters for age (from the 2009 CPS) and population density (from the 2000 Census). The second stage of weighting incorporated each respondent’s first stage weight and simultaneously balanced the distributions of all weighting parameters. Sampling errors and statistical tests of significance take into account the effect of weighting. The survey’s margin of error is the largest 95% confidence interval for any estimated proportion based on the total sample— the one around 50%. For example, the margin of error for the entire sample is approximately ±3.0%. This means that in 95 out every 100 samples drawn using the same methods, estimated proportions based on the entire sample will be no more than 3.0 percentage points different from their true values in the population. The margins of error for the total sample and the four age groups used in this report are reported below.
  118. Appendix 1: Survey Methodology 112 Total Sample and Subgroup Margins

    of Sampling Error N Approximate Margin of Error Total Sample 2,020 ± 3.0 percentage points Millennial (18-29) 830 ± 4.0 percentage points Gen X (30-45) 351 ± 6.0 percentage points Baby Boomer (46-64) 487 ± 5.0 percentage points Silent (65 and older) 319 ± 6.5 percentage points It is important to remember that sampling fluctuations are only one possible source of error in a survey estimate. Other sources, such as respondent selection bias, questionnaire wording and reporting inaccuracy, may contribute additional error of greater or lesser magnitude. Other data in the report are drawn from surveys conducted over the years by the projects of the Pew Research Center as well as by other organizations, as noted in the text, charts and footnotes. Data sources for the cohort analyses in Chapter 8 (Politics, Ideology and Civic Engagement) and Chapter 9 (Religious Beliefs and Behaviors) are described in detail in those chapters.
  119. Appendix 2: Topline Questionnaire 113 PEW SOCIAL & DEMOGRAPHIC TRENDS

    JANUARY 2010 MILLENNIAL SURVEY FINAL TOPLINE JANUARY14-27, 2010 TOTAL N=2,020, AGES18-29 N=830 NOTE: ALL NUMBERS ARE PERCENTAGES. THE PERCENTAGES LESS THAN .5 % (INCLUDING ZERO) ARE REPLACED BY AN ASTERISK (*). COLUMNS/ROWS MAY NOT TOTAL 100% DUE TO ROUNDING. ALL TRENDS REFERENCE SURVEYS FROM SOCIAL & DEMOGRAPHIC TRENDS AND THE PEW RESEARCH CENTER FOR THE PEOPLE & THE PRESS UNLESS OTHERWISE NOTED. PERCENTAGES FOR SUB-GROUPS ARE NOT REPORTED WHEN N IS LESS THAN 100. ASK ALL: Q.1 Generally, how would you say things are these days in your life -- would you say that you are very happy, pretty happy, or not too happy? Millennial Gen X Boomers Silent Total 18-29 30-45 46-64 65+ 28 31 27 29 27 Very happy 54 56 56 54 50 Pretty happy 16 12 16 16 20 Not too happy 2 1 1 2 11 Don’t know/Refused (VOL) (n=830) (n=351) (n=487) (n=319) RANDOMIZE Q.2 AND Q.3 ASK ALL: Q.2 All in all, are you satisfied or dissatisfied with the way things are going in this country today? Total 18-29 30-45 46-64 65+ 29 41 36 23 14 Satisfied 65 55 57 71 78 Dissatisfied 6 4 7 6 8 Don’t know/Refused (VOL) Q.3 All in all, are you satisfied or dissatisfied with the way things are going in your local community today? Total 18-29 30-45 46-64 65+ 69 69 73 67 66 Satisfied 26 27 23 29 25 Dissatisfied 5 4 5 4 9 Don’t know/Refused (VOL) ASK ALL: Q.4 Generally speaking, would you say that most people can be trusted or that you can’t be too careful in dealing with people? Total 18-29 30-45 46-64 65+ 31 28 31 34 29 Most people can be trusted 64 67 64 61 65 Can’t be too careful 4 4 5 4 4 Other/Depends (VOL) 1 * * 1 1 Don’t know/Refused (VOL)
  120. Appendix 2: Topline Questionnaire 114 Trends (selected years): Most people

    can be trusted Can’t be too careful Other/ Depends DK/Ref (VOL) Total Jan 2010 31 64 4 1 Oct 2006 45 50 4 1 Feb 1997 45 52 2 1 18-29 Jan 2010 28 67 4 * Oct 2006 36 60 4 1 Feb 1997 35 63 1 1 30+ Jan 2010 32 63 4 1 Oct 2006 47 48 4 1 Feb 1997 48 49 3 1 NO QUESTION 5 ASK ALL: Now I would like to ask you about the people of your generation… Q.6 Do you think of your own age group as unique and distinct from other generations, or not? Total 18-29 30-45 46-64 65+ 57 61 49 58 66 Yes, unique and distinct 39 37 47 40 28 No, not 3 2 3 2 7 Don’t know/Refused (VOL) Trend: Sep 200634 18-25 18-25 63 Yes, unique and distinct 68 34 No, not 31 3 Don’t know/Refused (VOL) 1 34 The 2006 survey only asked this question of 18-25 year olds.
  121. Appendix 2: Topline Questionnaire 115 ASK IF YES (Q.6=1) [n=1,205]:

    Q.7 Can you tell me some ways in which your generation is unique or distinct? [OPEN-ENDED; RECORD VERBATIM RESPONSE. PROBE ONCE IF RESPONDENT ANSWERS “DON’T KNOW”; ACCEPT UP TO THREE RESPONSES] BASED ON ALL MENTIONS: 2 Expressive/Outspoken/Outgoing/Bold 4 2 0 0 1 Creative/Innovative/Artistic 2 1 1 1 1 Lazy/Not hard-working 3 1 * 1 1 Independent 2 1 1 * 1 More environmentally aware * 1 2 0 4 Other different values/traits/attitudes mentions 5 4 4 5 13 (NET) Different Use of Modern Technology 27 15 6 5 10 Technology use 24 12 3 2 2 Communication 4 0 1 2 2 Other different use of technology mentions 1 3 3 2 12 (NET) Different Behaviors and Lifestyles 17 15 8 9 5 Music/Pop culture/Style/Lifestyle/Trend setters 11 3 4 2 2 Clothes/the way we dress 5 2 1 0 1 Different outlook on jobs/careers 1 2 1 1 1 More violence/drugs/crime 1 * * 1 1 More opportunity/More choice 1 1 * 1 4 Other different behaviors and lifestyles mentions 4 6 3 5 9 (NET) Different Historical Experiences 2 4 14 18 4 Seen many changes/Lived through hard times(WWII, Depression) 1 1 3 14 2 Lived through the sixties/Vietnam Era/Hippies/Flower children 0 1 5 2 2 Baby Boomers 0 * 6 1 2 Other historical experiences mentions 1 2 2 2 8 (NET) General 8 7 6 11 3 Just different 4 2 2 2 1 Better/Stronger * 0 * 4 All 18-29 30-45 46-64 65+ 56 (NET) Different Values/Traits/Attitudes 47 47 63 66 11 Work ethic/Hardworking/Motivated 5 11 17 10 8 Respectful 2 5 14 8 7 Smarter/More well-educated/Wiser 6 6 5 13 5 Values/Morals/Religious beliefs 1 2 8 10 4 Conservative/Old-fashioned/Traditional 1 7 4 5 4 Trustworthy/Honest/Honorable 1 1 3 12 3 Caring/Giving/Helpful/Compassionate 1 3 5 5 3 Liberal/Open to change/Open- minded/Tolerant/Progressive 7 3 2 1 3 Responsible/Reliable 1 3 5 2 2 Laid back/Relaxed/Carefree/Down to earth 1 3 2 2 2 More rebellious/ disobedient/ unruly/ disrespectful 3 1 2 1 2 General attitude/the way we act/think/do things 5 2 * 1 2 Thrifty/Careful with money * 1 1 5 2 Politically active/Civically engaged 2 1 2 2 2 Selfish/Spoiled/Self-centered 2 1 2 1
  122. Appendix 2: Topline Questionnaire 116 4 Other general miscellaneous mentions

    4 5 4 4 3 Family dynamics/Family-oriented/Different approach to families 2 3 5 3 1 Other different demographics mentions 2 1 * 1 2 Don’t know/Refused 1 0 3 3 ASK ALL: Thinking about the government, Q.7a Which comes closer to your view, even if neither is exactly right? [READ AND RANDOMIZE]? Total 18-29 30-45 46-64 65+ 45 53 45 43 39 Government should do more to solve problems [OR] 47 42 47 50 47 Government is doing too many things better left to businesses and individuals 8 6 8 7 14 Don’t know/Refused (VOL) Trend for comparison (among 2008 voters): Government should do more to solve problems Government is doing too many things better left to businesses and individuals DK/Ref (VOL) Total Jan 2010 43 51 6 Nov 2008 NEP exit poll 50 44 6 18-29 Jan 2010 50 45 5 Nov 2008 NEP exit poll 69 27 4 ASK ALL: Q.8 Here are some goals that people value in their lives. Some people say these things are very important to them. Others say they are not so important. Please tell me how important each is to you personally. First [INSERT FIRST ITEM; RANDOMIZE], is that one of the most important things in your life, very important but not the most, somewhat important, or not important? How about [INSERT NEXT ITEM]? [REPEAT AS NECESSARY “is that one of the most important things in your life, very important but not the most, somewhat important, or not important?”] a. Being successful in a high-paying career or profession Washington Post / Kaiser /Harvard Aug 1997 Total 18-29 30-45 46-64 65+ Total 18-29 9 15 10 4 5 One of the most important things 9 13 36 47 40 28 28 Very important but not the most 32 45 34 27 33 41 32 Somewhat important 39 31 21 10 17 25 32 Not important 20 10 1 * 0 1 3 Don’t know/Refused (VOL) * 0
  123. Appendix 2: Topline Questionnaire 117 Q.8 CONTINUED…. b. Having a

    successful marriage Washington Post / Kaiser /Harvard Aug 1997 Total 18-29 30-45 46-64 65+ Total 18-29 34 30 36 34 34 One of the most important things 31 35 51 52 49 49 53 Very important but not the most 55 51 8 12 9 7 4 Somewhat important 7 7 6 6 5 7 7 Not important 7 7 2 * 1 3 2 Don’t know/Refused (VOL) 1 1 c. Living a very religious life Washington Post / Kaiser /Harvard Aug 1997 Total 18-29 30-45 46-64 65+ Total 18-29 20 15 19 21 24 One of the most important things 15 14 35 28 34 38 44 Very important but not the most 37 28 25 30 26 23 19 Somewhat important 30 35 19 26 20 17 10 Not important 18 23 1 1 2 1 2 Don’t know/Refused (VOL) * * d. Being a good parent Washington Post / Kaiser /Harvard Aug 1997 Total 18-29 30-45 46-64 65+ Total 18-29 50 52 51 50 48 One of the most important things 41 42 44 43 42 45 43 Very important but not the most 54 52 2 2 3 1 3 Somewhat important 2 3 3 3 4 2 2 Not important 2 2 1 * * 1 4 Don’t know/Refused (VOL) 1 * e. Having lots of free time to relax or do things you want to do Washington Post / Kaiser /Harvard Aug 1997 Total 18-29 30-45 46-64 65+ Total 18-29 10 9 10 10 10 One of the most important things 8 9 43 39 47 47 36 Very important but not the most 41 46 37 43 32 37 36 Somewhat important 43 39 9 9 11 6 15 Not important 8 6 1 * 1 1 3 Don’t know/Refused (VOL) 1 0 f. Becoming famous Total 18-29 30-45 46-64 65+ 1 1 * 1 1 One of the most important things 3 3 5 3 2 Very important but not the most 9 10 11 8 7 Somewhat important 87 86 84 88 90 Not important * 1 * 1 * Don’t know/Refused (VOL)
  124. Appendix 2: Topline Questionnaire 118 Q.8 CONTINUED…. g. Helping other

    people who are in need Total 18-29 30-45 46-64 65+ 20 21 19 20 21 One of the most important things 60 60 59 61 59 Very important but not the most 18 17 19 17 19 Somewhat important 1 2 2 1 * Not important 1 1 1 1 1 Don’t know/Refused (VOL) h. Owning your own home Total 18-29 30-45 46-64 65+ 20 20 19 18 28 One of the most important things 53 53 55 57 43 Very important but not the most 20 21 20 18 20 Somewhat important 7 6 6 7 9 Not important 1 0 0 1 1 Don’t know/Refused (VOL) ASK ALL: On another subject… INT1 Do you use the internet, at least occasionally? INT2 Do you send or receive email, at least occasionally? Total 18-29 30-45 46-64 65+ 77 90 87 79 40 Yes to either (internet users) 23 10 13 21 60 No to both (non internet users) 0 0 0 0 0 Don’t know/Refused (VOL) ASK ALL: Q.9 Here are some activities some people do and others do not. For each, please tell me if you have done this in the past 12 months or not. (First/next) In the past 12 months, have you... [READ AND RANDOMIZE ITEMS IN BLOCKS a-d AND e-f. ALSO RANDOMIZE WITHIN BLOCKS],or not? a. Contacted a government official in person, by phone or by letter Total 18-29 30-45 46-64 65+ 23 18 22 29 22 Yes, did this 76 82 78 71 78 No, did not * 1 * * 0 Don’t know/Refused (VOL) ASK Q.9b AND 9c OF ALL INTERNET USERS (INT1=1 OR INT2=1): b. Contacted a government official by sending an email or posting a message on their website or social networking page BASED ON TOTAL: Total 18-29 30-45 46-64 65+ 22 17 25 29 13 Yes, did this 55 74 61 50 28 No, did not 23 10 13 21 60 Not an internet user * 0 * * 0 Don’t know/Refused (VOL)
  125. Appendix 2: Topline Questionnaire 119 Q.9 CONTINUED…. c. Signed a

    petition online BASED ON TOTAL: Total 18-29 30-45 46-64 65+ 19 21 19 21 10 Yes, did this 58 68 67 57 31 No, did not 23 10 13 21 60 Not an internet user 1 1 1 1 0 Don’t know/Refused (VOL) ASK ALL: d. Signed a paper petition Total 18-29 30-45 46-64 65+ 25 24 23 30 20 Yes, did this 75 75 77 69 80 No, did not 1 1 1 1 * Don’t know/Refused (VOL) e. Bought a certain product or service because you like the social or political values of the company that provides it Total 18-29 30-45 46-64 65+ 28 34 30 27 18 Yes, did this 70 65 69 71 78 No, did not 2 1 1 2 4 Don’t know/Refused (VOL) f. Decided NOT to buy a certain product or service because you disagree with the social or political values of the company that provides it Total 18-29 30-45 46-64 65+ 33 35 34 36 25 Yes, did this 65 64 65 62 70 No, did not 2 1 1 2 5 Don’t know/Refused (VOL) ASK ALL: Q.10 In the 2008 presidential election between Barack Obama and John McCain, did things come up that kept you from voting, or did you happen to vote? Total 18-29 30-45 46-64 65+ 73 59 68 81 82 Voted 27 40 31 19 17 Did not vote (includes too young to vote) * 1 * 0 0 Don't remember if voted (VOL) * * * 0 1 Refused (VOL) ASK IF YES (Q.10=1) [n=1,474]: Q.10a Did you vote for Obama, McCain or someone else? Total 18-29 30-45 46-64 65+ 49 63 51 45 42 Obama 36 29 33 41 39 McCain 5 4 8 4 4 Other candidate 2 1 1 2 2 Don't remember which candidate (VOL) 8 3 8 8 12 Refused (VOL) (n=505) (n=256) (n=400) (n=282)
  126. Appendix 2: Topline Questionnaire 120 ASK IF NO OR DK/REF

    (Q.10=2,8,9) [n=546]: Q.10b Did you favor Obama, McCain or someone else? Total 18-29 43 48 Obama 14 15 McCain 19 18 Other candidate 11 10 Don't remember which candidate (VOL) 13 10 Refused (VOL) (n=325) NO QUESTIONS 11-12 ASK ALL: Thinking more generally, Q.13 How often would you say you vote... [READ] Total 18-29 30-45 46-64 65+ 47 33 40 52 65 Always 23 19 24 27 17 Nearly always 9 14 9 8 7 Part of the time[OR] 10 14 13 7 7 Seldom 10 18 13 6 3 Never vote (VOL) 1 2 * * 1 Other response (VOL) * * 0 * 1 Don’t know/Refused (VOL) ASK ALL: Q.14 Thinking about the 2008 election, Barack Obama said that if he was elected president, he would change the way things work in Washington. Since he’s been in office, do you think the way things work in Washington has changed, or not? Total 18-29 30-45 46-64 65+ 47 46 51 41 49 Yes, has changed 47 48 43 52 43 No, has not changed 7 6 6 7 8 Don’t know/Refused (VOL) IF NO (Q.14=2), ASK [n=946]: Q.15 What do you think is the main reason things have not changed in Washington? Is it because … [READ AND RANDOMIZE]? Total 18-29 30-45 46-64 65+ 25 30 25 26 17 Obama hasn’t really tried to change things [OR] 60 56 60 62 64 Opponents and special interests have prevented change 15 15 15 12 19 Neither (VOL)/ Don’t know/Refused (VOL) (n=384) (n=160) (n=245) (n=140) ASK ALL: EDUC What is the last grade or class that you completed in school? [DO NOT READ] Total 18-29 30-45 46-64 65+ 14 16 14 10 21 Less than high school 36 34 30 40 42 High school graduate (Grade 12 or GED certificate) 22 31 21 20 15 Some college, no 4-year degree (including associate degree) 28 19 35 30 22 College graduate+ (B.S., B.A., or other 4-year degree) * * 0 0 0 Don’t know/Refused (VOL)
  127. Appendix 2: Topline Questionnaire 121 ASK IF AGE < 65

    [n=1,668]: SCHL Are you currently enrolled in school? [IF YES, PROBE TO DETERMINE IF ATTENDING HIGH SCHOOL, TECHNICAL TRADE OR VOCATIONAL SCHOOL, A COLLEGE UNDERGRADUATE OR IN GRADUATE SCHOOL] Total 18-29 30-45 46-64 16 39 11 5 Yes 2 5 1 * in High School 1 3 1 1 in Technical, trade, or vocational school 10 26 5 3 in College (Undergraduate) 3 5 4 1 in Graduate School 84 61 89 95 No 0 * 0 0 Don’t know/Refused (VOL) Trend: Sep 200635 18-29 18-29 39 Yes 36 5 in High School 5 3 in Technical, trade, or vocational school 2 26 in College (Undergraduate) 25 5 in Graduate School 4 61 No 63 * Don’t know/Refused (VOL) 1 ASK IF AGE < 65 AND CURRENTLY ENROLLED IN SCHOOL (SCHL=1,2,3,4) [n=409]: SCHL2 How much further in school do you plan to go? [DO NOT READ] Sep 2006 18-29 18-29 1 Finish high school 2 5 Technical, trade, or vocational school 3 8 Attend college, no degree or 2 year/associate degree 12 34 Attend college, bachelor’s degree 30 47 Graduate or professional school or degree 50 0 No further (VOL) 1 2 Other [Specify] (VOL) 1 3 Don’t know/Refused (VOL) 1 (n=349) NO QUESTION 16 35 The 2006 survey only asked 18-39 year olds of this question.
  128. Appendix 2: Topline Questionnaire 122 ASK IF AGE < 65

    AND NOT ENROLLED IN SCHOOL (SCHL=5,9) [n=1,259]: RSCHL Do you ever plan to return to school? 18-64 18-29 30-45 46-64 36 65 39 20 Yes 57 29 53 74 No 7 6 9 6 Don’t know/Refused (VOL) (n=481) (n=312) (n=466) Trend: Sep 2006 18-29 18-29 65 Yes 65 29 No 27 6 Don’t know/Refused (VOL) 8 ASK IF AGE < 65 AND PLANS TO RETURN TO SCHOOL (RSCHL=1) [n=553]: RSCHL2 How much further in school do you plan to go? [DO NOT READ] 18-64 18-29 30-45 3 4 2 Finish high school 9 9 7 Technical, trade, or vocational school 12 15 10 Attend college, no degree or 2 year/associate degree 25 30 28 Attend college, bachelor’s degree 32 32 36 Graduate or professional school or degree 1 0 1 No further (VOL) 8 2 9 Other [Specify] (VOL) 11 6 7 Don’t know/Refused (VOL) (n=330) (n=128) Trend: Sep 2006 18-29 18-29 4 Finish high school 10 9 Technical, trade, or vocational school 10 15 Attend college, no degree or 2 year/associate degree 11 30 Attend college, bachelor’s degree 35 32 Graduate or professional school or degree 23 0 No further (VOL) * 2 Other [Specify] (VOL) 5 6 Don’t know/Refused (VOL) 6 ASK IF <30 AND NO COLLEGE DEGREE AND NOT ENROLLED IN SCHOOL (AGE=18-29 AND EDUC=1-5 AND SCHL=5,9) [n=347]: Q.17 Which of the following is the MOST important reason why you are not currently in school [READ AND RANDOMIZE]? 18-29 36 You can’t afford school right now 14 You don’t need more education right now 1 You couldn’t get into a school you wanted to attend 35 You don’t have time to be in school right now 12 Other [SPECIFY] (VOL) 1 Don’t know/Refused (VOL)
  129. Appendix 2: Topline Questionnaire 123 ASK ALL: On a different

    subject… Q.18 Please tell me if you think each of the following trends is generally a good thing for our society, a bad thing for our society, or doesn’t make much difference? (First/Next) [INSERT ITEM; RANDOMIZE] [READ IF NECESSARY: Is this generally a good thing for our society, a bad thing for our society, or doesn’t it make much difference?] a. More single women deciding to have children without a male partner to help raise them Good thing for society Bad thing for society Doesn’t make much difference DK/Ref (VOL) Total 6 62 30 3 18-29 6 59 34 1 30-45 8 54 33 4 46-64 5 65 28 2 65+ 3 72 21 4 Trends: Total Jan 2010 6 62 30 3 Feb 2007 6 66 25 3 18-29 Jan 2010 6 59 34 1 Feb 2007 7 65 24 4 b. More gay and lesbian couples raising children Good thing for society Bad thing for society Doesn’t make much difference DK/Ref (VOL) Total 13 42 40 4 18-29 19 32 46 2 30-45 17 36 42 4 46-64 9 48 40 3 65+ 8 55 31 7 Trends: Total Jan 2010 13 42 40 4 Feb 2007 11 50 34 5 18-29 Jan 2010 19 32 46 2 Feb 2007 17 47 35 1
  130. Appendix 2: Topline Questionnaire 124 Q.18 CONTINUED… c. More people

    living together without getting married Good thing for society Bad thing for society Doesn’t make much difference DK/Ref (VOL) Total 10 38 50 2 18-29 14 22 63 1 30-45 14 31 53 2 46-64 8 44 46 2 65+ 3 58 35 4 Trends: Total Jan 2010 10 38 50 2 Feb 2007 10 44 43 3 18-29 Jan 2010 14 22 63 1 Feb 2007 11 32 56 2 d. More mothers of young children working outside the home Good thing for society Bad thing for society Doesn’t make much difference DK/Ref (VOL) Total 27 32 35 6 18-29 33 23 40 4 30-45 29 29 37 5 46-64 24 39 32 5 65+ 24 38 27 11 Trends: Total Jan 2010 27 32 35 6 Feb 2007 22 41 32 5 18-29 Jan 2010 33 23 40 4 Feb 2007 31 30 37 3 e. More people of different races marrying each other Good thing for society Bad thing for society Doesn’t make much difference DK/Ref (VOL) Total 24 13 61 3 18-29 34 5 60 1 30-45 27 10 62 1 46-64 18 14 65 3 65+ 15 26 52 7
  131. Appendix 2: Topline Questionnaire 125 ASK ALL INTERNET USERS (INT1=1

    OR INT2=1): On another subject… Q.19 Have you ever created your own profile on any social networking site like MySpace, Facebook or LinkedIn, or haven’t you done this? BASED ON TOTAL: Total 18-29 30-45 46-64 65+ 41 75 50 30 6 Yes 35 16 37 49 34 No 23 10 13 21 60 Not an internet user * 0 0 * 0 Don’t know/Refused (VOL) ASK IF HAS SNS PROFILE (Q.19=1): [n=1,027] Q.20 How often do you visit the social networking site you use most often… several times a day, about once a day, every few days, once a week or less often? Total 18-29 30-45 46-64 21 29 19 11 Several times a day 23 26 19 26 About once a day 23 20 24 25 Every few days 16 10 19 19 Once a week 18 15 20 19 Less often * * 0 0 Don’t know/Refused (VOL) (n=655) (n=189) (n=152) ASK ALL INTERNET USERS (INT1=1 OR INT2=1): Q.21 Do you ever use Twitter, or haven’t you done this? BASED ON TOTAL: Total 18-29 30-45 46-64 65+ 8 14 10 6 1 Yes 69 77 77 73 40 No 23 10 13 21 60 Not an internet user * 0 0 0 0 Don’t know/Refused (VOL) ASK ALL INTERNET USERS (INT1=1 OR INT2=1): Q.22 When you are away from home or work, do you ever connect to the internet wirelessly using a laptop or handheld device, or not? BASED ON TOTAL: Total 18-29 30-45 46-64 65+ 41 62 48 35 11 Yes 36 28 38 44 29 No 23 10 13 21 60 Not an internet user * * 0 0 0 Don’t know/Refused (VOL)
  132. Appendix 2: Topline Questionnaire 126 ASK ALL: Q.23 I’m going

    to read some statements about technology such as the internet and cell phones. As I read each pair, please tell me which comes closer to your own views, even if neither is exactly right. The (first/next) pair is [INSERT ITEM; RANDOMIZE ITEMS a. THRU c. AND RANDOMIZE STATEMENTS WITHIN ITEMS] [REPEAT AS NECESSARY “which statement come closer to your own views, even if neither is exactly right?”] a. New technology makes people closer to their friends and family [OR] New technology makes people more isolated Total 18-29 30-45 46-64 65+ 50 54 52 48 44 New technology makes people closer to their friends and family 39 35 36 42 44 New technology makes people more isolated 2 1 2 2 3 Neither equally (VOL) 7 9 8 7 4 Both equally (VOL) 2 1 2 1 5 Don’t know/Refused (VOL) b. New technology makes people waste too much time [OR] New technology allows people to use their time more efficiently Total 18-29 30-45 46-64 65+ 35 33 34 35 41 New technology makes people waste too much time 52 56 52 54 41 New technology allows people to use their time more efficiently 3 1 2 2 7 Neither equally (VOL) 8 9 10 8 5 Both equally (VOL) 2 1 1 2 5 Don’t know/Refused (VOL) c. New technology makes life easier [OR] New technology makes life more complicated Total 18-29 30-45 46-64 65+ 64 74 69 60 50 New technology makes life easier 26 18 21 30 36 New technology makes life more complicated 2 1 1 2 4 Neither equally (VOL) 8 7 9 8 7 Both equally (VOL) 1 * 0 1 4 Don’t know/Refused (VOL) ASK ALL CELL PHONE USERS (L1=1 OR CELL PHONE SAMPLE): Q.24 Do you ever use your cell phone to send or receive text messages, or not? BASED ON TOTAL: Total 18-29 30-45 46-64 65+ 59 88 77 51 9 Yes 26 6 13 37 53 No 14 6 10 11 38 Not a cell phone user * * 0 0 0 Don’t know/Refused (VOL)
  133. Appendix 2: Topline Questionnaire 127 ASK IF SENDS/RECEIVES TEXT MESSAGES

    (Q.24=1): Q.25 Thinking about the past 24 hours, about how many text messages did you send and receive on your cell phone? ASK IF DON’T KNOW/REFUSED HOW MANY (Q.25=999): Q.25a Well, in the past 24 hours, did you send or receive [READ] BASED ON TOTAL: Total 18-29 30-45 46-64 12 8 14 17 No text messages in past 24 hours 24 29 31 26 1-10 text messages 8 12 12 4 11-20 8 16 11 3 21-50 5 13 6 2 51-100 2 6 1 * 101-200 1 5 1 0 More than 200 text messages 14 6 10 11 Not a cell phone user 26 7 13 37 Cell phone user but does not text * * 0 0 Don’t know/Refused (VOL) Median (among cell phone users who texted in the past 24 hours) 10 20 12 5 ASK ALL: Q.26 [IF USES CELL PHONE TO TEXT (Q.24=1)]: Still thinking about the past 24 HOURS, did you [INSERT FIRST ITEM; RANDOMIZE] or not? In the past 24 hours, did you [INSERT NEXT ITEM], or not? [IF NO CELL PHONE (L1=2,9) OR DOESN’T USE CELL PHONE TO TEXT (Q.24=2,9)]: Thinking about the past 24 HOURS, did you [INSERT FIRST ITEM; RANDOMIZE] or not? In the past 24 hours, did you [INSERT NEXT ITEM], or not? ASK ITEMS a, b AND c ONLY OF INTERNET USERS (INT1=1 OR INT2=1): a. Post a message to someone’s personal online profile BASED ON TOTAL: Sep 2006 Total 18-29 30-45 46-64 65+ Total 18-29 17 32 22 9 3 Yes 9 20 60 58 65 69 37 No 66 69 23 10 13 21 60 Not an internet user 25 11 * 0 0 0 0 Don’t know/Refused (VOL) * 0 b. Send or receive an email message BASED ON TOTAL: Sep 2006 Total 18-29 30-45 46-64 65+ Total 18-29 51 56 57 54 26 Yes 49 50 26 34 29 24 14 No 26 38 23 10 13 21 60 Not an internet user 25 11 * * * * * Don’t know/Refused (VOL) * 0
  134. Appendix 2: Topline Questionnaire 128 Q.26 CONTINUED… c. Watch a

    video online BASED ON TOTAL: Total 18-29 30-45 46-64 65+ 18 32 23 9 7 Yes 59 57 63 70 33 No 23 10 13 21 60 Not an internet user * 1 0 0 1 Don’t know/Refused (VOL) ASK All: d. Play video games Total 18-29 30-45 46-64 65+ 16 28 14 15 6 Yes 84 72 86 85 93 No * * 0 * 1 Don’t know/Refused (VOL) e. Get some kind of VIGOROUS exercise, such as jogging, biking, or working out at a gym Total 18-29 30-45 46-64 65+ 46 56 48 42 39 Yes 54 44 52 58 61 No * 0 0 0 0 Don’t know/Refused (VOL) f. Watch more than an hour of television programming Total 18-29 30-45 46-64 65+ 71 57 67 78 82 Yes 29 43 33 22 18 No * 1 0 * 0 Don’t know/Refused (VOL) g. Read a daily newspaper INTERVIEWER NOTE: ACCEPT PRINT OR ONLINE NEWSPAPER Total 18-29 30-45 46-64 65+ 55 43 50 58 73 Yes 45 57 50 41 26 No * 0 0 * 1 Don’t know/Refused (VOL) NO QUESTION 27-30
  135. Appendix 2: Topline Questionnaire 129 ASK ALL: On another subject…

    EMPLOY Are you now employed full-time, part-time or not employed? ASK IF NOT EMPLOYED (EMPLOY=3): EMPLOY2 Is that because you are a student, because you are retired, because you choose not to work, or because you’ve lost or quit a job? Total 18-29 30-45 46-64 65+ 60 64 75 68 16 Employed 46 41 65 54 7 Full-time 14 24 10 14 9 Part-time 40 35 25 32 84 Not employed 3 13 1 * 0 Student 17 * 1 13 75 Retired 4 4 7 3 1 Choose not to work 7 10 7 8 1 Lost or quit a job 8 8 8 8 6 Other reason [Specify] (VOL) * 0 1 * 0 Don't know/Refused (VOL) * * 0 0 0 Don't know/Refused (VOL) ASK IF EMPLOYED (EMPLOY=1,2) [n=1,239]: EMPLOY3 Are you self-employed, do you work for someone else, or do you do both? Total 18-29 30-45 46-64 13 6 12 18 Self-employed/own a business 76 82 78 71 Work for someone else 10 12 10 10 Both * * * 0 Don’t know/Refused (VOL) (n=554) (n=266) (n=346) ASK IF EMPLOYED (EMPLOY=1,2) [n=1,239]: Q.31 Do you think of your current job as a career, a stepping stone to a career, or do you think of it as just a job to get you by? Total 18-29 30-45 46-64 51 28 53 64 A career 18 33 24 5 A stepping stone to a career 29 38 22 28 Just a job to get you by 2 * 1 2 Don’t know/Refused (VOL) Trend for comparison: Public Agenda Aug 200536 18-25 18-25 18 A career 18 36 A stepping stone to a career 36 45 Just a job to get you by 46 0 Don’t know/Refused (VOL) 0 36 National random sample of 1,000 young adults ages 18-25, conducted August 14-September 4, 2004.
  136. Appendix 2: Topline Questionnaire 130 ASK IF EMPLOYED (EMPLOY=1,2) [n=1,239]:

    Q.32 Do you now earn enough money to lead the kind of life you want, or not? ASK IF NO (Q.32=2): Q.33 Do you think you will be able to earn enough money in the future to lead the kind of life you want, or not? Yes No (NET) Yes, will in future No, will not in future DK/Ref (VOL ) DK/Ref (VOL) Total 45 55 37 16 2 1 18-29 31 68 60 7 1 1 30-45 46 54 40 12 1 0 46-64 52 47 22 23 3 1 Trends (selected years): Total Jan 2010 45 55 37 16 2 1 Sep 2006 49 50 33 15 2 1 Nov 1997 41 59 33 24 2 * 18-29 Jan 2010 31 68 60 7 1 1 Sep 2006 32 67 62 5 * 1 Nov 1997 30 69 53 16 0 1 ASK IF NOT EMPLOYED OR DK/REF (EMPLOY=3,9) [n=781]: Q.34 Do you now have enough income to lead the kind of life you want, or not? ASK IF NO (Q.34=2): Q.35 Do you think you will have enough income in the future to lead the kind of life you want, or not? Yes No (NET) Yes, will in future No, will not in future DK/Ref (VOL ) DK/Ref (VOL) Total 42 57 31 22 4 1 18-29 (n=276) 19 79 70 8 1 2 46-64 (n=141) 29 70 33 35 3 1 65+ (n=264) 65 34 4 24 6 * Trend (selected years): Total Jan 2010 42 57 31 22 4 1 Sep 2006 53 44 22 18 4 2 18-29 Jan 2010 19 79 70 8 1 2 Sep 2006 38 60 52 6 2 2
  137. Appendix 2: Topline Questionnaire 131 ASK ALL: Q.36 How closely

    do you watch the amount of money you spend [READ]? Oct 2006 Total 18-29 30-45 46-64 65+ Total 18-29 57 55 59 57 57 Very closely 46 43 31 30 27 34 33 Fairly closely 41 41 8 11 8 7 6 Not too closely 8 11 3 3 4 1 2 Not at all closely 3 5 1 * 1 1 2 Don’t know/Refused (VOL) 1 * ASK IF EMPLOYED (EMPLOY=1,2) [n=1,239]: Q.37 Have you ever switched careers—that is, switched from one TYPE of work to another TYPE of work? Total 18-29 30-45 46-64 61 58 63 61 Yes 39 42 36 38 No * * * * Don’t know/Refused (VOL) (n=554 ) (n=266 ) (n=346) Trends: Yes No DK/Ref (VOL) Total Jan 2010 61 39 * Jun 2006 61 38 1 PSRAI Jul 1997 63 37 0 USAToday April 1987 52 48 0 USAToday Dec 1986 54 47 0 18-29 Jan 2010 58 42 * Jun 2006 61 38 1 PSRAI Jul 1997 57 43 0 ASK IF EMPLOYED (EMPLOY=1,2) [n=1,239]: Q.38 How likely is it that you will switch careers (IF SWITCHED Q.37=1: again) sometime during your working life? [READ] Total 18-29 30-45 46-64 24 39 28 14 Very likely 23 27 28 17 Somewhat likely 23 20 21 27 Not very likely 29 13 22 41 Not at all likely 1 1 1 1 Don’t know/Refused (VOL) (n=554) (n=266) (n=346)
  138. Appendix 2: Topline Questionnaire 132 Trends: Very likely Somewhat likely

    Not very likely Not at all likely DK/Ref. (VOL) Total Jan 2010 24 23 23 29 1 Jun 2006 28 19 25 27 1 PSRAI Jul 199737 29 21 25 24 1 USAToday April 1987 23 20 24 32 1 18-29 Jan 2010 39 27 20 13 1 Jun 2006 50 21 17 11 * PSRAI Jul 1997 50 24 13 12 * ASK IF EMPLOYED (EMPLOY=1,2) [n=1,239] Q.39 [IF NOT SELF-EMPLOYED (EMPLOY3>1)]: How likely is it that you will stay with your present employer for the remainder of your working life? Is it… [READ] [IF SELF-EMPLOYED (EMPLOY3=1)]: How likely is it you will stay self-employed for the remainder of your working life? Is it…[READ] Total 18-29 30-45 46-64 40 16 32 60 Very likely 26 26 30 23 Somewhat likely 16 21 21 8 Not very likely 16 36 15 6 Not at all likely 2 1 2 2 Don’t know/Refused (VOL) (n=554) (n=266) (n=346) Trends: Very likely Somewhat likely Not very likely Not at all likely DK/Ref (VOL) Total Jan 2010 40 26 16 16 2 Jun 2006 42 27 13 17 1 PSRAI Jul 199738 41 24 18 17 * USAToday April 1987 44 20 20 15 1 USA Today Dec 1986 45 19 13 23 1 18-29 Jan 2010 16 26 21 36 1 Jun 2006 21 26 16 37 0 PSRAI Jul 1997 15 24 24 36 * ASK ALL: Q.40 Which of these do you think has the most influence over how you live your life these days [READ AND RANDOMIZE]? Total 18-29 30-45 46-64 65+ 42 40 39 42 48 The government [OR] 35 42 41 35 18 Business corporations 10 10 7 10 12 Both (VOL) 13 8 13 13 22 Don’t know/Refused (VOL) 37 The response category for the PSRAI and USA Today trends from 1997 and 1987 was “Not likely at all”. 38 The response category for the PSRAI and USA Today trends from 1997 and 1987 was “Not likely at all”.
  139. Appendix 2: Topline Questionnaire 133 ASK ALL: Q.41 Do you

    strongly favor, favor, oppose, or strongly oppose allowing gay and lesbian couples to marry legally? Total 18-29 30-45 46-64 65+ 14 21 17 10 6 Strongly favor 24 29 27 22 18 Favor 23 18 19 26 34 Oppose 28 19 27 32 32 Strongly oppose 11 14 11 10 10 Don’t know/Refused (VOL) Trends: Strongly favor Favor Oppose Strongly oppose DK/Ref (VOL) Total Jan 2010 14 24 23 28 11 July 2006 12 23 25 31 9 June 1996 6 21 24 41 8 18-29 Jan 2010 21 29 18 19 14 July 2006 21 32 18 20 9 June 1996 8 33 21 31 6 ASK ALL: Q.42 On the whole, would you say you are saving and investing as much money as you should, or do you feel you should probably be saving and investing more? Oct 2006 Total 18-29 30-45 46-64 65+ Total 18-29 26 22 18 26 44 Saving and investing as much as you should 32 26 69 77 78 71 40 Should be saving and investing more 63 72 5 1 3 3 16 Don’t know/Refused (VOL) 5 2 ASK ALL: Q.43 Have you ever spent time participating in any community service or volunteer activity, or haven’t you had time to do this? By volunteer activity, I mean actually working in some way to help others for no pay. [IF YES: Have you done this in the last 12 months?] Total 18-29 30-45 46-64 65+ 52 57 54 52 39 Yes have done it in last 12 months 21 18 18 21 30 Yes, but have not done it in last 12 months (or unsure if done in last 12 months) 27 25 28 26 30 No, have not ever done it * * 0 * 1 Don’t know/Refused (VOL)
  140. Appendix 2: Topline Questionnaire 134 Q.43 CONTINUED… Trend for comparison:

    Circle April 200639 18-29 18-29 57 Yes have done it in last 12 months 31 18 Yes, but have not done it in last 12 months (or unsure if done in last 12 months) 29 25 No, have not ever done it 40 * Don’t know/Refused (VOL) * ASK ALL: Q.44 And just a few questions about you. For each item, please just answer yes or no. First, [INSERT ITEM; RANDOMIZE ITEMS a THRU f; WITH ITEMS g,h, and i LAST AND IN ORDER] a. Do you recycle paper, plastic or glass from home? Total 18-29 30-45 46-64 65+ 74 69 77 72 77 Yes 25 30 22 27 22 No * 1 * * 1 Don’t know/Refused (VOL) b. Do you have a close friend or family member who is gay? Total 18-29 30-45 46-64 65+ 43 54 46 44 26 Yes 56 46 53 55 73 No * 1 * 1 1 Don’t know/Refused (VOL) c. Do you happen to have any guns, rifles or pistols in your home? Total 18-29 30-45 46-64 65+ 34 28 31 42 32 Yes 63 71 66 56 63 No 3 * 2 2 6 Don’t know/Refused (VOL) ASK ITEM d. IF R USES INTERNET (INT1=1 OR INT2=1) d. Have you ever posted a video of yourself online? BASED ON TOTAL: Total 18-29 30-45 46-64 65+ 7 20 6 2 1 Yes 70 71 80 77 40 No 23 10 13 21 60 Not an internet user * 0 0 0 0 Don’t know/Refused (VOL) 39 Survey by the Center for Information and Research on Civic Leaning & Engagement, April 27-June11, 2006, based on telephone and online interviews with a national sample of ages 15 and older. The over sample of 467 African-Americans, Latinos and Asian-Americans age 15-25 were completed online.
  141. Appendix 2: Topline Questionnaire 135 Q.44 CONTINUED… dd. Have you

    ever voted for a contestant in a televised talent contest such as American Idol or Dancing with the Stars? Total 18-29 30-45 46-64 65+ 17 20 18 18 11 Yes 82 80 82 82 87 No * 0 0 0 2 Don’t know/Refused (VOL) e. Do you try to buy green or environmentally-friendly products, even if they are more expensive? Total 18-29 30-45 46-64 65+ 54 53 55 54 51 Yes 45 46 44 44 45 No 2 1 1 1 4 Don’t know/Refused (VOL) f. Do you try to buy organic foods, even if they are more expensive {new} Total 18-29 30-45 46-64 65+ 35 36 38 35 27 Yes 64 63 62 64 72 No 1 1 * 1 1 Don’t know/Refused (VOL) ASK ITEM g IF R USES CELL PHONE TO TEXT (Q.24=1) g. Have you ever sent or received a text message while driving? BASED ON TOTAL: Total 18-29 30-45 46-64 65+ 34 64 46 21 1 Yes 25 24 31 30 8 No 41 12 23 49 91 Doesn’t use cell phone to text * 0 0 1 0 Don’t know/Refused (VOL) ASK ITEMS h AND i IF R HAS A CELL PHONE (L1=1 OR CELL SAMPLE) h. Have you ever talked on a cell phone while driving? BASED ON TOTAL: Total 18-29 30-45 46-64 65+ 66 75 75 72 27 Yes 20 18 15 16 35 No 14 6 10 11 38 Doesn’t have a cell phone * * * * 0 Don’t know/Refused (VOL) i. Have you ever placed your cell phone on or right next to your bed while sleeping? BASED ON TOTAL: Total 18-29 30-45 46-64 65+ 57 83 68 50 20 Yes 28 11 22 39 42 No 14 6 10 11 38 Doesn’t have a cell phone * 0 0 0 0 Don’t know/Refused (VOL)
  142. Appendix 2: Topline Questionnaire 136 ASK ALL: Q.45 Do you

    have [INSERT ITEM; RANDOMIZE]: a. A tattoo Total 18-29 30-45 46-64 65+ 23 38 32 15 6 Yes 77 62 68 85 94 No * * * 0 0 Don’t know/Refused (VOL) Trend for comparison: Sep 200640 Total 18-29 24 41 Yes 76 59 No 0 0 Don’t know/Refused (VOL) b. A piercing in a place other than your earlobe Total 18-29 30-45 46-64 65+ 8 23 9 1 * Yes 92 77 91 99 100 No * * * 0 0 Don’t know/Refused (VOL) Trend for comparison: Sep 200641 Total 18-29 15 33 Yes 85 67 No 0 0 Don’t know/Refused (VOL) ASK IF HAVE A TATTOO (Q.45a=1): Q.46 How many tattoos do you have? ENTER NUMBER (RANGE 1-50) BASED ON TOTAL: Total 18-29 30-45 46-64 65+ 77 62 68 85 94 None 10 12 12 9 3 1 8 13 10 5 2 2-3 3 6 6 * 1 4-5 2 5 4 * 0 6-10 1 2 1 0 0 11+ * * * * 0 Don’t know/Refused (VOL) 40 The 2006 survey only asked this question of 18-64 year olds. The question wording was “Do you have, or have you ever had…?” 41 The 2006 survey only asked this question of 18-64 year olds. The question wording was “Do you have, or have you ever had…?”
  143. Appendix 2: Topline Questionnaire 137 ASK IF ONE OR MORE

    TATTOOS (Q.45a=1) [n=492]: Q.47 (IF Q.46=1) Is your tattoo usually visible or not? (IF Q.46>1:) Are your tattoos usually visible or not? Total 18-29 30-45 18 21 14 Yes, visible 72 70 74 No, not visible 8 6 11 Depends on what I’m wearing (VOL) 1 4 0 Some visible, some not (VOL) 1 0 1 Don’t know/Refused (VOL) (n=295) (n=112) ASK ALL: Q.48 Have you ever had a tattoo removed? Total 18-29 30-45 46-64 65+ 1 1 1 1 0 Yes 99 98 99 99 100 No * * * 0 0 Don’t know/Refused (VOL) ASK ALL: MARITAL Are you currently married, living with a partner, divorced, separated, widowed, or have you never been married? [IF R SAYS “SINGLE,” PROBE TO DETERMINE WHICH CATEGORY IS APPROPRIATE] Total 18-29 30-45 46-64 65+ 51 23 59 64 48 Married 8 17 10 4 2 Living with a partner 9 2 8 16 8 Divorced 3 1 5 2 1 Separated 8 * 1 7 34 Widowed 20 55 17 7 6 Never been married 1 1 * * * Don’t know/Refused (VOL) ASK ALL NOT LIVING WITH PARTNER (MARITAL=1,3,4,5,6,9) [n=1,847]: LWP2 Have you ever lived together with a partner without being married, or not? Total 18-29 30-45 46-64 65+ 45 44 61 48 18 Yes 54 55 39 52 82 No * * * * * Don’t know/Refused (VOL) (n=709) (n=322) (n=469) (n=314) ASK IF YES TO LWP2 AND MARRIED (LWP2=1 & MARITAL=1) [n=388]: LWP3 Did you live with your current spouse before you got married, did you live with someone else, or have you done both? Total 18-29 30-45 46-64 72 72 73 70 Lived with current spouse before married 6 4 7 5 Lived with someone else 21 23 20 24 Lived with both current spouse and someone else 1 1 0 1 Don’t know/Refused (VOL) (n=109) (n=127) (124)
  144. Appendix 2: Topline Questionnaire 138 ASK ALL: KIDSA Do you

    have any children under the age of 18? Total 18-29 30-45 46-64 65+ 34 34 69 19 2 Yes 66 65 30 81 98 No * * * * * Don’t know/Refused (VOL) ASK ALL: FAM1 During the time you were growing up, who did you live with MOST of the time? Did you live with … [READ] Total 18-29 30-45 46-64 65+ 73 61 68 80 80 Both parents 19 27 23 14 12 Only your mother 3 4 2 2 2 Only your father 6 7 7 4 6 Neither parent * 1 * * * Don’t know/Refused (VOL) ASK ALL: FAM2 What was the marital status of your parents during most of the time you were growing up – were they married, divorced, separated, widowed or never married to each other? Total 18-29 30-45 46-64 65+ 76 62 71 85 87 Married 12 19 14 8 5 Divorced 3 5 5 2 1 Separated 2 2 2 2 4 Widowed 5 11 7 2 1 Never married 1 1 * 1 2 Don’t know/Refused (VOL) ASK ALL: RELIG What is your present religion, if any? Are you Protestant, Roman Catholic, Mormon, Orthodox such as Greek or Russian Orthodox, Jewish, Muslim, Buddhist, Hindu, atheist, agnostic, something else, or nothing in particular? [INTERVIEWER: IF R VOLUNTEERS “nothing in particular, none, no religion, etc.” BEFORE REACHING END OF LIST, PROMPT WITH: And would you say that’s atheist, agnostic, or just nothing in particular?] ASK IF SOMETHING ELSE OR DK/REF (RELIG=11, 99): CHR Do you think of yourself as a Christian or not? Total 18-29 30-45 46-64 65+ 51 44 48 53 60 Protestant 23 20 22 25 24 Catholic 16 24 20 13 6 Unaffiliated 8 8 8 7 9 Other 2 3 2 2 1 Don't know/Refused (VOL) ASK ALL: ATTEND Aside from weddings and funerals, how often do you attend religious services... more than once a week, once a week, once or twice a month, a few times a year, seldom, or never? Total 18-29 30-45 46-64 65+ 12 7 11 15 14 More than once a week 24 20 23 26 31 Once a week 13 14 17 12 11 Once or twice a month 18 21 17 17 19 A few times a year 18 20 19 17 15 Seldom 13 17 12 12 10 Never 1 1 1 1 1 Don't know/Refused (VOL)
  145. Appendix 2: Topline Questionnaire 139 ASK ALL: INCOME Last year,

    that is in 2009, what was your total family income from all sources, before taxes? Just stop me when I get to the right category. [READ] Total 18-29 30-45 46-64 65+ 19 24 18 12 26 Less than $20,000 12 15 14 9 13 $20,000 to under $30,000 17 19 14 19 18 $30,000 to under $50,000 14 13 13 19 8 $50,000 to under $75,000 11 8 14 13 4 $75,000 to under $100,000 13 9 18 16 6 $100,000+ 14 13 10 11 24 Don’t know/Refused (VOL) ASK IF AGE <40: [n=1,026] FINAN Do you depend on your parents or other family members for financial assistance, or not? Total 18-29 30-39 23 36 6 Yes 76 63 94 No 1 1 * Don’t know/Refused (VOL) (n=830) (n=196) ASK ALL: HEALTH Are you, yourself, now covered by any form of health insurance or health plan or are you not covered at this time? [READ IF NECESSARY: A health plan would include any private insurance plan through your employer or a plan that you purchased yourself, as well as a government program like Medicare or Medicaid] Total 18-29 30-45 46-64 65+ 77 61 73 83 95 Covered by health insurance 22 37 26 17 3 Not covered by health insurance 1 2 * 0 2 Don’t know/Refused (VOL) ASK ALL: REGIST These days, many people are so busy they can't find time to register to vote, or move around so often they don't get a chance to re-register. Are you NOW registered to vote in your precinct or election district or haven't you been able to register so far? ASK IF RESPONDENT ANSWERED '1' YES IN REGIST: REGICERT Are you absolutely certain that you are registered to vote, or is there a chance that your registration has lapsed because you moved or for some other reason? Total 18-29 30-45 46-64 65+ 78 66 73 85 88 Yes, registered 75 62 70 84 87 Absolutely certain 2 4 3 1 * Chance registration has lapsed * 1 * * 0 Don't know/Refused (VOL) 21 31 27 14 11 No, not registered 1 2 * * 2 Don't know/Refused (VOL)
  146. Appendix 2: Topline Questionnaire 140 ASK ALL: PARTY In politics

    TODAY, do you consider yourself a Republican, Democrat, or Independent? IF ANSWERED 3, 4, 5 OR 9 IN PARTY, ASK: PARTYLN As of today do you lean more to the Republican Party or more to the Democratic Party? BASED ON TOTAL: Total 18-29 30-45 46-64 65+ 24 20 22 28 25 Republican 33 33 33 32 38 Democrat 31 35 31 32 25 Independent 7 7 10 4 4 No preference (VOL) 1 * 1 0 1 Other party (VOL) 4 4 4 4 6 Don't know/Refused (VOL) 13 12 12 13 15 Lean Republican 12 16 17 10 4 Lean Democrat 18 19 17 17 18 Refused to lean (VOL) ASK ALL: IDEO In general, would you describe your political views as... [READ] Total 18-29 30-45 46-64 65+ 8 6 7 8 11 Very conservative 32 23 31 36 39 Conservative 32 32 33 33 29 Moderate 15 21 16 12 9 Liberal, OR 6 8 9 5 3 Very liberal 7 10 6 5 9 Don't know/Refused (VOL) ASK IF AGE >29: [n=1,157] HOME Do you own or rent your home? 30+ 71 Own 25 Rent 3 Other arrangement 1 Don't know/Refused (VOL) ASK IF AGE < 30: [n=830] HOME2 Do you own your home, rent, live in a dorm or live with your parents? 22 Own 42 Rent 4 Live in a dorm 29 Live with parents 2 Other arrangement 2 Don't know/Refused (VOL) HOME/HOME2 Total 18-29 30-45 46-64 65+ 60 22 61 79 73 Own 28 42 35 18 19 Rent 10 35 3 2 5 Other 1 2 * * 2 Don't know/Refused (VOL)
  147. Donald Kimelman Managing Director, Information Initiatives and the Philadelphia Program

    The Pew Charitable Trusts Henry Bernstein Managing Director, Finance, and Treasurer The Pew Charitable Trusts Peter W. Bernstein Partner ASAP Media Karlyn Bowman Resident Fellow American Enterprise Institute Patrick Butler Vice President The Washington Post Company Michael Delli Carpini Dean Annenberg School for Communication, University of Pennsylvania Joy A. (“Jamie”) Horwitz Philanthropic Advisor Andrew Kohut (non-voting) President Pew Research Center Pew Research CENTER Leadership Senior Management President: Andrew Kohut* Executive Vice President: Paul Taylor** Vice President: Elizabeth Mueller Gross Director of Survey Research: Scott Keeter Director, Pew Research Center’s Project for Excellence in Journalism: Tom Rosenstiel Director, Pew Research Center’s Forum on Religion & Public Life: Luis Lugo Director, Pew Research Center’s Internet & American Life Project: Lee Rainie *Andrew Kohut also serves as director of the Pew Research Center for the People & the Press and the Pew Research Center’s Global Attitudes Project. **Paul Taylor also serves as director of Pew Research Center’s Social & Demographic Trends Project and Pew Hispanic Center. Governing Board
  148. Pew Research Center for the People & the Press •

    Pew Global Attitudes Project Pew Research Center’s Project for Excellence in Journalism • Pew Hispanic Center Pew Internet & American Life Project • Pew Forum on Religion & Public Life Pew Social & Demographic Trends An independent subsidiary of The Pew Charitable Trusts PewResearchCenter At that web address, users can explore special features such as our “How Millennial Are You?” quiz and other interactive graphics. And they can read other reports in this on-going series. pewresearch.org/millennials Teens and Distracted Driving Nov. 16, 2009 Between Two Worlds: How Young Latinos Come of Age in America Dec. 11, 2009 The Post-Communist Generation in the Former Eastern Bloc Jan. 20, 2010 Almost All Millennials Accept Interracial Dating and Marriage Feb. 1, 2010 Social Media and Young Adults Feb. 3, 2010 A sampler of recent reports in this series: