(Lecture-05). Make sure you are checking in on the Slack and on GitHub - questions starting to come in and we’ll be getting feedback on lab-02 back this week! You have two weeks to complete PS-01 - it is due before Lecture-06.
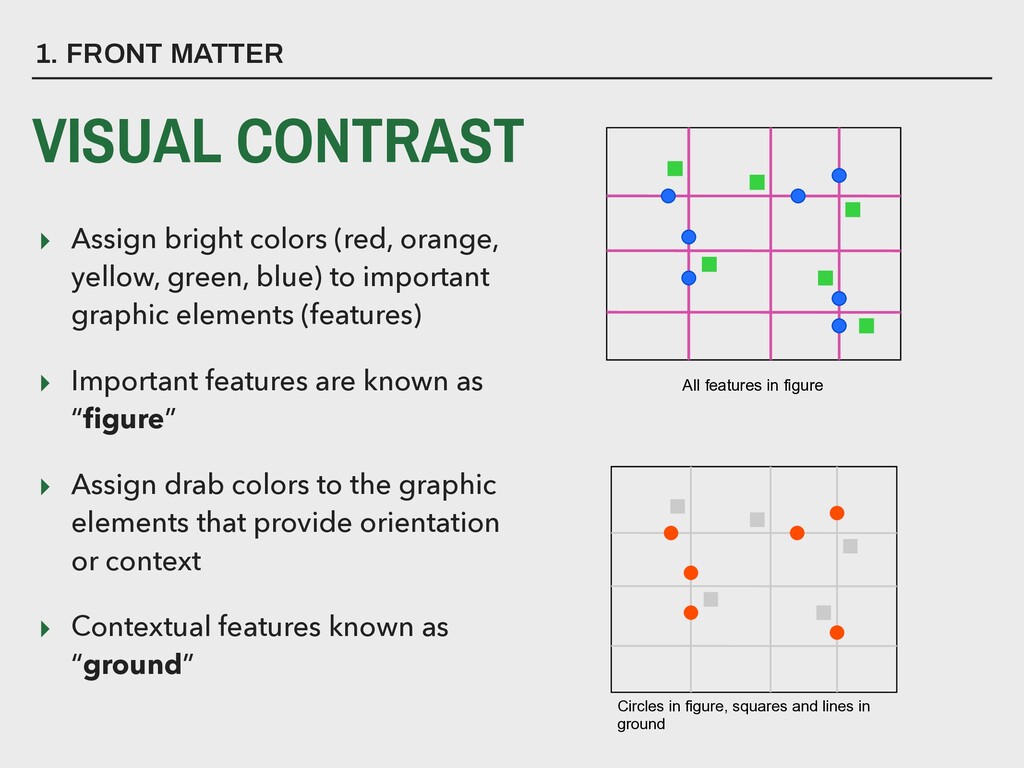
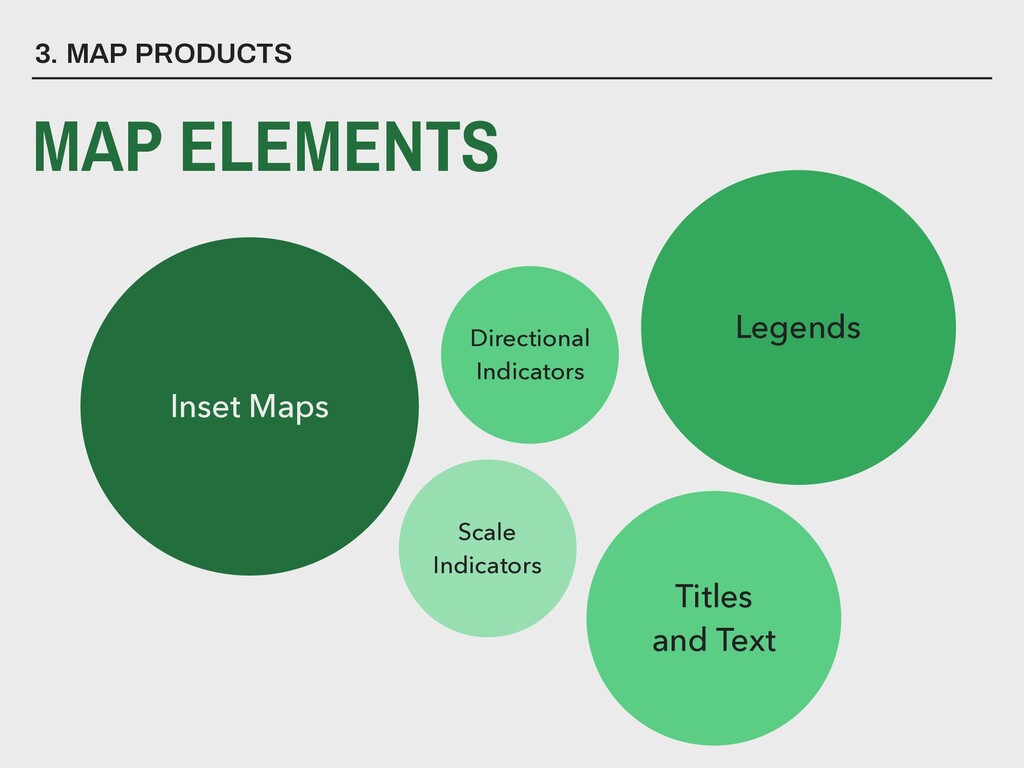
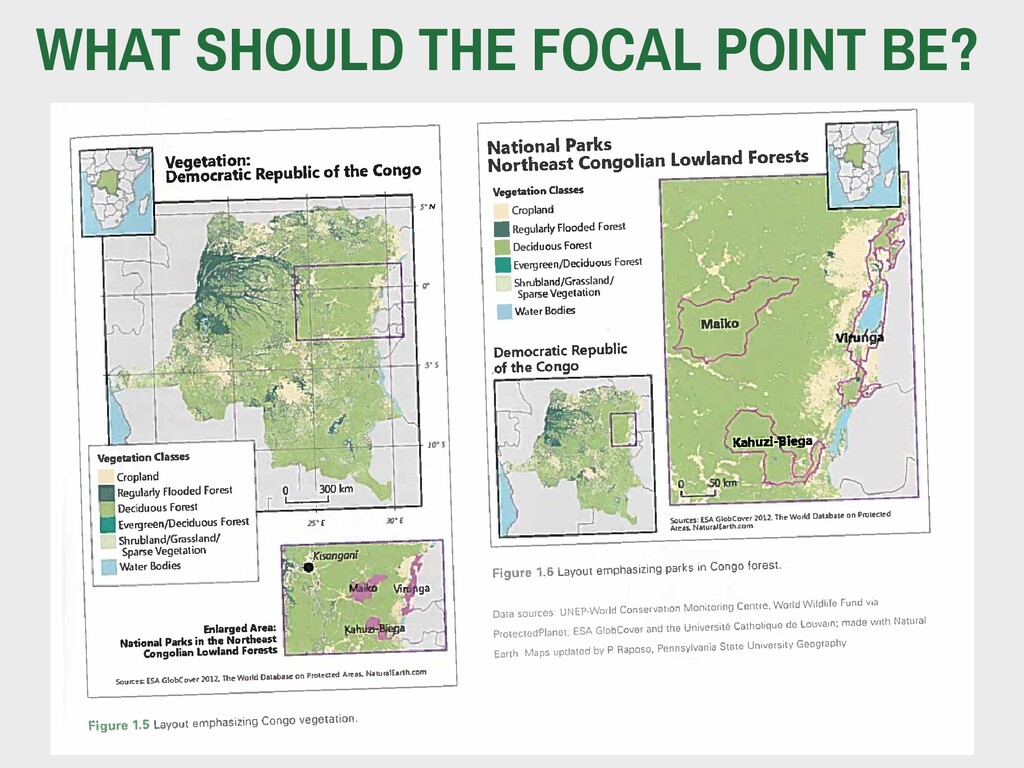
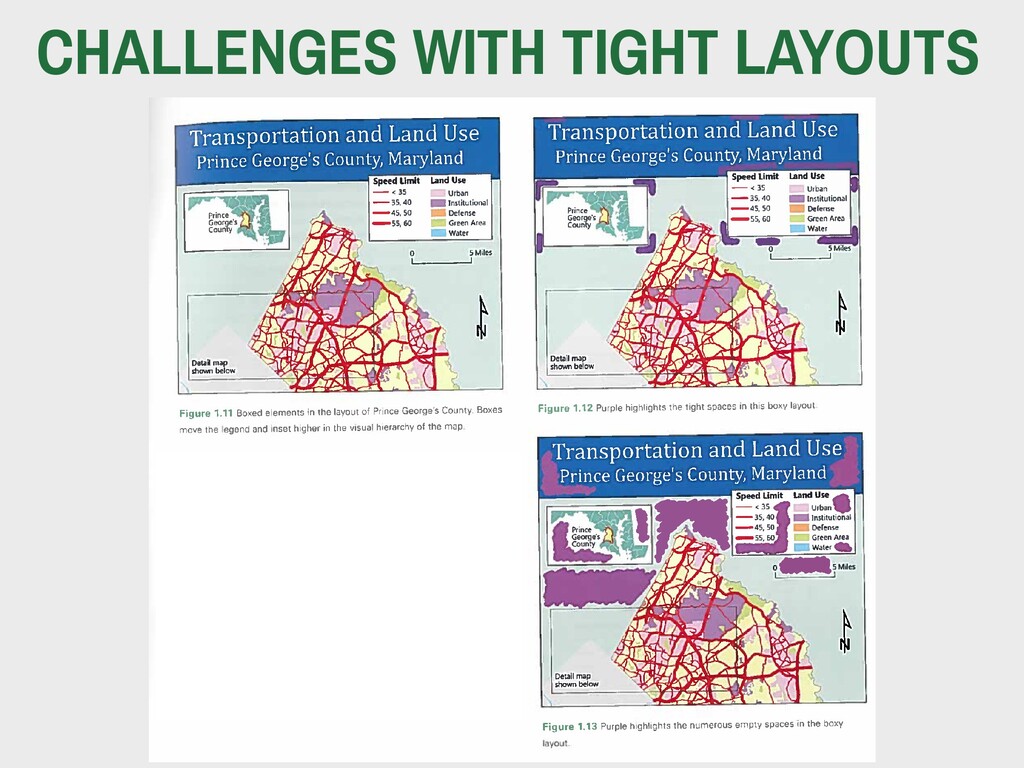
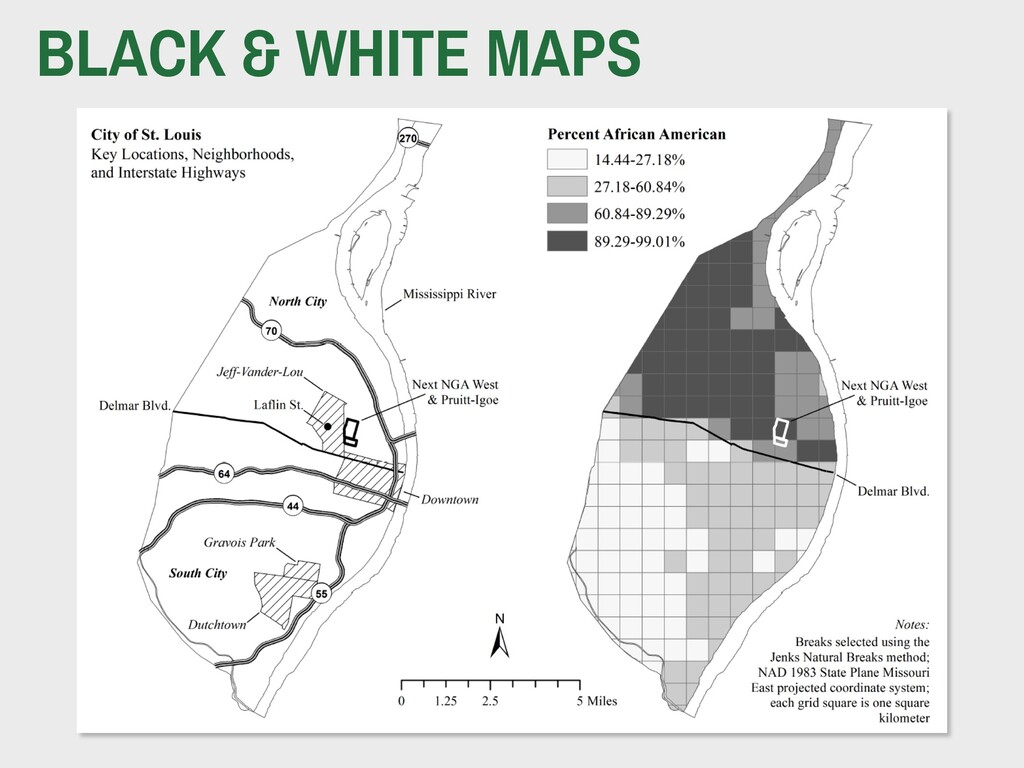
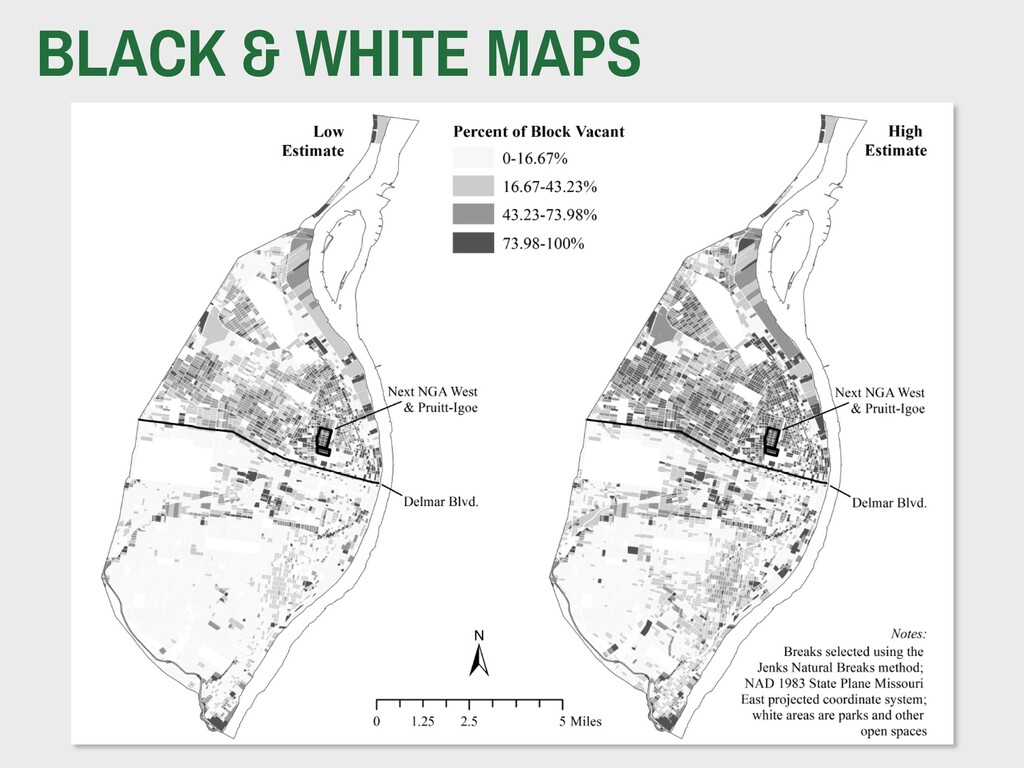
important graphic elements (features) ▸ Important features are known as “figure” ▸ Assign drab colors to the graphic elements that provide orientation or context ▸ Contextual features known as “ground” 1. FRONT MATTER VISUAL CONTRAST All features in figure Circles in figure, squares and lines in ground
IMPORTANT THAN THE SUBSTANCE OF YOUR WRITING. IT’S NOT. BUT TYPOGRAPHY CAN OPTIMIZE YOUR WRITING. TYPOGRAPHY CAN CREATE A BETTER FIRST IMPRESSION. TYPOGRAPHY CAN REINFORCE YOUR KEY POINTS. TYPOGRAPHY CAN EXTEND READER ATTENTION. WHEN YOU IGNORE TYPOGRAPHY, YOU’RE IGNORING AN OPPORTUNITY TO IMPROVE THE EFFECTIVENESS OF YOUR WRITING. Matthew Butterick Butterick’s Practical Typography (2010)
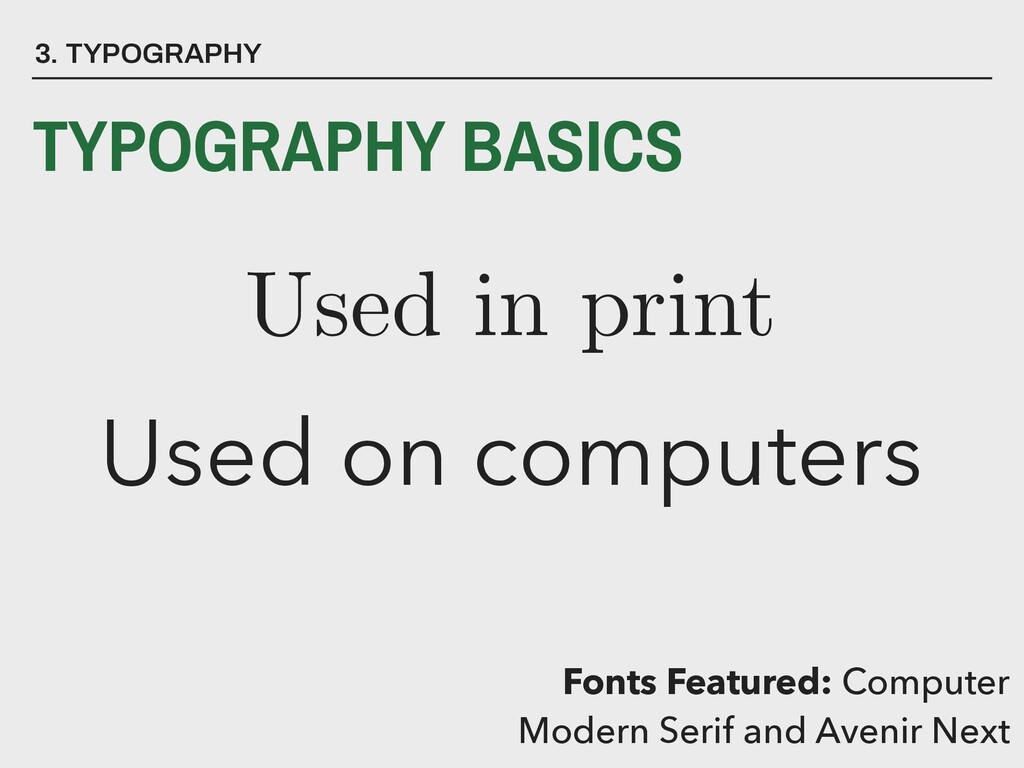
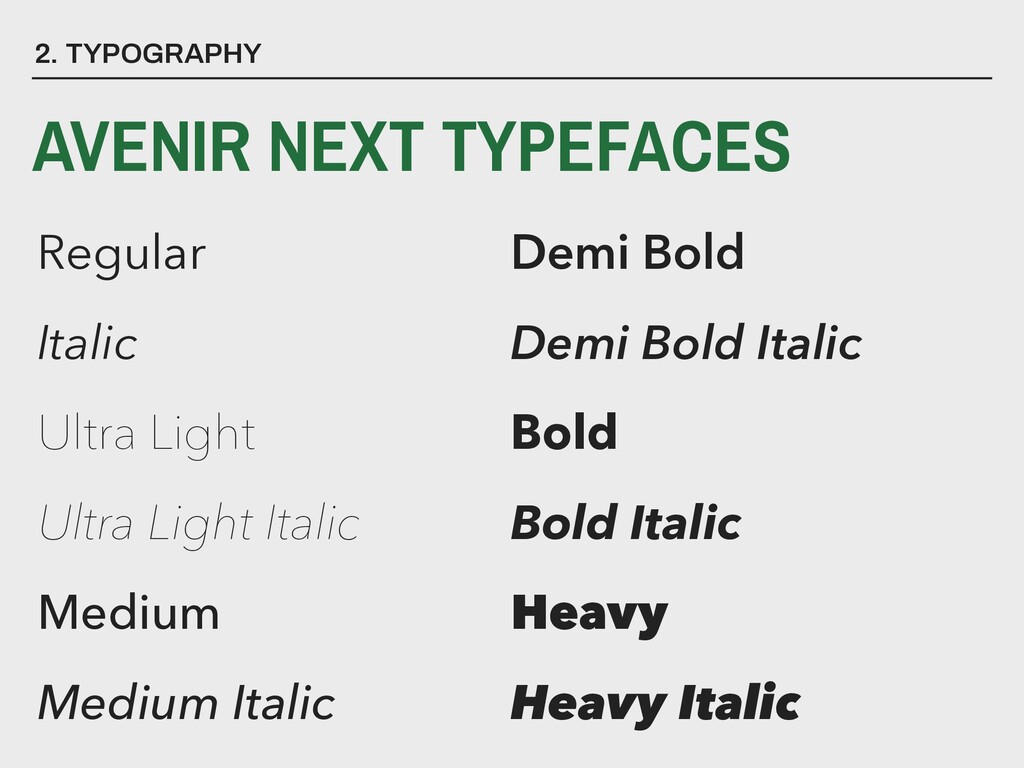
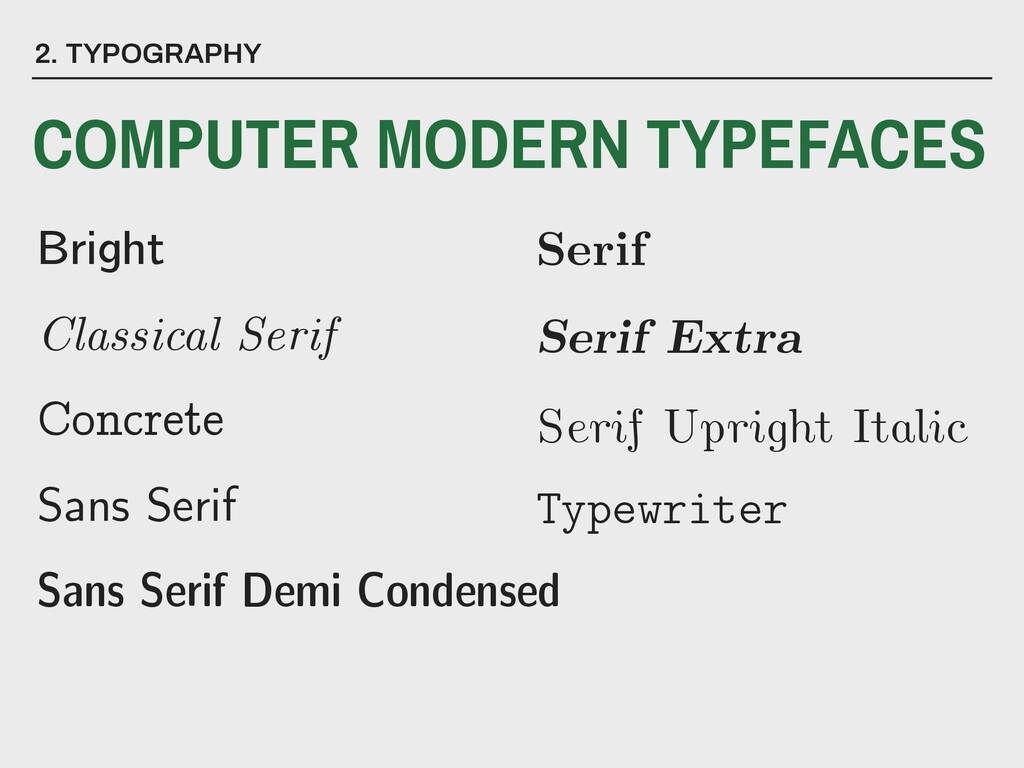
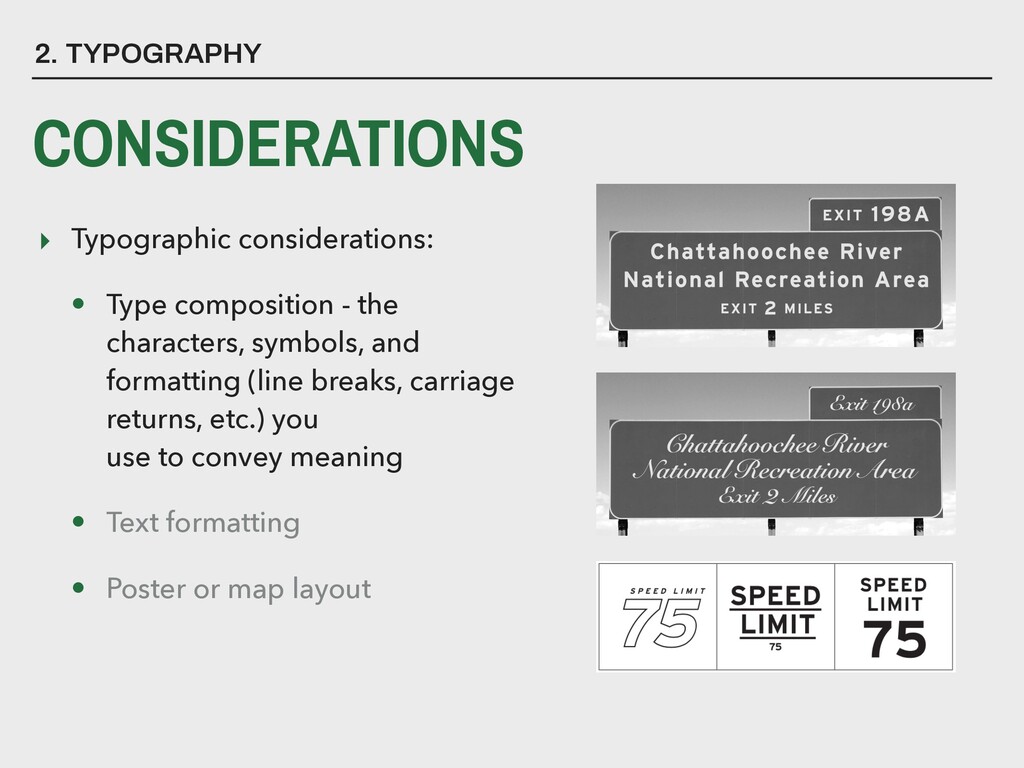
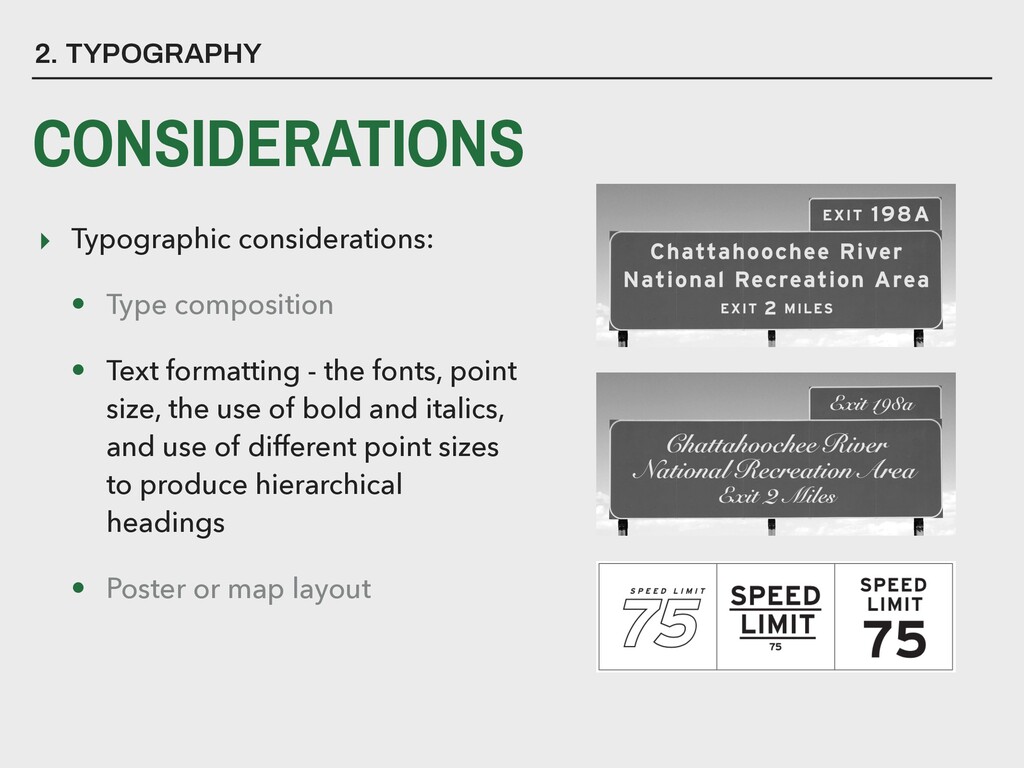
the fonts, point size, the use of bold and italics, and use of different point sizes to produce hierarchical headings • Poster or map layout 2. TYPOGRAPHY CONSIDERATIONS
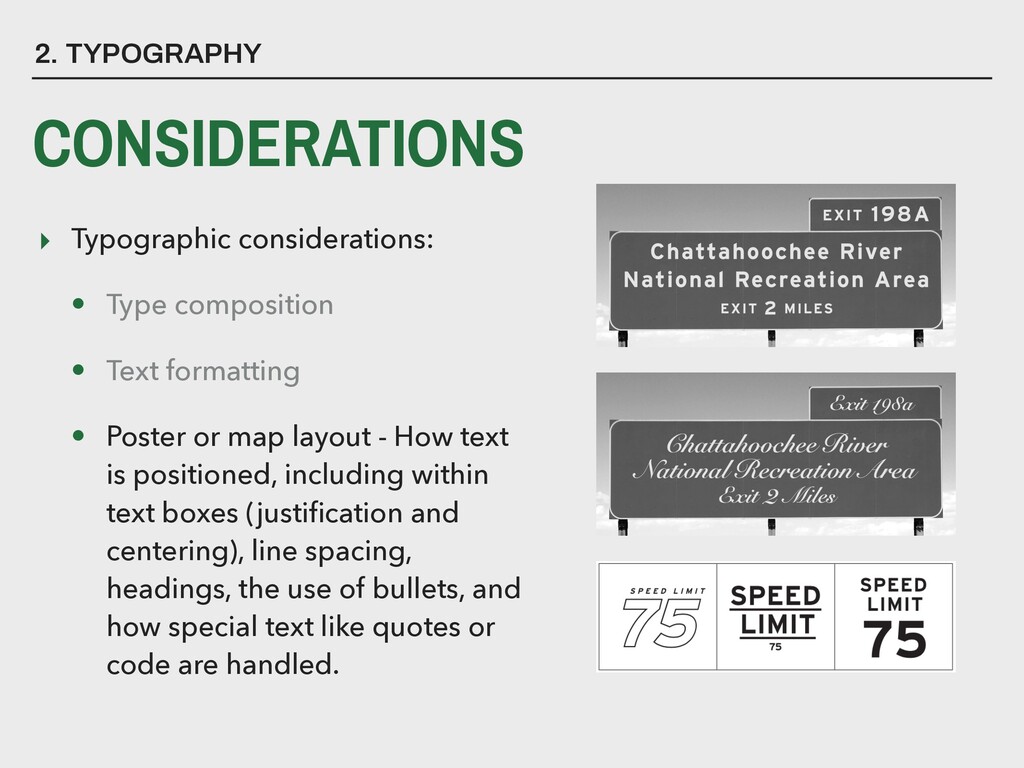
Poster or map layout - How text is positioned, including within text boxes (justification and centering), line spacing, headings, the use of bullets, and how special text like quotes or code are handled. 2. TYPOGRAPHY CONSIDERATIONS
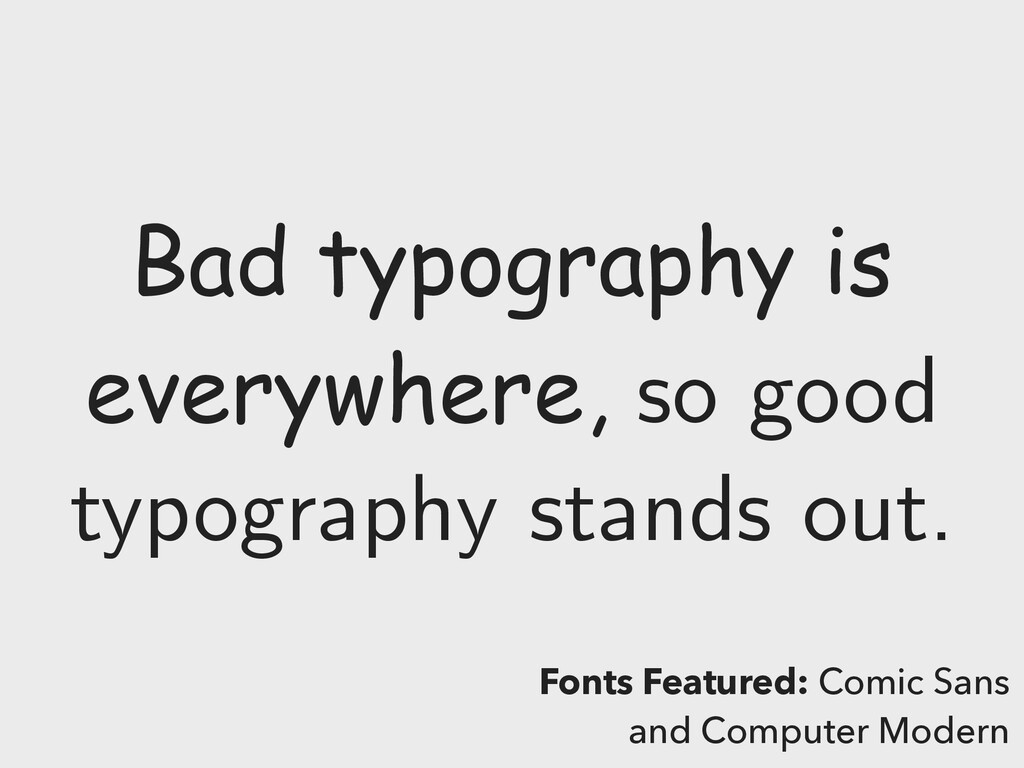
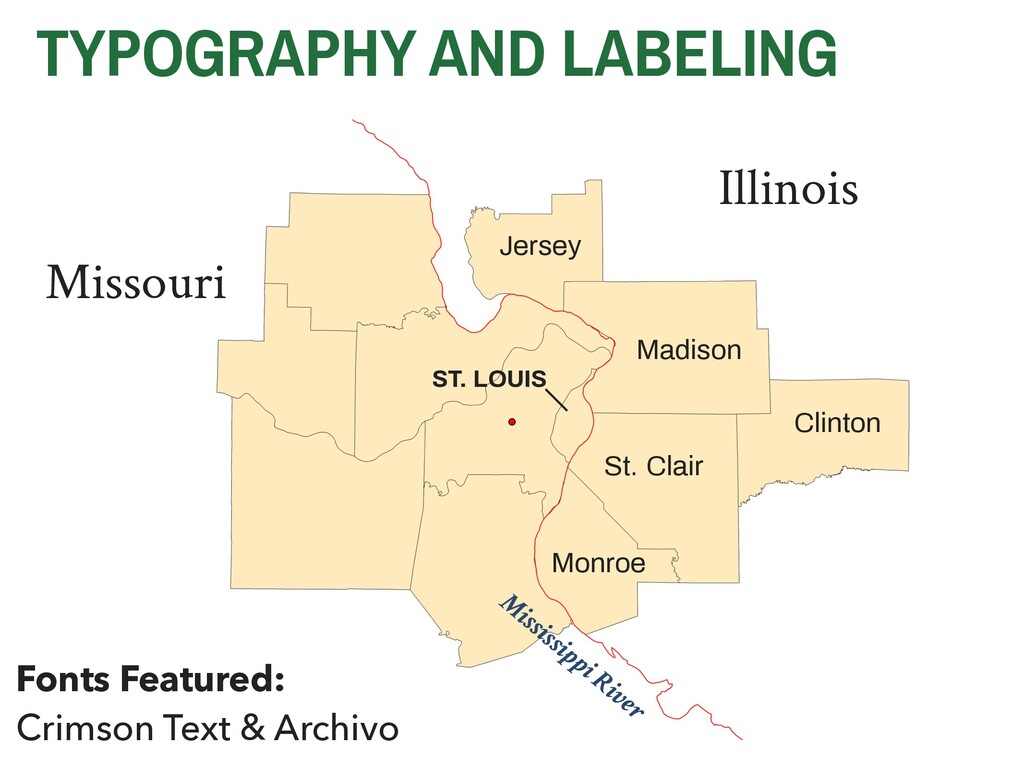
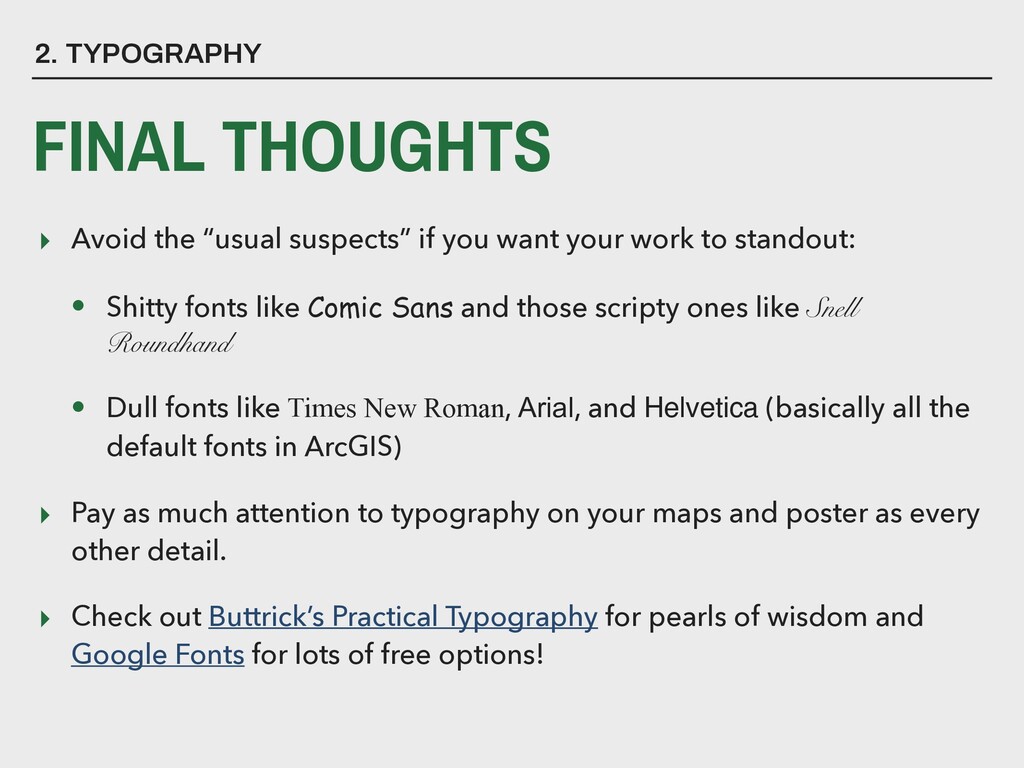
you want your work to standout: • Shitty fonts like Comic Sans and those scripty ones like Snell Roundhand • Dull fonts like Times New Roman, Arial, and Helvetica (basically all the default fonts in ArcGIS) ▸ Pay as much attention to typography on your maps and poster as every other detail. ▸ Check out Buttrick’s Practical Typography for pearls of wisdom and Google Fonts for lots of free options!
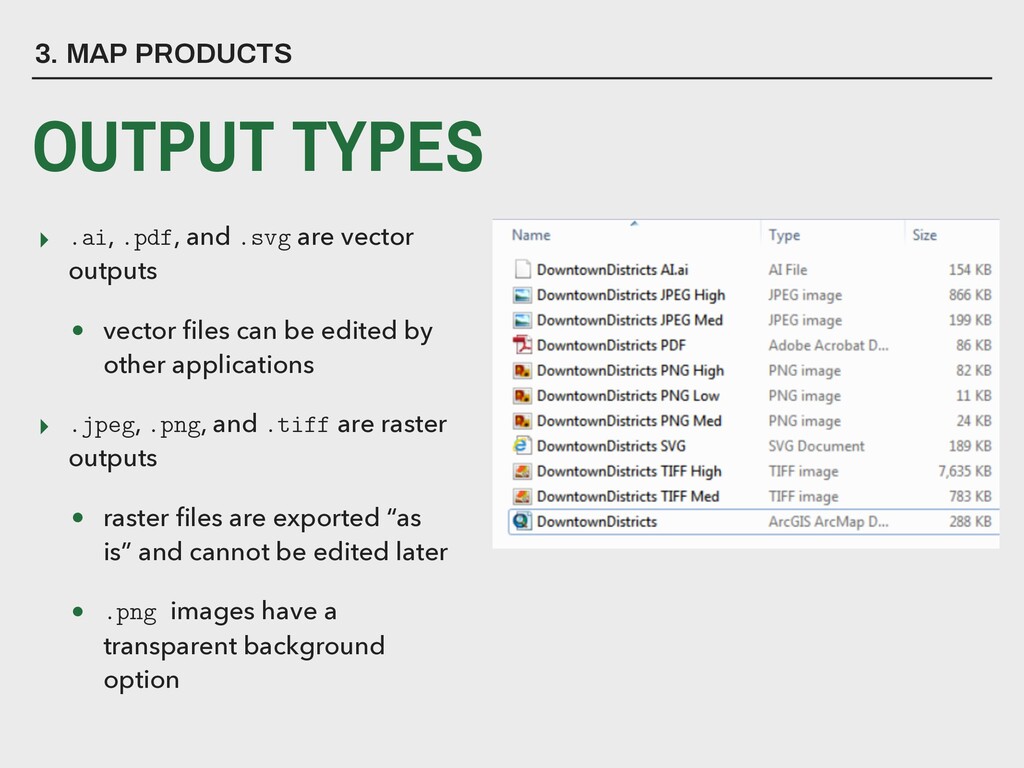
files can be edited by other applications ▸ .jpeg, .png, and .tiff are raster outputs • raster files are exported “as is” and cannot be edited later • .png images have a transparent background option 3. MAP PRODUCTS OUTPUT TYPES
in ArcGIS Pro ▸ Use standard sizes (8.5” x 11”, legal, 11”x17”) ▸ Can also use custom sizes like 3’ x 3’ or larger for wall maps with access to a large-format printer known as a plotter ▸ Export as .pdf from Arc with at least 300 dots per inch resolution
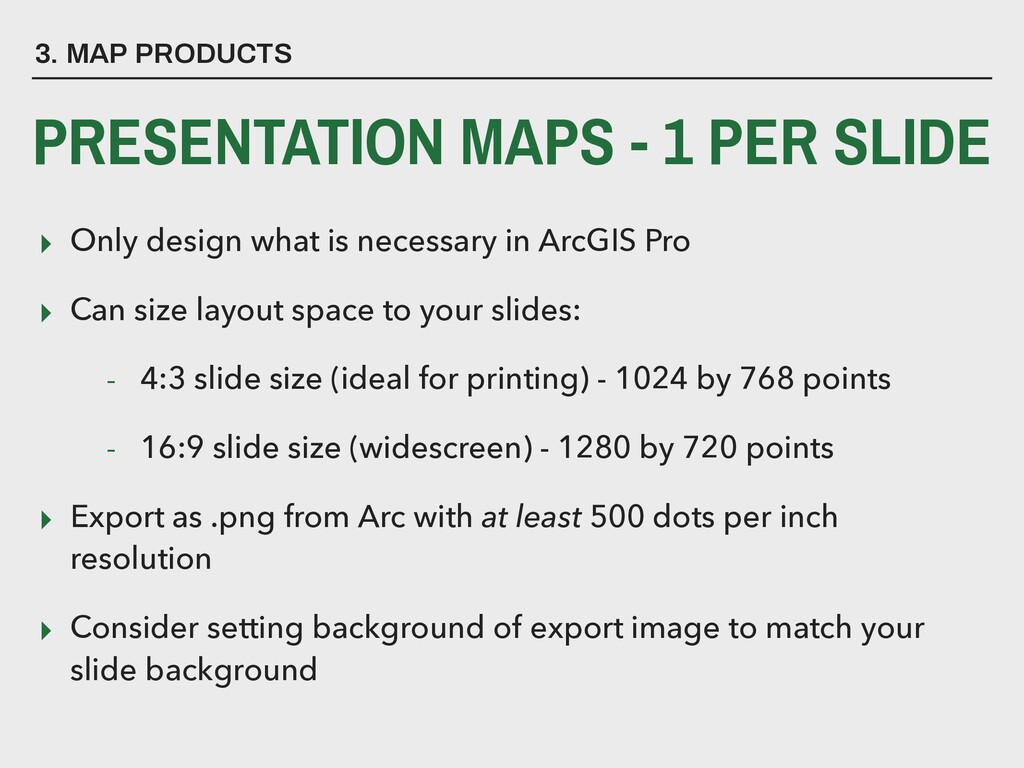
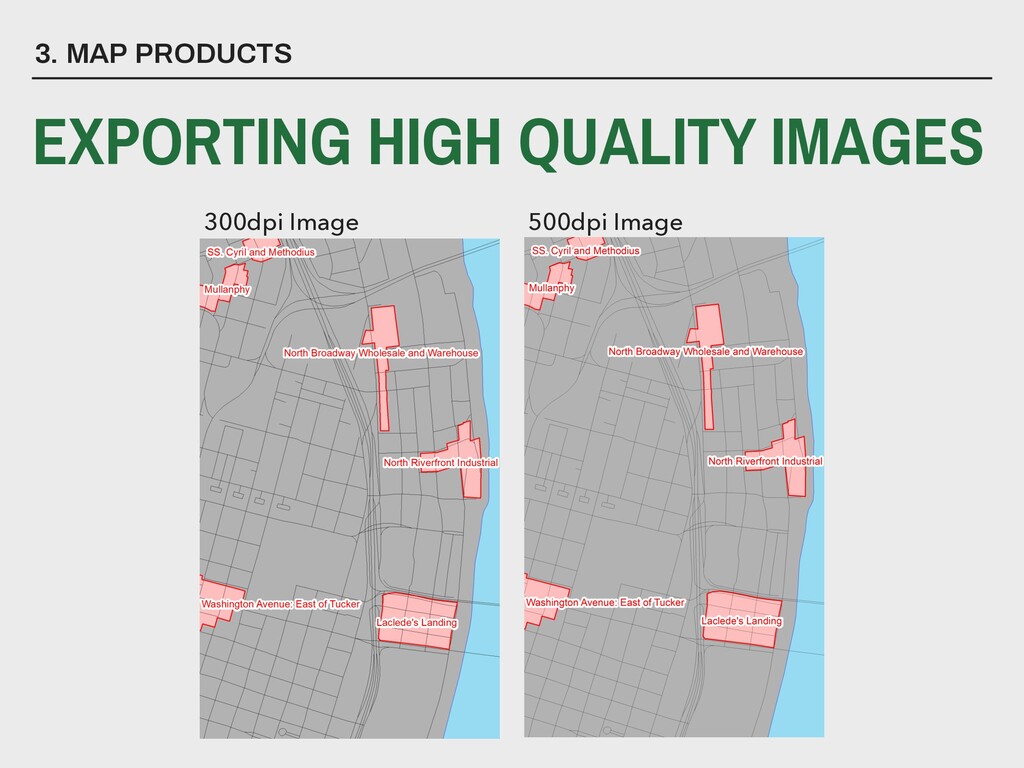
Only design what is necessary in ArcGIS Pro ▸ Can size layout space to your slides: - 4:3 slide size (ideal for printing) - 1024 by 768 points - 16:9 slide size (widescreen) - 1280 by 720 points ▸ Export as .png from Arc with at least 500 dots per inch resolution ▸ Consider setting background of export image to match your slide background
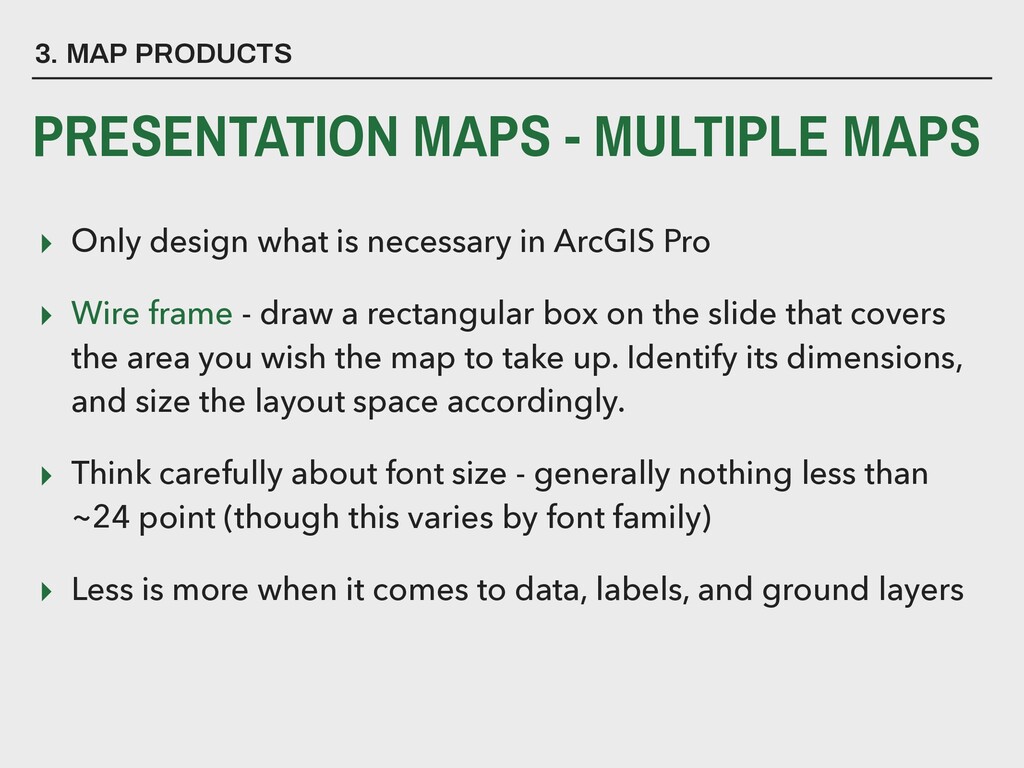
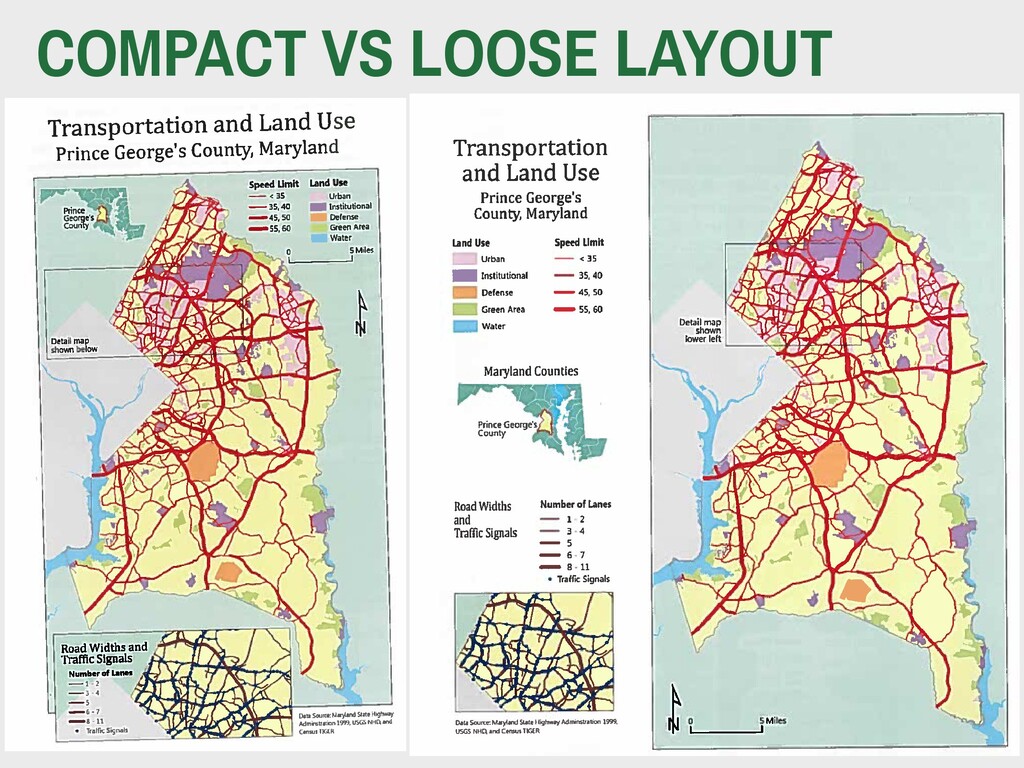
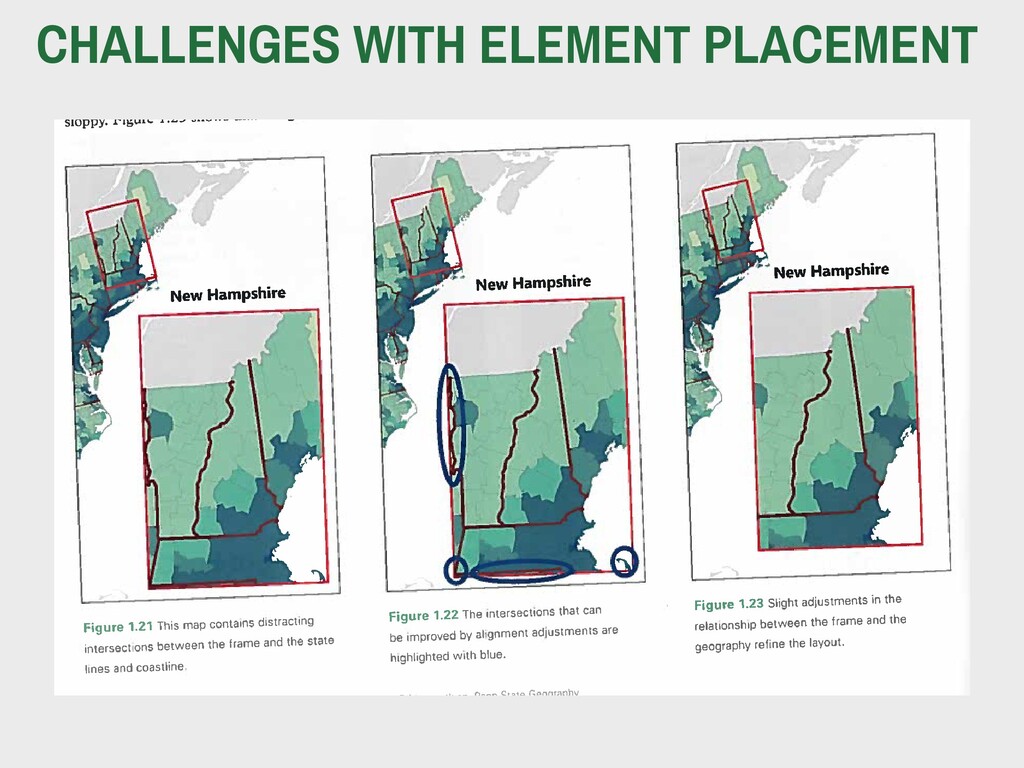
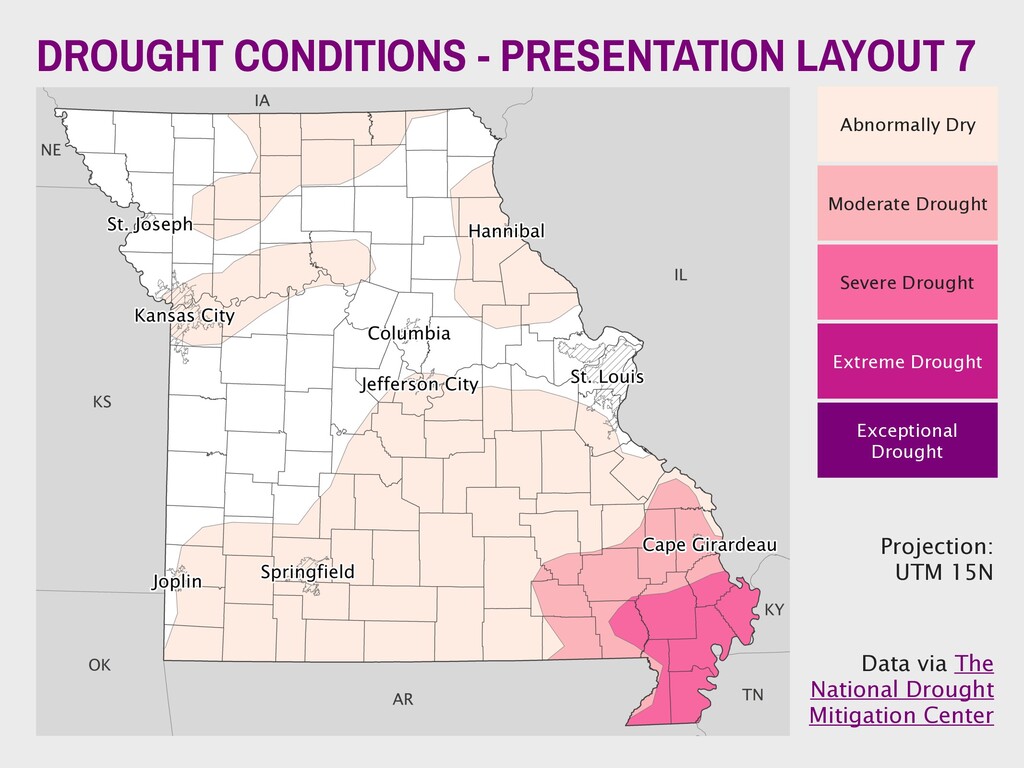
design what is necessary in ArcGIS Pro ▸ Wire frame - draw a rectangular box on the slide that covers the area you wish the map to take up. Identify its dimensions, and size the layout space accordingly. ▸ Think carefully about font size - generally nothing less than ~24 point (though this varies by font family) ▸ Less is more when it comes to data, labels, and ground layers
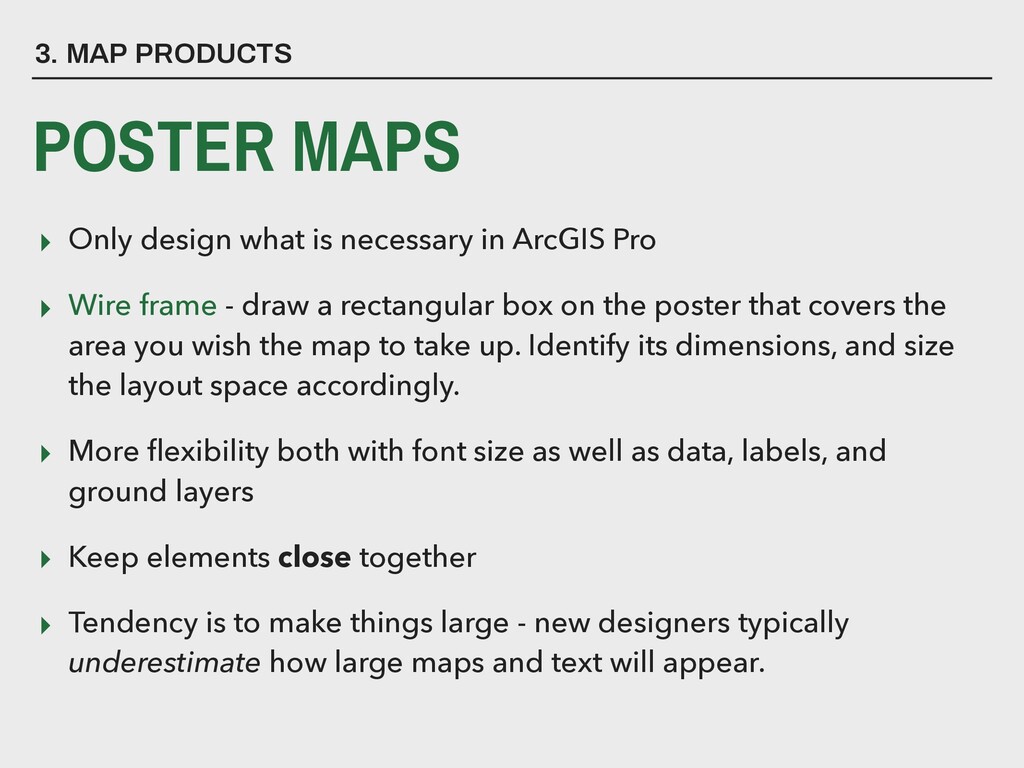
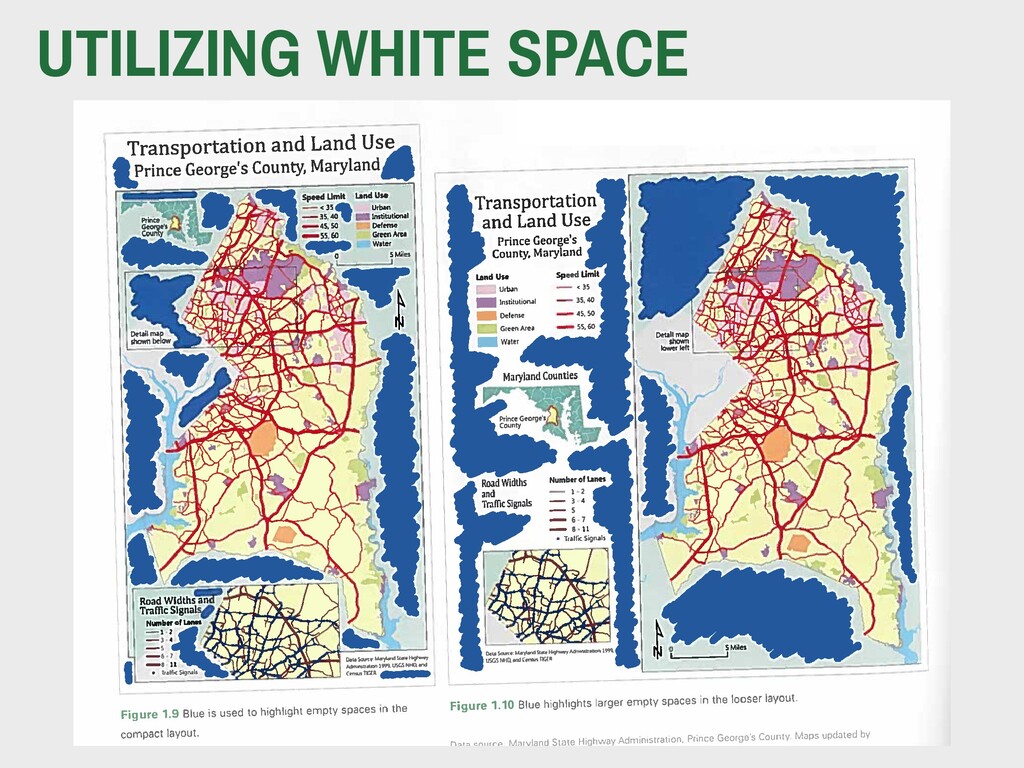
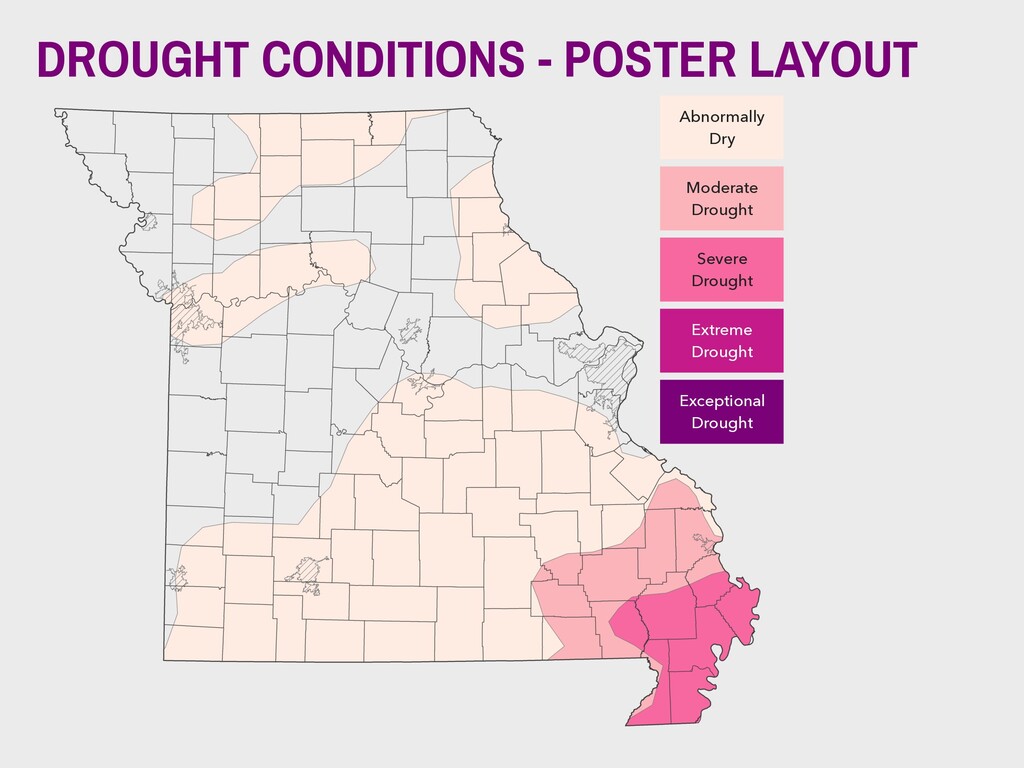
necessary in ArcGIS Pro ▸ Wire frame - draw a rectangular box on the poster that covers the area you wish the map to take up. Identify its dimensions, and size the layout space accordingly. ▸ More flexibility both with font size as well as data, labels, and ground layers ▸ Keep elements close together ▸ Tendency is to make things large - new designers typically underestimate how large maps and text will appear.
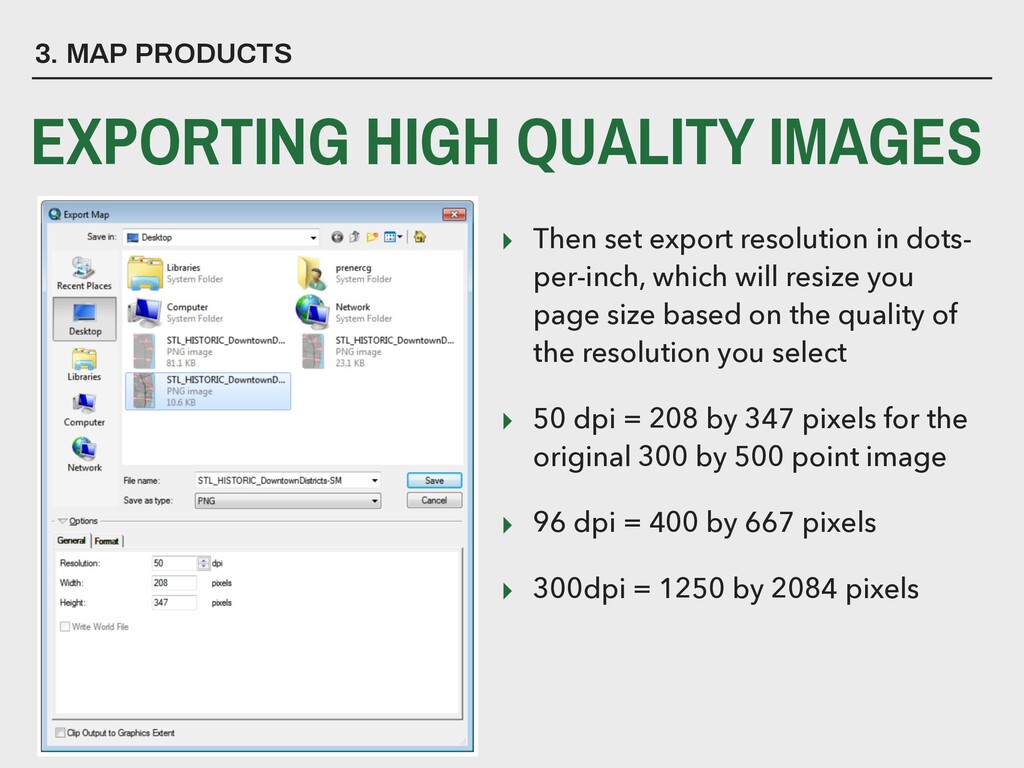
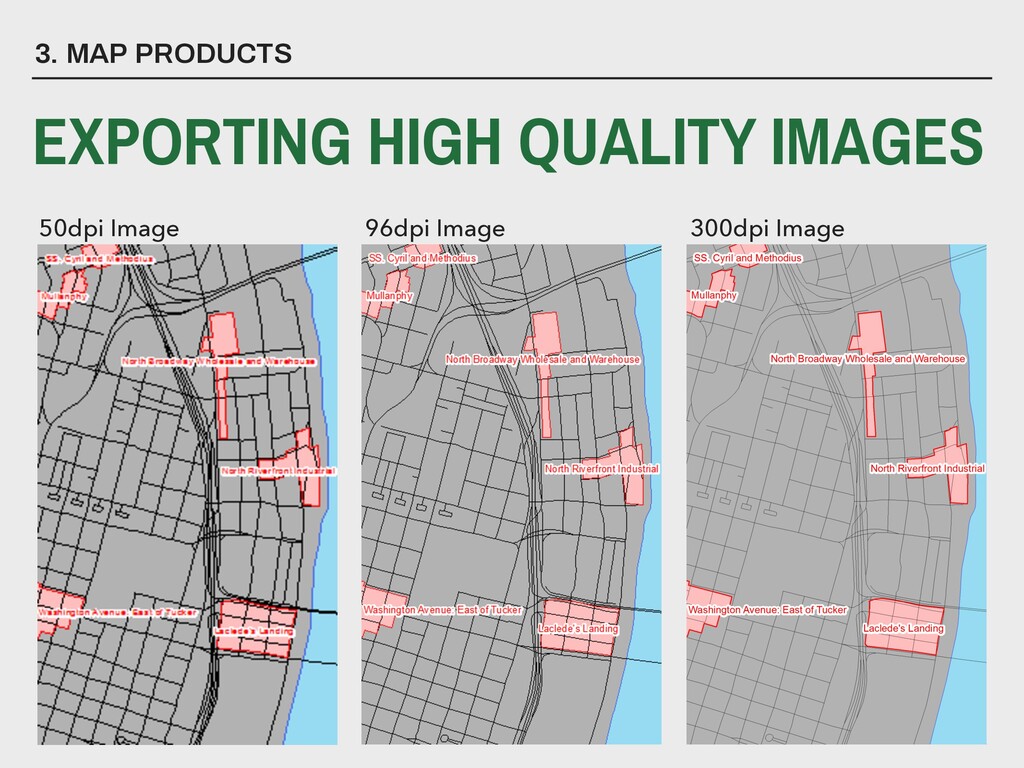
resize you page size based on the quality of the resolution you select ▸ 50 dpi = 208 by 347 pixels for the original 300 by 500 point image ▸ 96 dpi = 400 by 667 pixels ▸ 300dpi = 1250 by 2084 pixels 3. MAP PRODUCTS EXPORTING HIGH QUALITY IMAGES
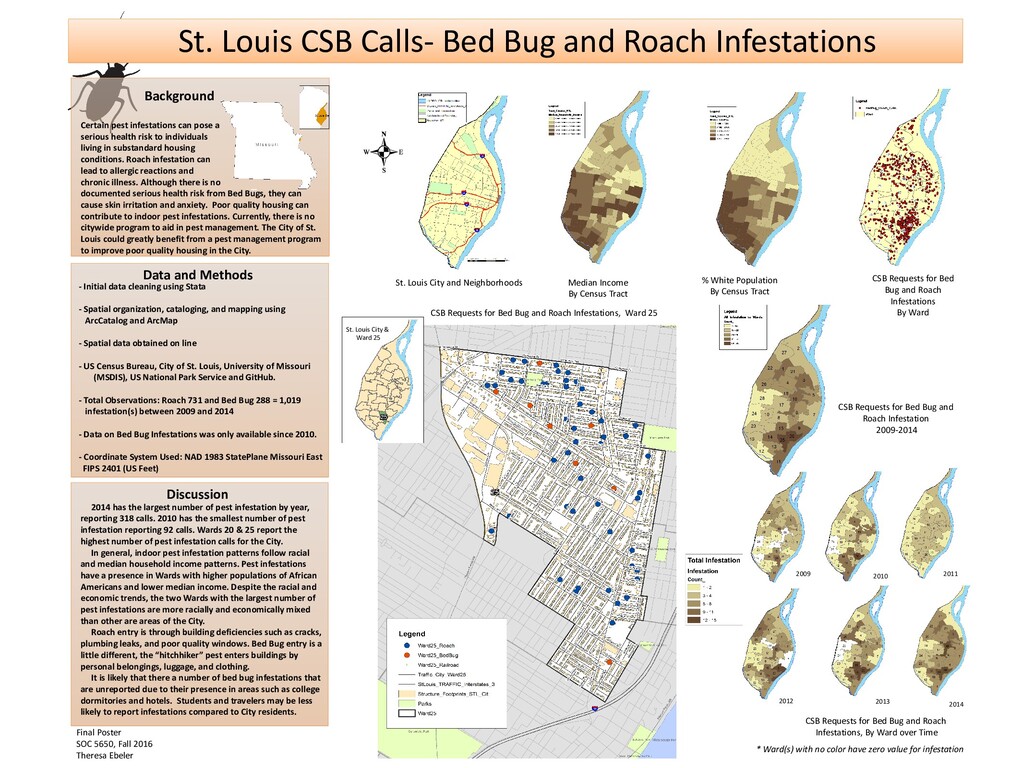
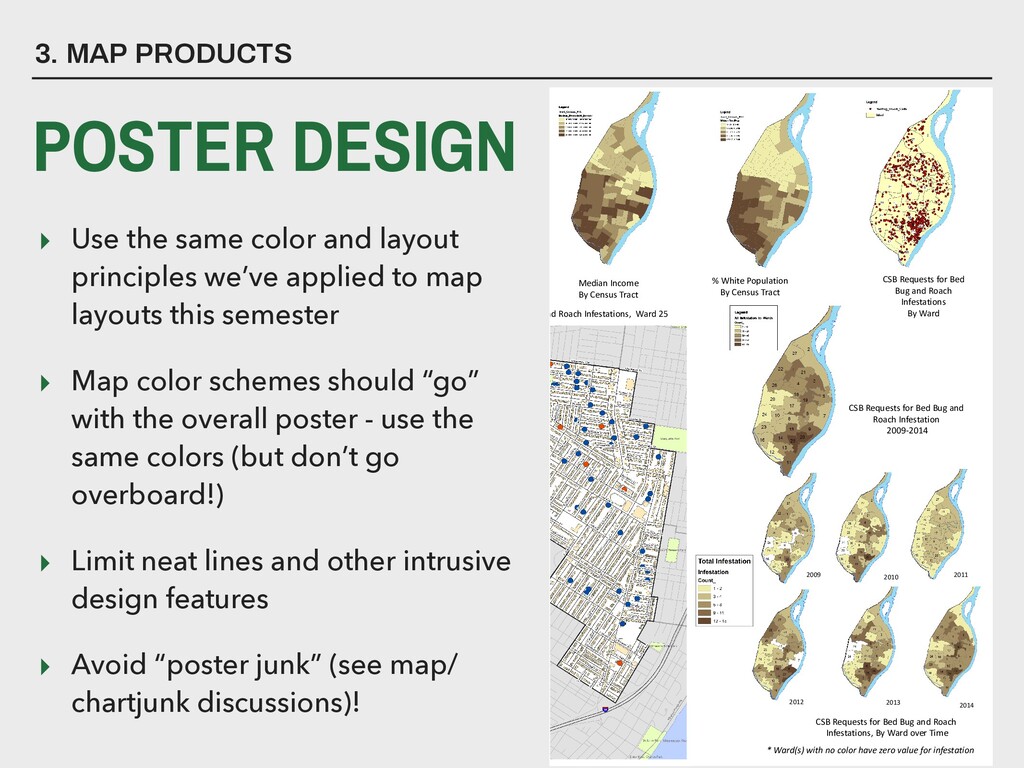
Data and Methods Final Poster SOC 5650, Fall 2016 Theresa Ebeler Discussion St. Louis City and Neighborhoods % White Population By Census Tract Median Income By Census Tract CSB Requests for Bed Bug and Roach Infestation 2009-2014 CSB Requests for Bed Bug and Roach Infestations By Ward CSB Requests for Bed Bug and Roach Infestations, By Ward over Time CSB Requests for Bed Bug and Roach Infestations, Ward 25 * Ward(s) with no color have zero value for infestation Certain pest infestations can pose a serious health risk to individuals living in substandard housing conditions. Roach infestation can lead to allergic reactions and chronic illness. Although there is no - Initial data cleaning using Stata - Spatial organization, cataloging, and mapping using ArcCatalog and ArcMap - Spatial data obtained on line - US Census Bureau, City of St. Louis, University of Missouri (MSDIS), US National Park Service and GitHub. - Total Observations: Roach 731 and Bed Bug 288 = 1,019 infestation(s) between 2009 and 2014 - Data on Bed Bug Infestations was only available since 2010. - Coordinate System Used: NAD 1983 StatePlane Missouri East FIPS 2401 (US Feet) 2014 has the largest number of pest infestation by year, reporting 318 calls. 2010 has the smallest number of pest infestation reporting 92 calls. Wards 20 & 25 report the highest number of pest infestation calls for the City. In general, indoor pest infestation patterns follow racial and median household income patterns. Pest infestations have a presence in Wards with higher populations of African Americans and lower median income. Despite the racial and economic trends, the two Wards with the largest number of pest infestations are more racially and economically mixed than other are areas of the City. Roach entry is through building deficiencies such as cracks, plumbing leaks, and poor quality windows. Bed Bug entry is a little different, the “hitchhiker” pest enters buildings by personal belongings, luggage, and clothing. It is likely that there a number of bed bug infestations that are unreported due to their presence in areas such as college dormitories and hotels. Students and travelers may be less likely to report infestations compared to City residents. documented serious health risk from Bed Bugs, they can cause skin irritation and anxiety. Poor quality housing can contribute to indoor pest infestations. Currently, there is no citywide program to aid in pest management. The City of St. Louis could greatly benefit from a pest management program to improve poor quality housing in the City. 2011 2010 2009 2014 2013 2012 St. Louis City & Ward 25
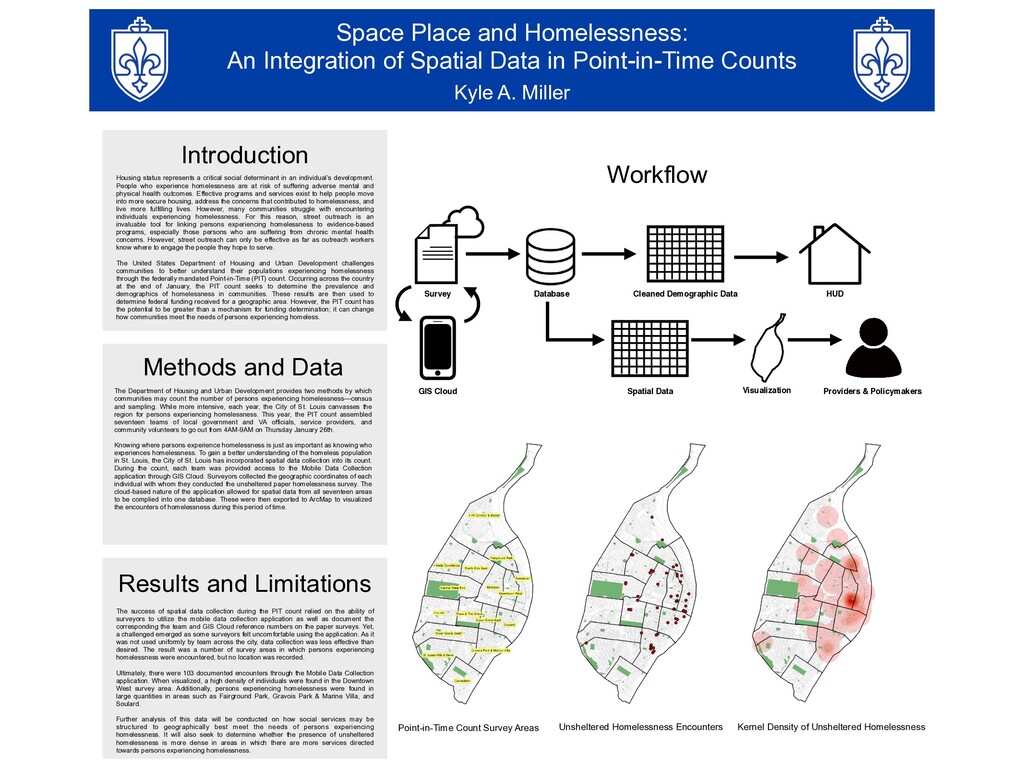
Point-in-Time Counts Results and Limitations Introduction Housing status represents a critical social determinant in an individual’s development. People who experience homelessness are at risk of suffering adverse mental and physical health outcomes. Effective programs and services exist to help people move into more secure housing, address the concerns that contributed to homelessness, and live more fulfilling lives. However, many communities struggle with encountering individuals experiencing homelessness. For this reason, street outreach is an invaluable tool for linking persons experiencing homelessness to evidence-based programs, especially those persons who are suffering from chronic mental health concerns. However, street outreach can only be effective as far as outreach workers know where to engage the people they hope to serve. The United States Department of Housing and Urban Development challenges communities to better understand their populations experiencing homelessness through the federally mandated Point-in-Time (PIT) count. Occurring across the country at the end of January, the PIT count seeks to determine the prevalence and demographics of homelessness in communities. These results are then used to determine federal funding received for a geographic area. However, the PIT count has the potential to be greater than a mechanism for funding determination; it can change how communities meet the needs of persons experiencing homeless. Methods and Data The Department of Housing and Urban Development provides two methods by which communities may count the number of persons experiencing homelessness—census and sampling. While more intensive, each year, the City of St. Louis canvasses the region for persons experiencing homelessness. This year, the PIT count assembled seventeen teams of local government and VA officials, service providers, and community volunteers to go out from 4AM-9AM on Thursday January 26th. Knowing where persons experience homelessness is just as important as knowing who experiences homelessness. To gain a better understanding of the homeless population in St. Louis, the City of St. Louis has incorporated spatial data collection into its count. During the count, each team was provided access to the Mobile Data Collection application through GIS Cloud. Surveyors collected the geographic coordinates of each individual with whom they conducted the unsheltered paper homelessness survey. The cloud-based nature of the application allowed for spatial data from all seventeen areas to be complied into one database. These were then exported to ArcMap to visualized the encounters of homelessness during this period of time. Point-in-Time Count Survey Areas The success of spatial data collection during the PIT count relied on the ability of surveyors to utilize the mobile data collection application as well as document the corresponding the team and GIS Cloud reference numbers on the paper surveys. Yet, a challenged emerged as some surveyors felt uncomfortable using the application. As it was not used uniformly by team across the city, data collection was less effective than desired. The result was a number of survey areas in which persons experiencing homelessness were encountered, but no location was recorded. Ultimately, there were 103 documented encounters through the Mobile Data Collection application. When visualized, a high density of individuals were found in the Downtown West survey area. Additionally, persons experiencing homelessness were found in large quantities in areas such as Fairground Park, Gravois Park & Marine Villa, and Soulard. Further analysis of this data will be conducted on how social services may be structured to geographically best meet the needs of persons experiencing homelessness. It will also seek to determine whether the presence of unsheltered homelessness is more dense in areas in which there are more services directed towards persons experiencing homelessness. Kyle A. Miller Workflow Survey Database Cleaned Demographic Data HUD Spatial Data Visualization GIS Cloud Providers & Policymakers Unsheltered Homelessness Encounters Kernel Density of Unsheltered Homelessness
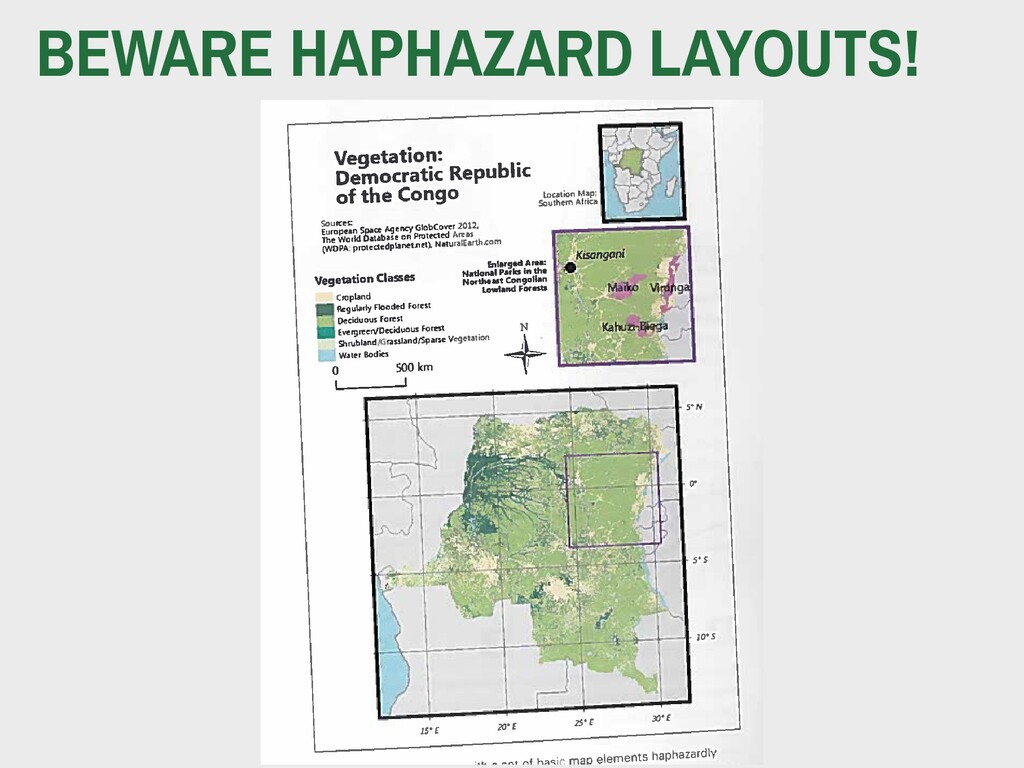
to map layouts this semester ▸ Map color schemes should “go” with the overall poster - use the same colors (but don’t go overboard!) ▸ Limit neat lines and other intrusive design features ▸ Avoid “poster junk” (see map/ chartjunk discussions)! 3. MAP PRODUCTS POSTER DESIGN St. Louis CSB Calls- Bed Bug and Roach Infestations Background Data and Methods Final Poster SOC 5650, Fall 2016 Theresa Ebeler Discussion St. Louis City and Neighborhoods % White Population By Census Tract Median Income By Census Tract CSB Requests for Bed Bug and Roach Infestation 2009-2014 CSB Requests for Bed Bug and Roach Infestations By Ward CSB Requests for Bed Bug and Roach Infestations, By Ward over Time CSB Requests for Bed Bug and Roach Infestations, Ward 25 * Ward(s) with no color have zero value for infestation Certain pest infestations can pose a serious health risk to individuals living in substandard housing conditions. Roach infestation can lead to allergic reactions and chronic illness. Although there is no - Initial data cleaning using Stata - Spatial organization, cataloging, and mapping using ArcCatalog and ArcMap - Spatial data obtained on line - US Census Bureau, City of St. Louis, University of Missouri (MSDIS), US National Park Service and GitHub. - Total Observations: Roach 731 and Bed Bug 288 = 1,019 infestation(s) between 2009 and 2014 - Data on Bed Bug Infestations was only available since 2010. - Coordinate System Used: NAD 1983 StatePlane Missouri East FIPS 2401 (US Feet) 2014 has the largest number of pest infestation by year, reporting 318 calls. 2010 has the smallest number of pest infestation reporting 92 calls. Wards 20 & 25 report the highest number of pest infestation calls for the City. In general, indoor pest infestation patterns follow racial and median household income patterns. Pest infestations have a presence in Wards with higher populations of African Americans and lower median income. Despite the racial and economic trends, the two Wards with the largest number of pest infestations are more racially and economically mixed than other are areas of the City. Roach entry is through building deficiencies such as cracks, plumbing leaks, and poor quality windows. Bed Bug entry is a little different, the “hitchhiker” pest enters buildings by personal belongings, luggage, and clothing. It is likely that there a number of bed bug infestations that are unreported due to their presence in areas such as college dormitories and hotels. Students and travelers may be less likely to report infestations compared to City residents. documented serious health risk from Bed Bugs, they can cause skin irritation and anxiety. Poor quality housing can contribute to indoor pest infestations. Currently, there is no citywide program to aid in pest management. The City of St. Louis could greatly benefit from a pest management program to improve poor quality housing in the City. 2011 2010 2009 2014 2013 2012 St. Louis City & Ward 25
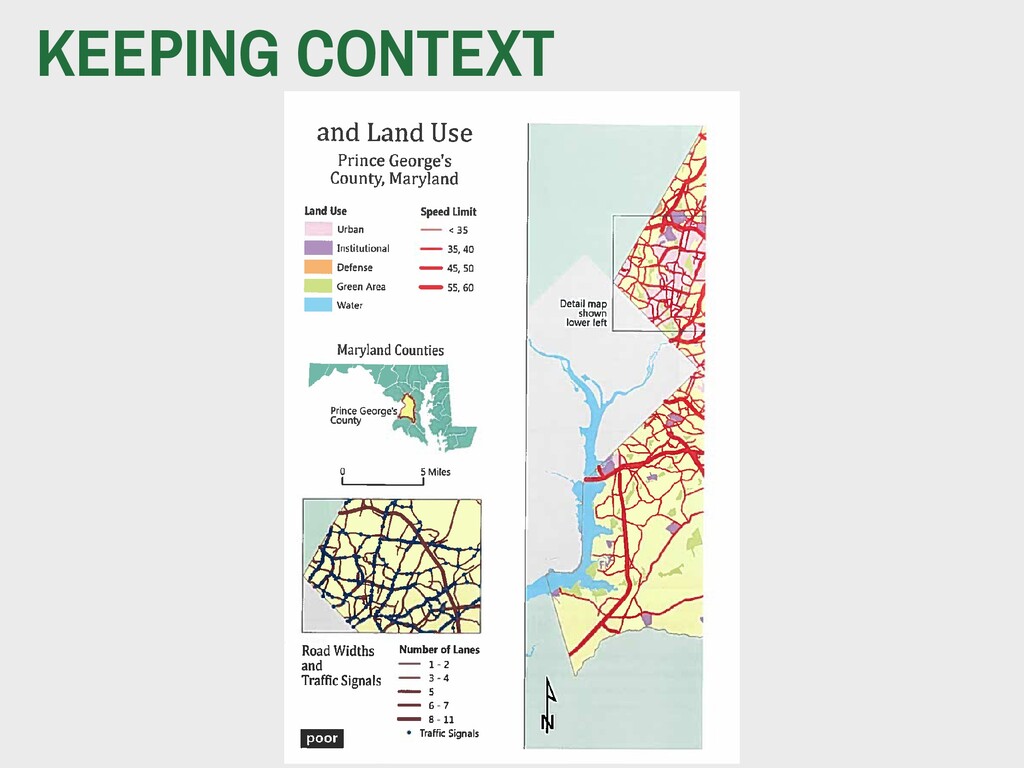
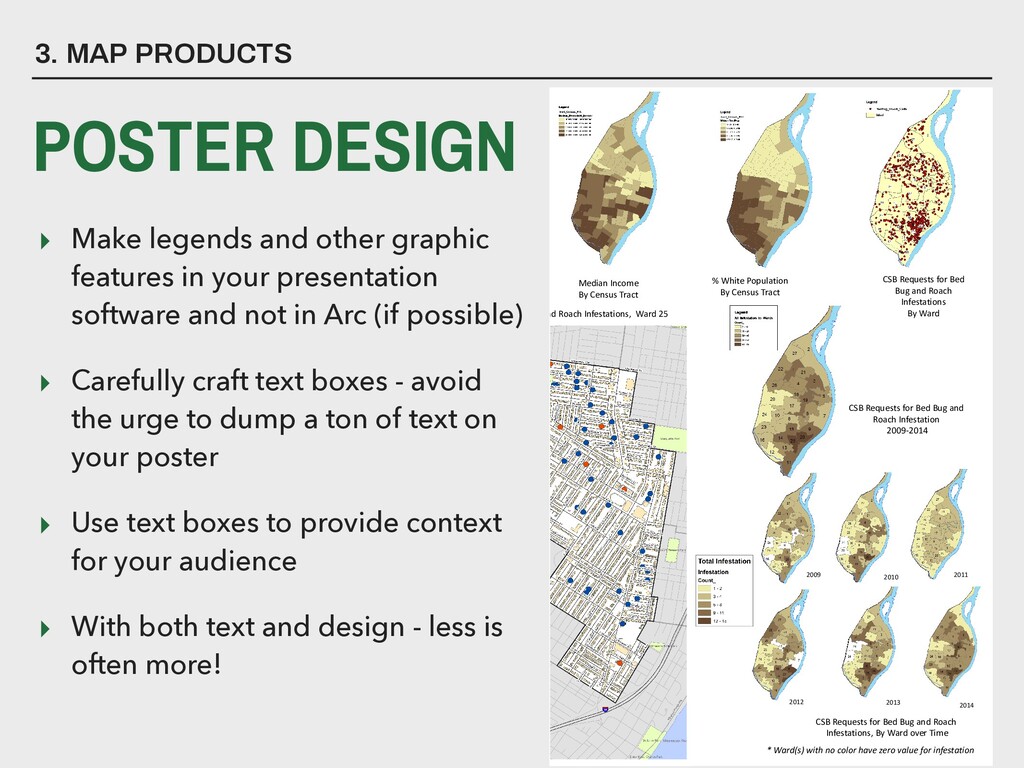
software and not in Arc (if possible) ▸ Carefully craft text boxes - avoid the urge to dump a ton of text on your poster ▸ Use text boxes to provide context for your audience ▸ With both text and design - less is often more! 3. MAP PRODUCTS POSTER DESIGN St. Louis CSB Calls- Bed Bug and Roach Infestations Background Data and Methods Final Poster SOC 5650, Fall 2016 Theresa Ebeler Discussion St. Louis City and Neighborhoods % White Population By Census Tract Median Income By Census Tract CSB Requests for Bed Bug and Roach Infestation 2009-2014 CSB Requests for Bed Bug and Roach Infestations By Ward CSB Requests for Bed Bug and Roach Infestations, By Ward over Time CSB Requests for Bed Bug and Roach Infestations, Ward 25 * Ward(s) with no color have zero value for infestation Certain pest infestations can pose a serious health risk to individuals living in substandard housing conditions. Roach infestation can lead to allergic reactions and chronic illness. Although there is no - Initial data cleaning using Stata - Spatial organization, cataloging, and mapping using ArcCatalog and ArcMap - Spatial data obtained on line - US Census Bureau, City of St. Louis, University of Missouri (MSDIS), US National Park Service and GitHub. - Total Observations: Roach 731 and Bed Bug 288 = 1,019 infestation(s) between 2009 and 2014 - Data on Bed Bug Infestations was only available since 2010. - Coordinate System Used: NAD 1983 StatePlane Missouri East FIPS 2401 (US Feet) 2014 has the largest number of pest infestation by year, reporting 318 calls. 2010 has the smallest number of pest infestation reporting 92 calls. Wards 20 & 25 report the highest number of pest infestation calls for the City. In general, indoor pest infestation patterns follow racial and median household income patterns. Pest infestations have a presence in Wards with higher populations of African Americans and lower median income. Despite the racial and economic trends, the two Wards with the largest number of pest infestations are more racially and economically mixed than other are areas of the City. Roach entry is through building deficiencies such as cracks, plumbing leaks, and poor quality windows. Bed Bug entry is a little different, the “hitchhiker” pest enters buildings by personal belongings, luggage, and clothing. It is likely that there a number of bed bug infestations that are unreported due to their presence in areas such as college dormitories and hotels. Students and travelers may be less likely to report infestations compared to City residents. documented serious health risk from Bed Bugs, they can cause skin irritation and anxiety. Poor quality housing can contribute to indoor pest infestations. Currently, there is no citywide program to aid in pest management. The City of St. Louis could greatly benefit from a pest management program to improve poor quality housing in the City. 2011 2010 2009 2014 2013 2012 St. Louis City & Ward 25
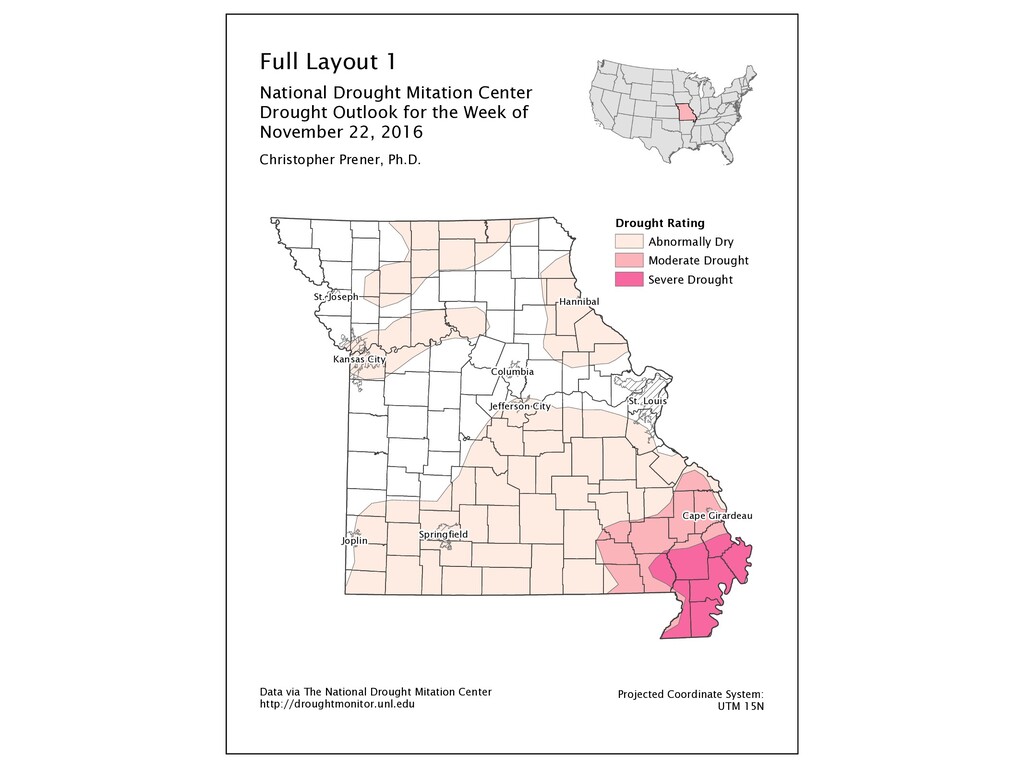
City Cape Girardeau Hannibal Drought Rating Abnormally Dry Moderate Drought Severe Drought Full Layout 1 National Drought Mitation Center Drought Outlook for the Week of November 22, 2016 Data via The National Drought Mitation Center http://droughtmonitor.unl.edu Projected Coordinate System: UTM 15N Christopher Prener, Ph.D.
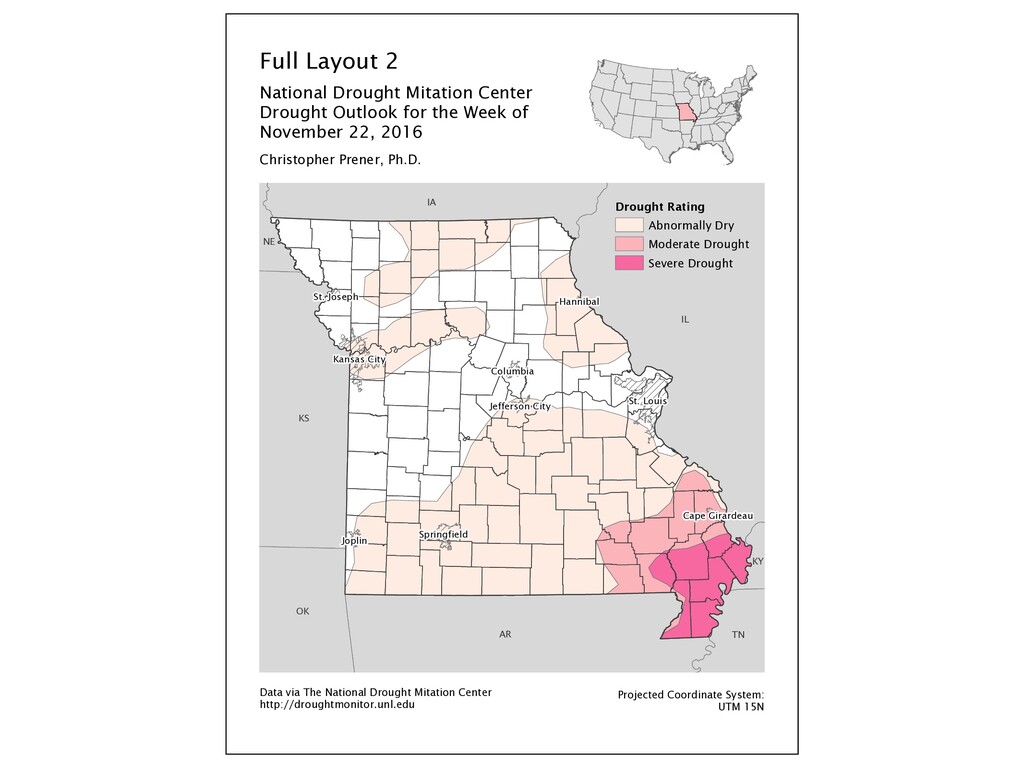
City Cape Girardeau Hannibal TN OK NE KY KS IL IA AR Drought Rating Abnormally Dry Moderate Drought Severe Drought Full Layout 2 National Drought Mitation Center Drought Outlook for the Week of November 22, 2016 Data via The National Drought Mitation Center http://droughtmonitor.unl.edu Projected Coordinate System: UTM 15N Christopher Prener, Ph.D.
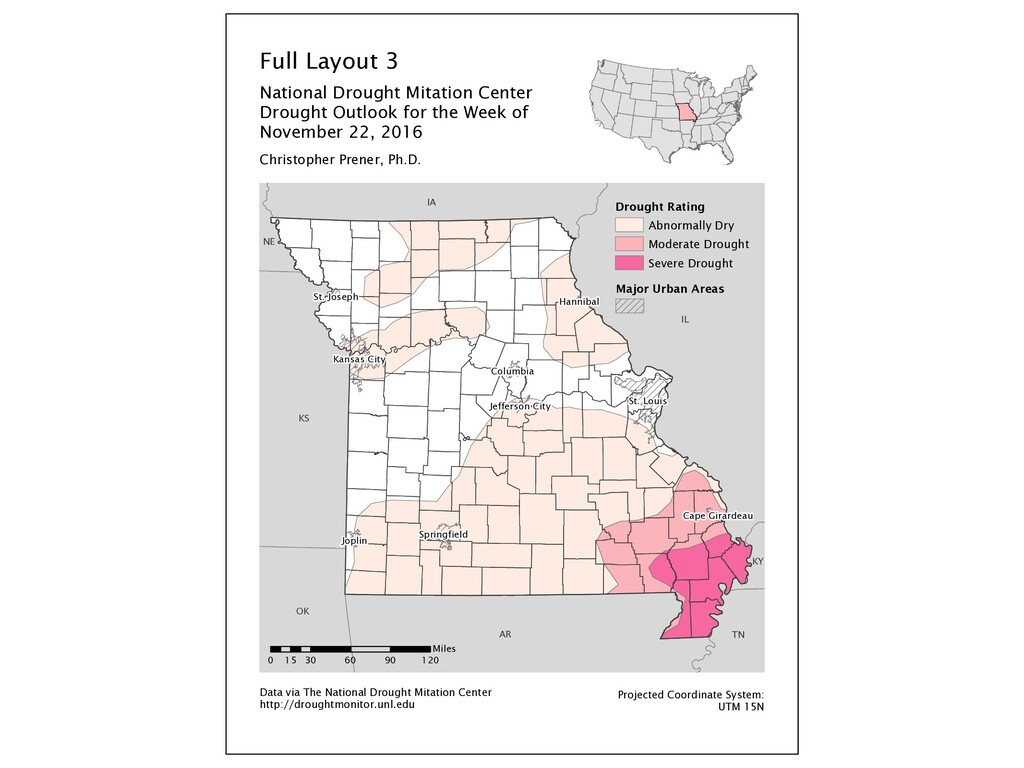
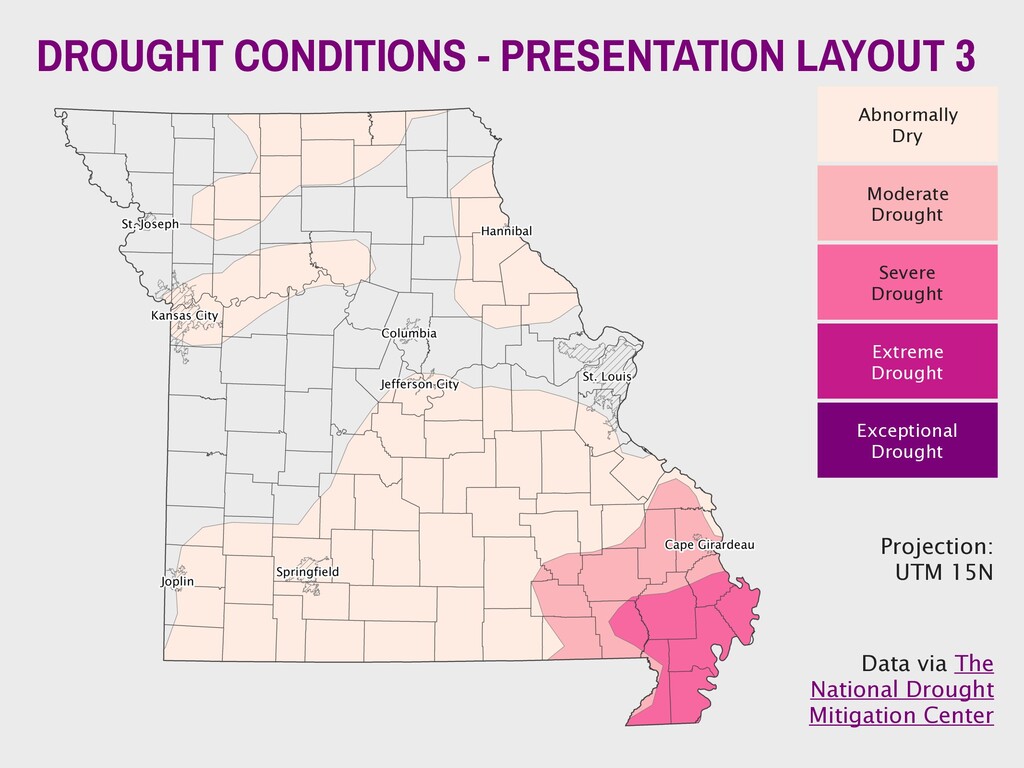
City Cape Girardeau Hannibal TN OK NE KY KS IL IA AR Drought Rating Abnormally Dry Moderate Drought Severe Drought Full Layout 3 National Drought Mitation Center Drought Outlook for the Week of November 22, 2016 Data via The National Drought Mitation Center http://droughtmonitor.unl.edu Projected Coordinate System: UTM 15N Christopher Prener, Ph.D. Major Urban Areas 0 30 60 90 120 15 Miles
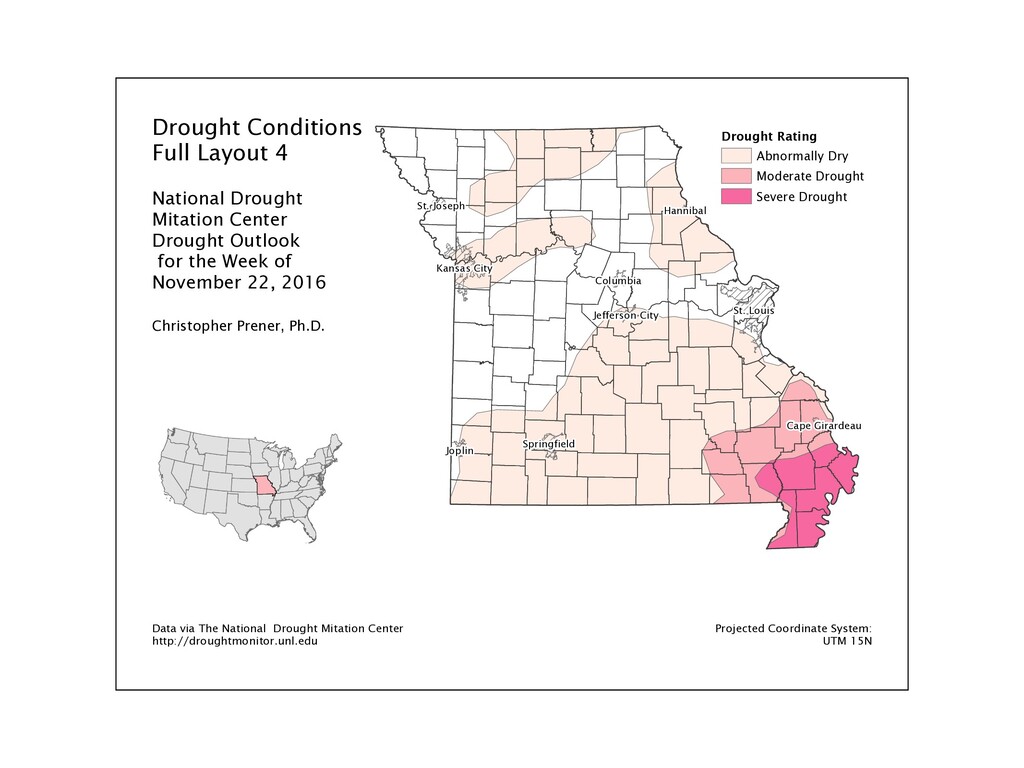
City Cape Girardeau Hannibal Drought Rating Abnormally Dry Moderate Drought Severe Drought Drought Conditions Full Layout 4 National Drought Mitation Center Drought Outlook for the Week of November 22, 2016 Data via The National Drought Mitation Center http://droughtmonitor.unl.edu Projected Coordinate System: UTM 15N Christopher Prener, Ph.D.
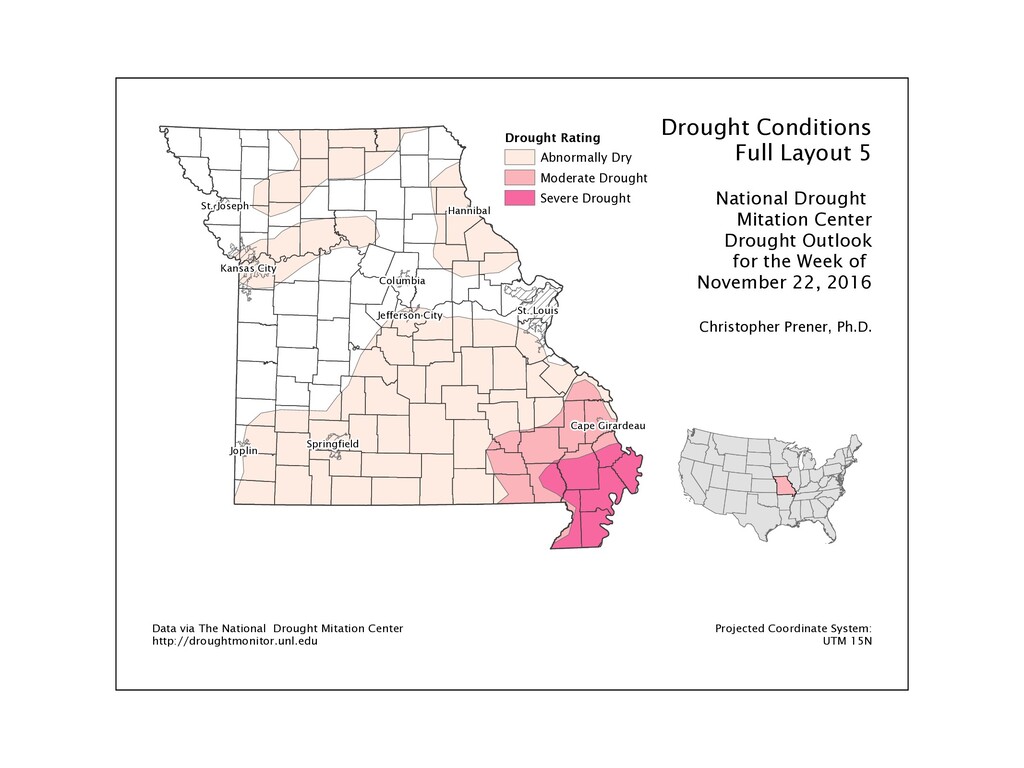
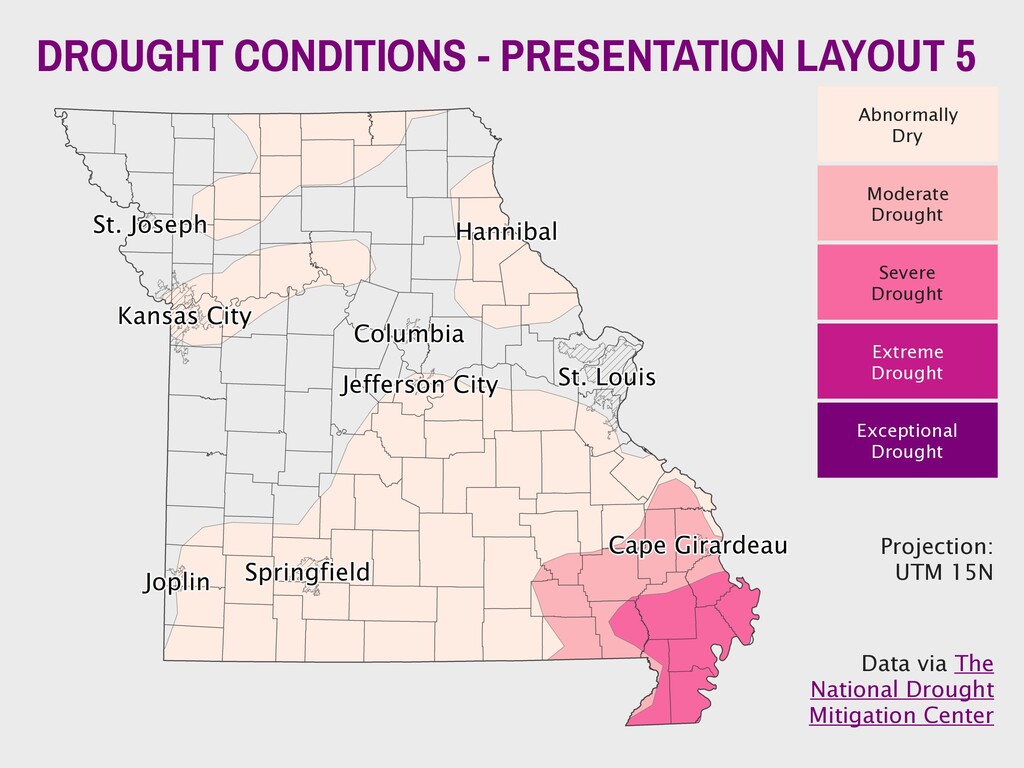
City Cape Girardeau Hannibal Drought Rating Abnormally Dry Moderate Drought Severe Drought Drought Conditions Full Layout 5 National Drought Mitation Center Drought Outlook for the Week of November 22, 2016 Data via The National Drought Mitation Center http://droughtmonitor.unl.edu Projected Coordinate System: UTM 15N Christopher Prener, Ph.D.
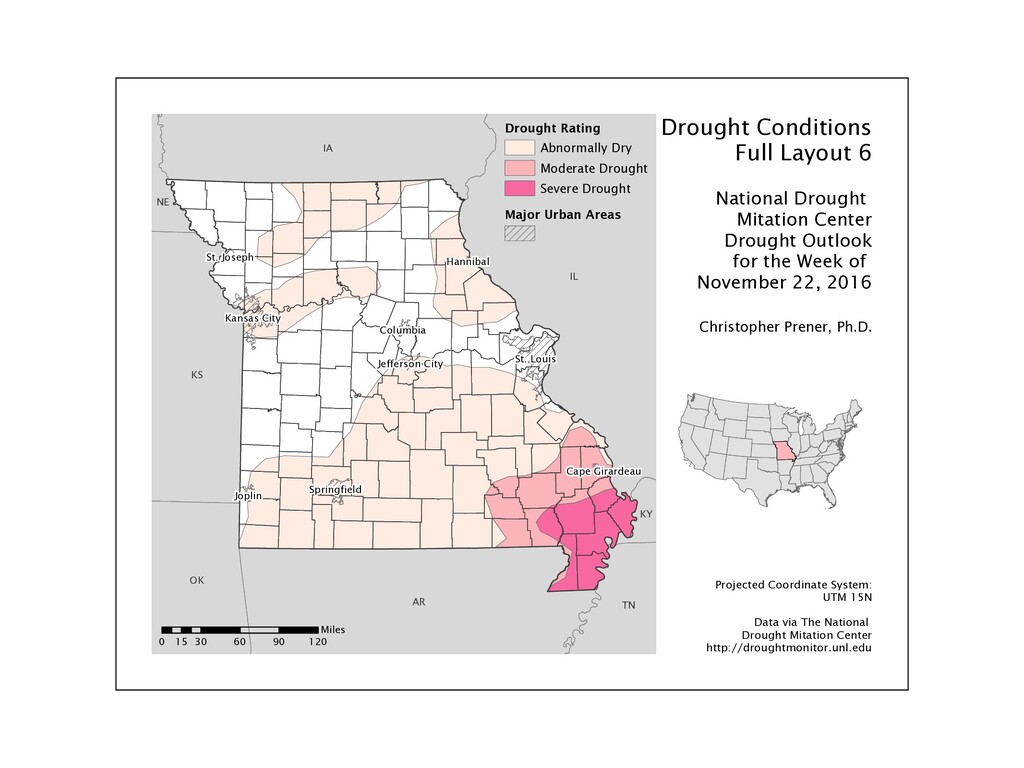
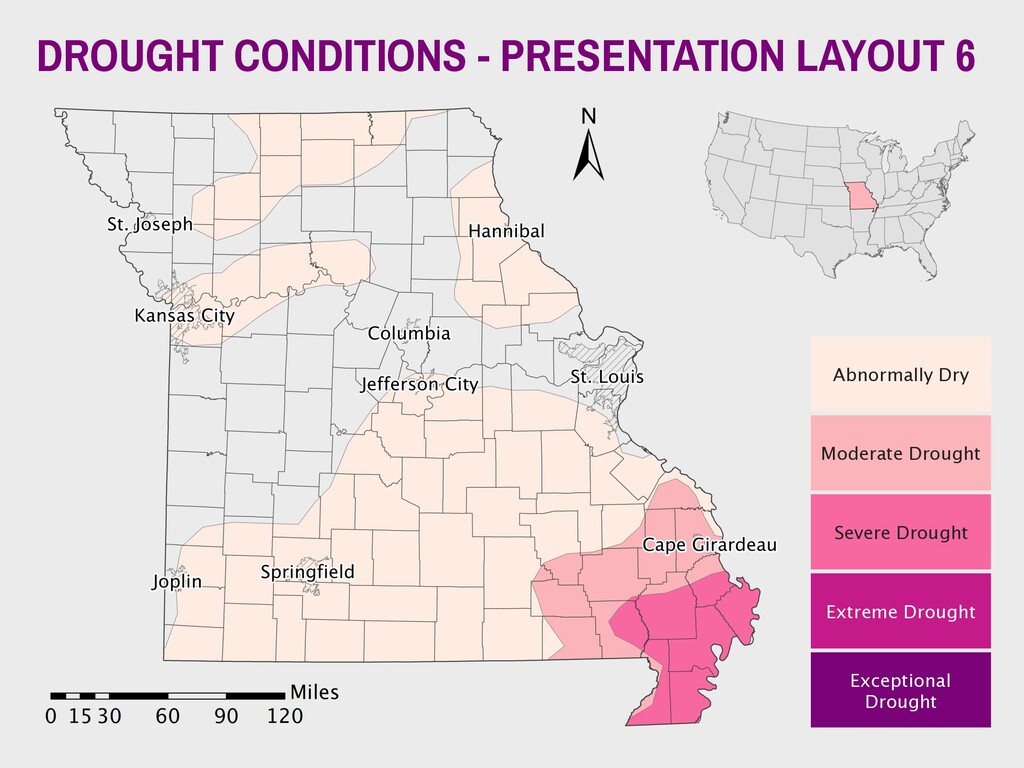
City Cape Girardeau Hannibal TN OK NE KY KS IL IA AR Drought Rating Abnormally Dry Moderate Drought Severe Drought Drought Conditions Full Layout 6 National Drought Mitation Center Drought Outlook for the Week of November 22, 2016 Data via The National Drought Mitation Center http://droughtmonitor.unl.edu Projected Coordinate System: UTM 15N Christopher Prener, Ph.D. 0 30 60 90 120 15 Miles Major Urban Areas
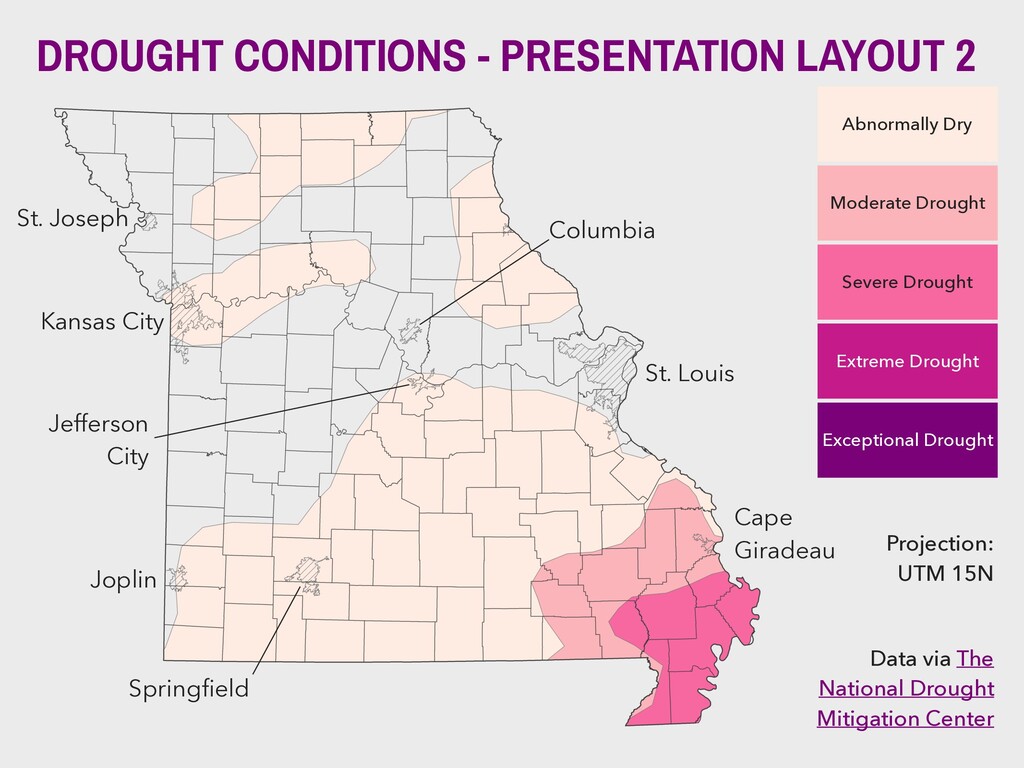
Projection: UTM 15N Data via The National Drought Mitigation Center St. Louis Cape Giradeau Joplin Kansas City St. Joseph Springfield Columbia Jefferson City DROUGHT CONDITIONS - PRESENTATION LAYOUT 2
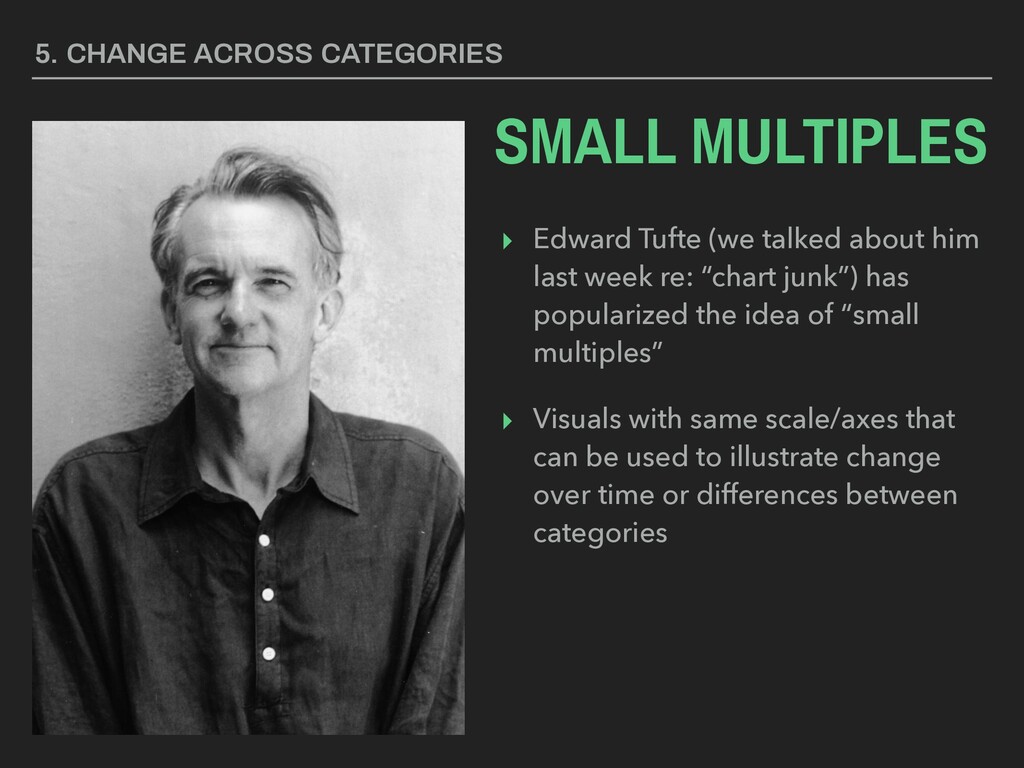
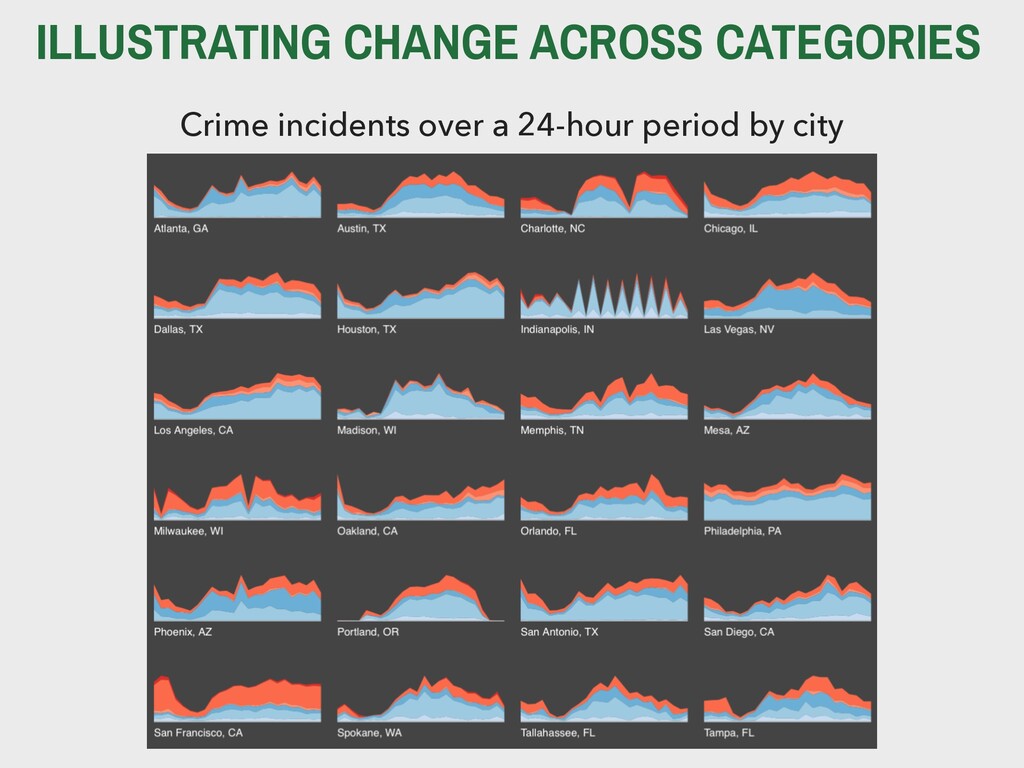
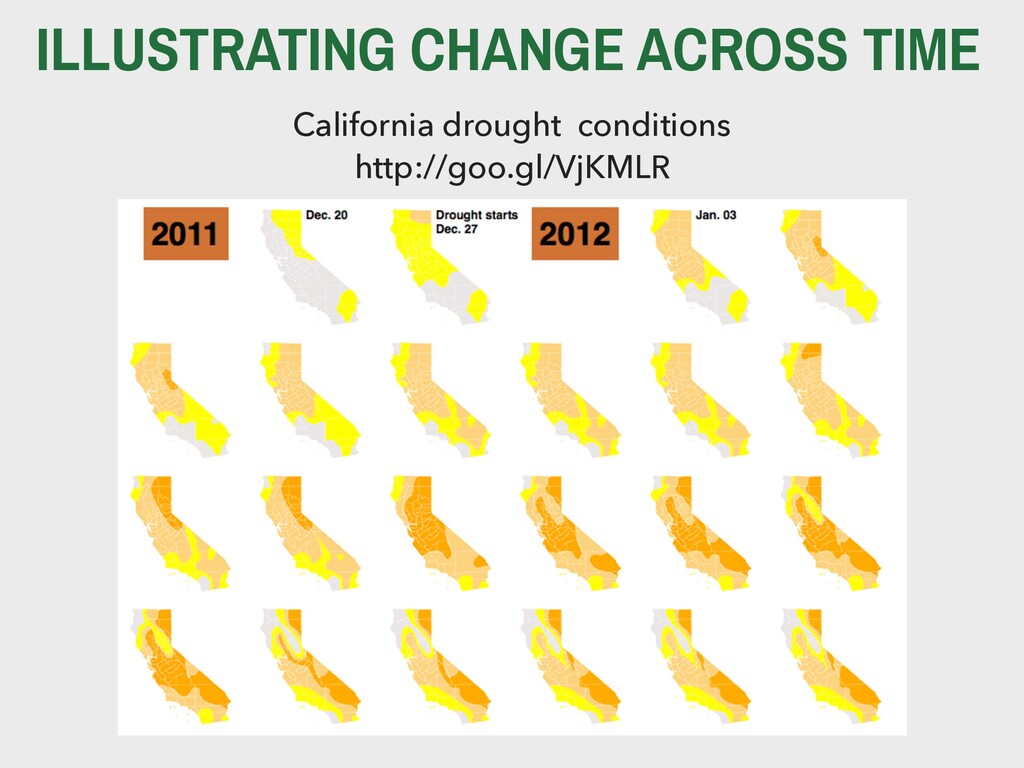
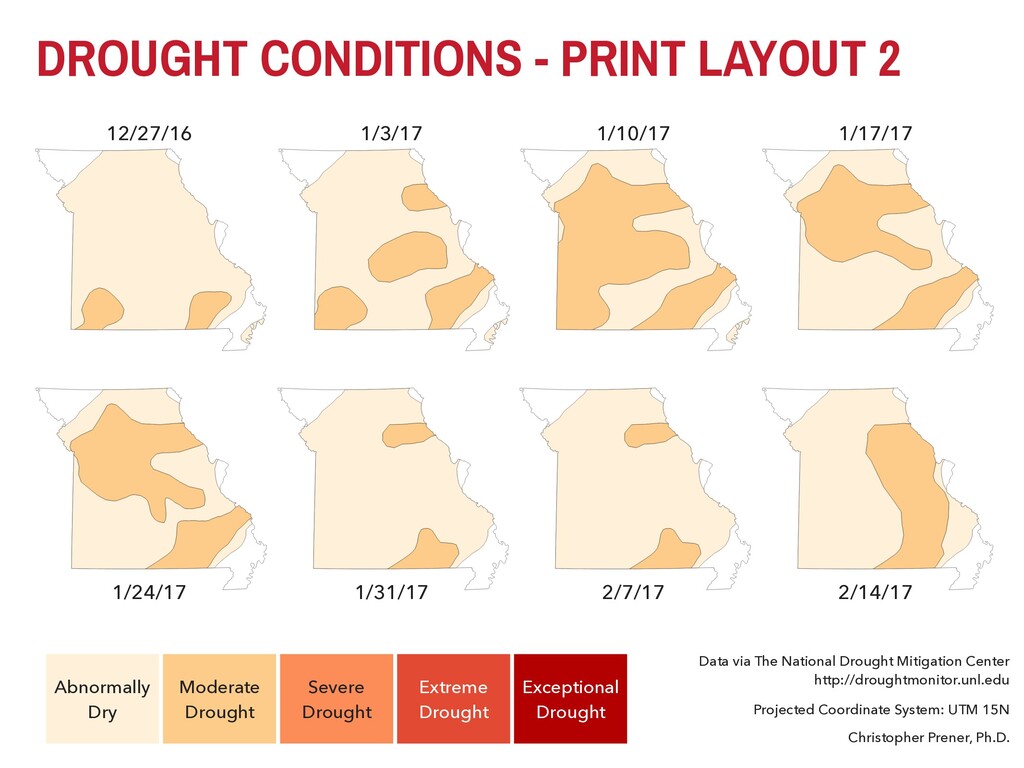
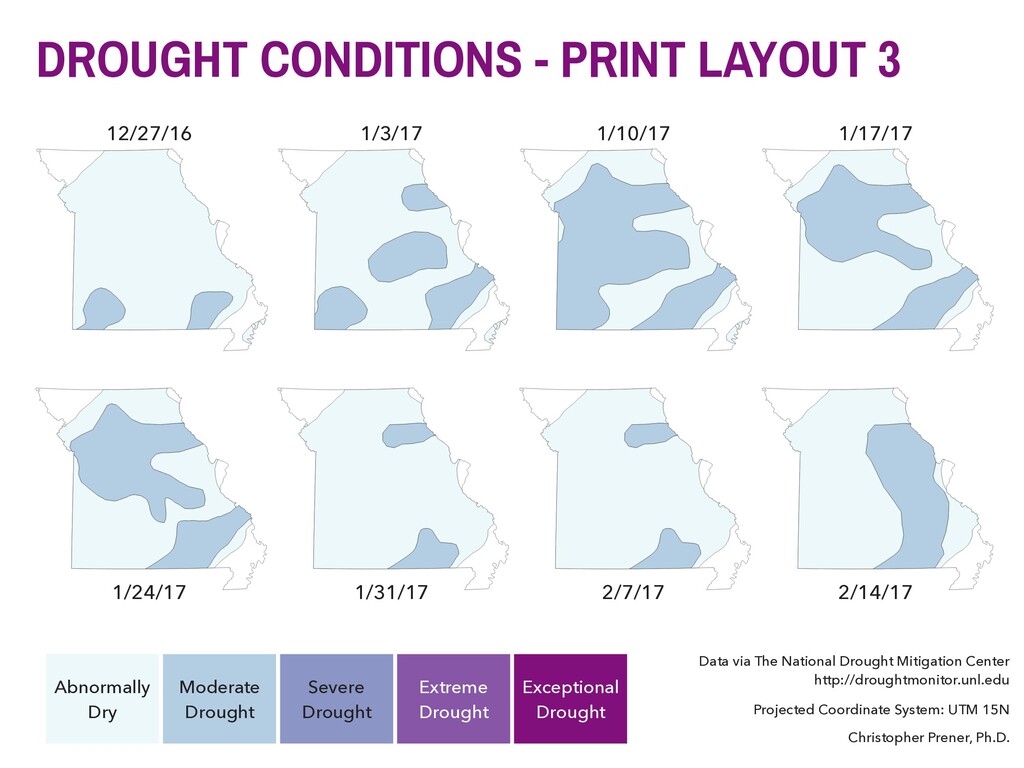
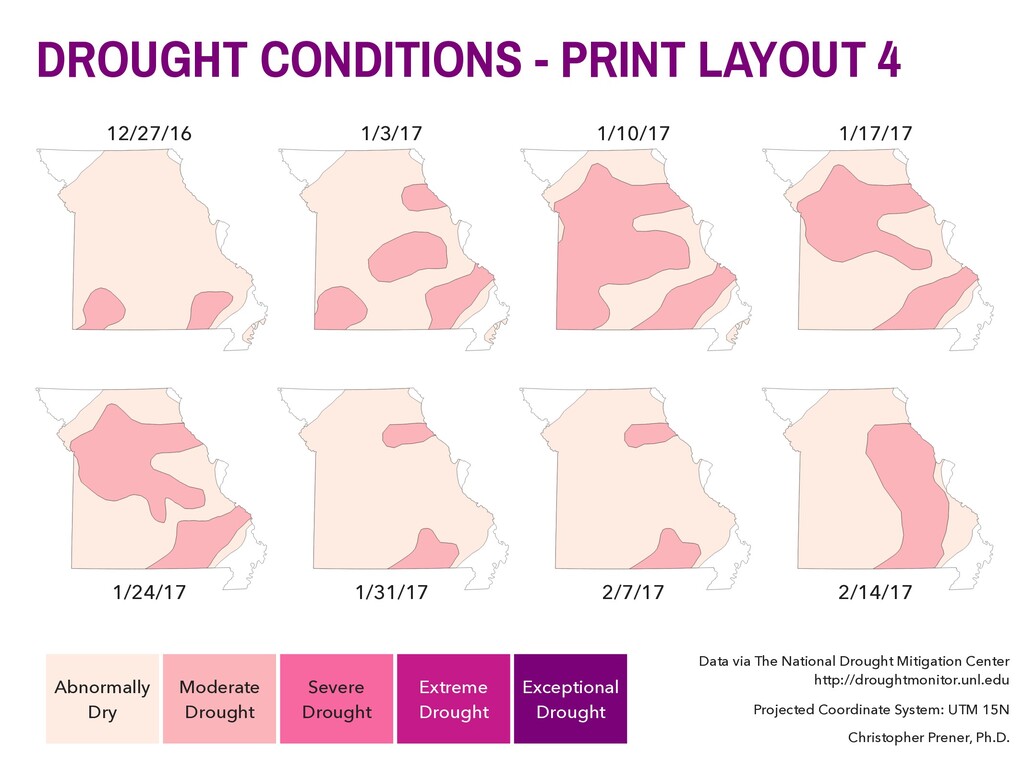
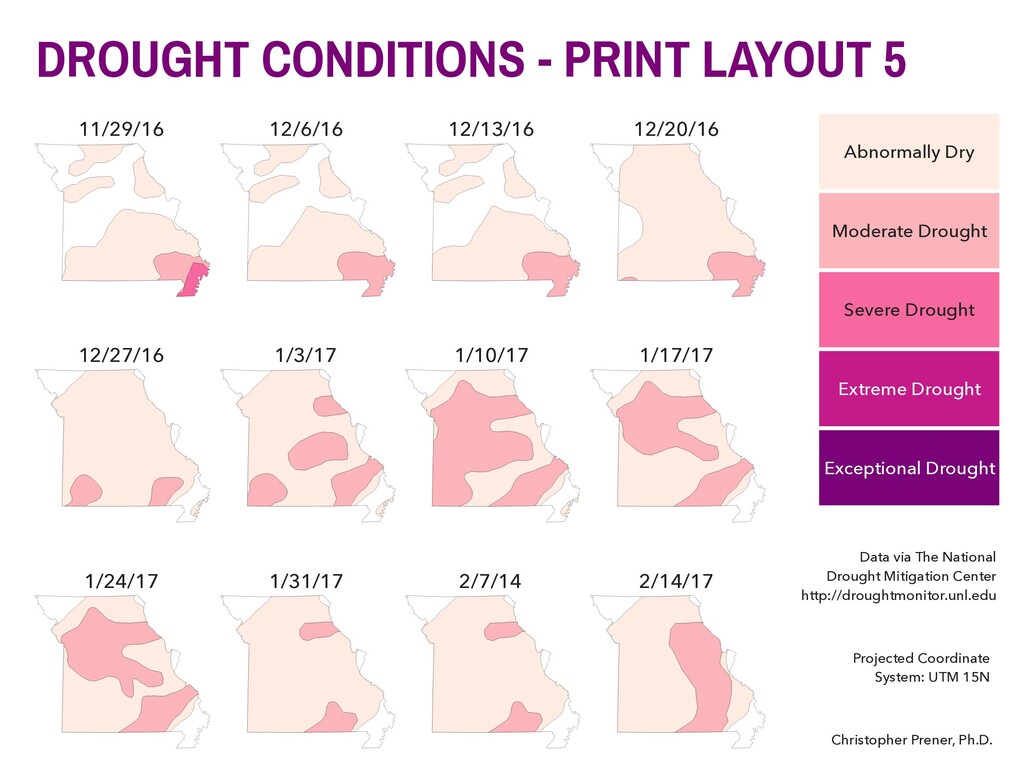
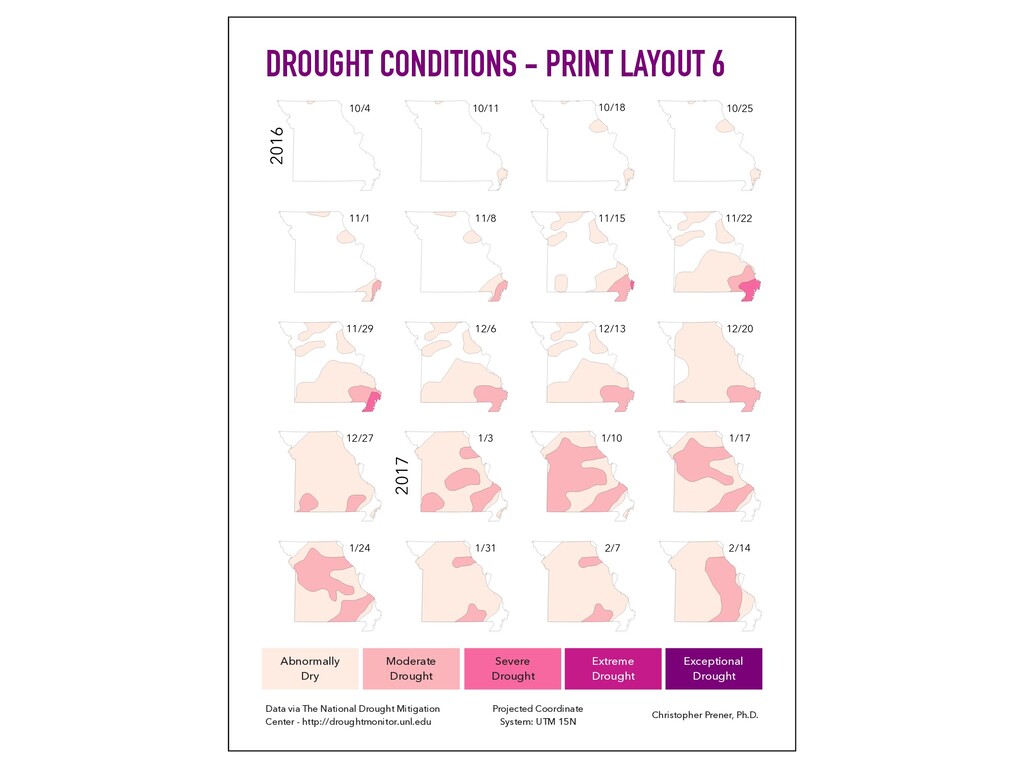
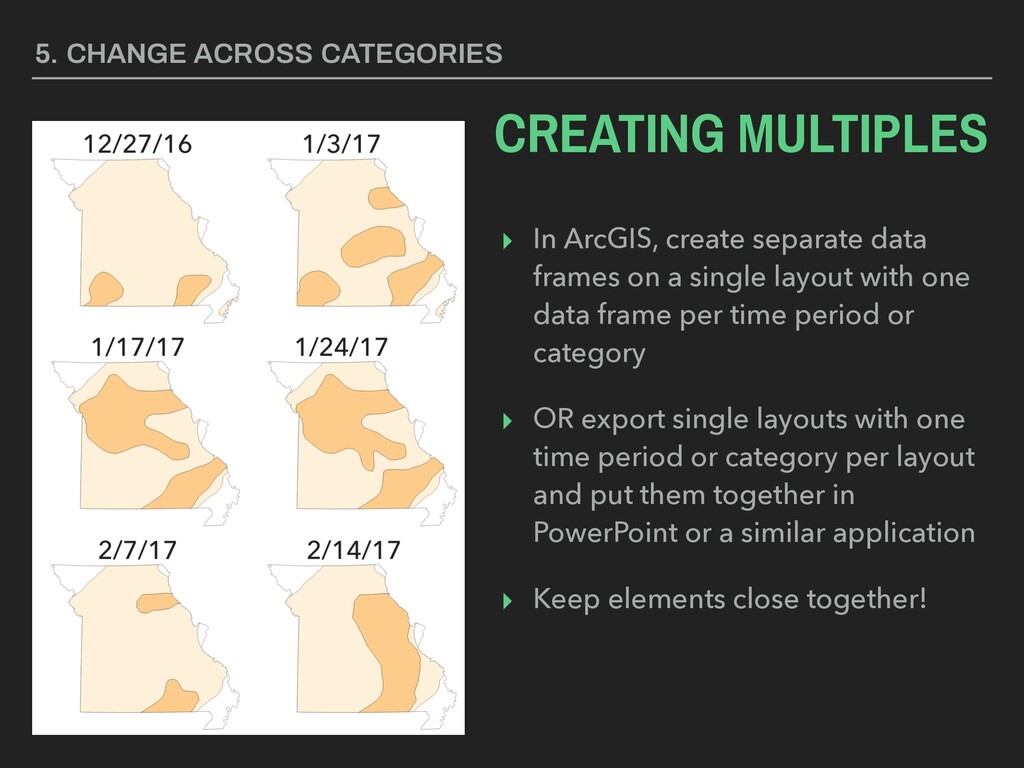
“chart junk”) has popularized the idea of “small multiples” ▸ Visuals with same scale/axes that can be used to illustrate change over time or differences between categories 5. CHANGE ACROSS CATEGORIES SMALL MULTIPLES
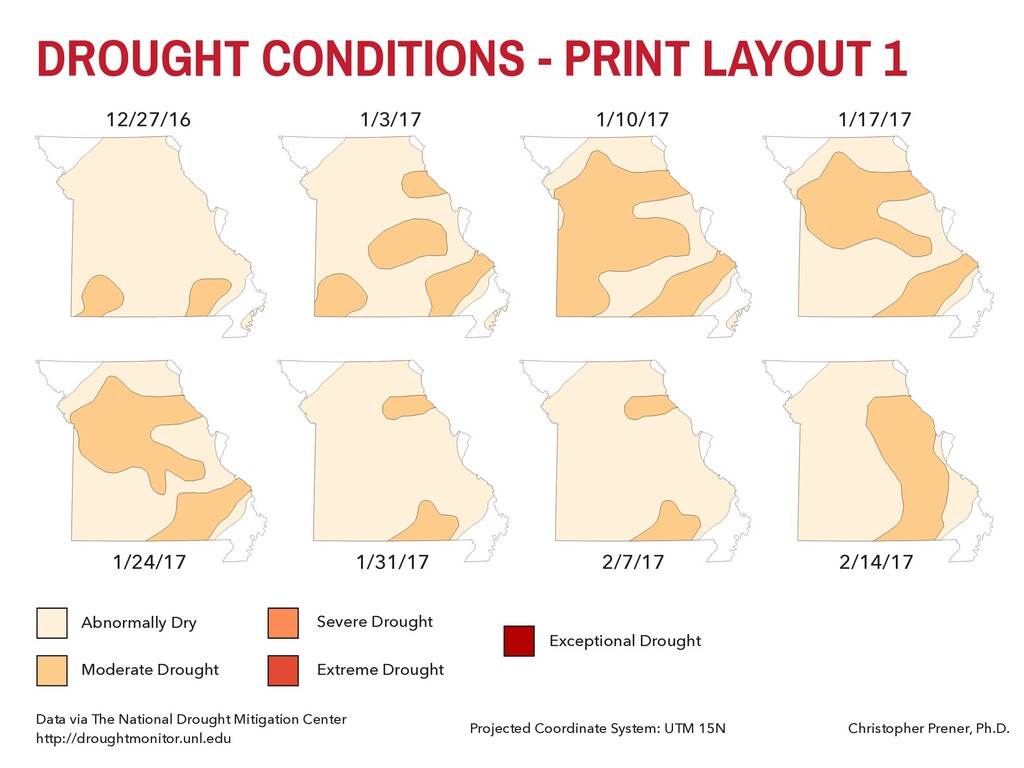
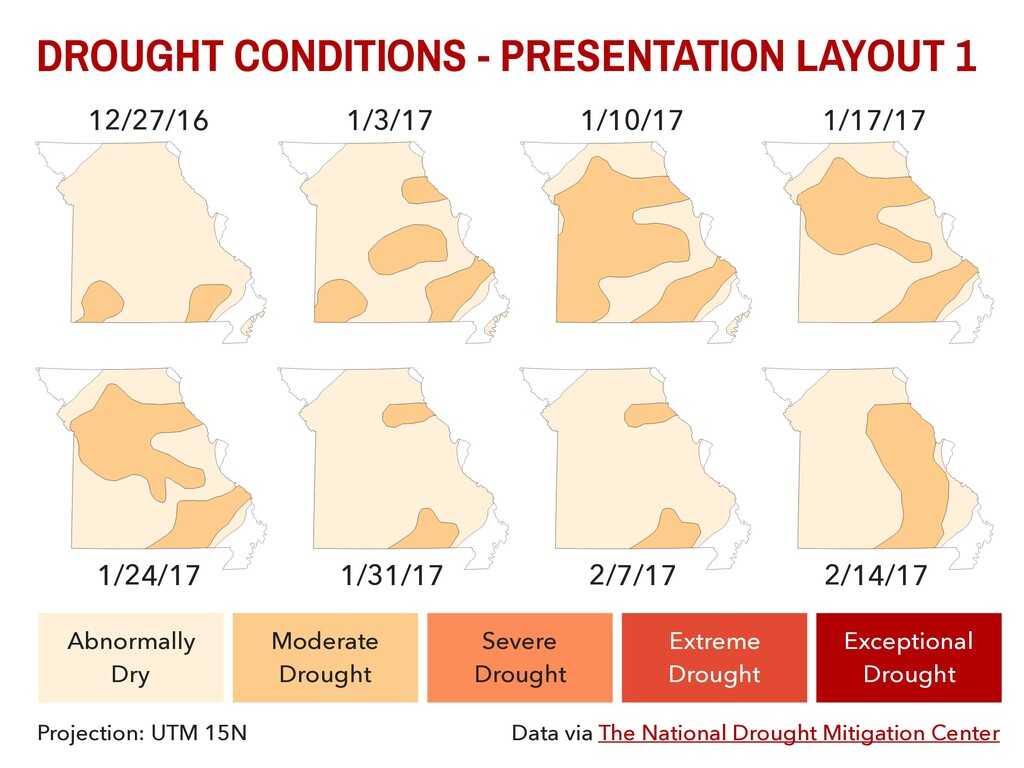
1/24/17 1/31/17 2/7/17 2/14/17 Data via The National Drought Mitigation Center http://droughtmonitor.unl.edu Projected Coordinate System: UTM 15N Christopher Prener, Ph.D. Abnormally Dry Moderate Drought Severe Drought Extreme Drought Exceptional Drought
Drought Data via The National Drought Mitigation Center http://droughtmonitor.unl.edu Severe Drought Extreme Drought Exceptional Drought Projected Coordinate System: UTM 15N Christopher Prener, Ph.D. 12/27/16 1/3/17 1/10/17 1/17/17 1/24/17 1/31/17 2/7/17 2/14/17
Drought Data via The National Drought Mitigation Center http://droughtmonitor.unl.edu Severe Drought Extreme Drought Exceptional Drought Projected Coordinate System: UTM 15N Christopher Prener, Ph.D. 12/27/16 1/3/17 1/10/17 1/17/17 1/24/17 1/31/17 2/7/17 2/14/17
12/27/16 1/24/17 1/31/17 2/7/14 2/14/17 1/17/17 1/10/17 1/3/17 Abnormally Dry Moderate Drought Severe Drought Extreme Drought Exceptional Drought Data via The National Drought Mitigation Center http://droughtmonitor.unl.edu Projected Coordinate System: UTM 15N Christopher Prener, Ph.D.
1/24/17 1/31/17 2/7/17 2/14/17 Abnormally Dry Moderate Drought Data via The National Drought Mitigation Center Severe Drought Extreme Drought Exceptional Drought Projection: UTM 15N
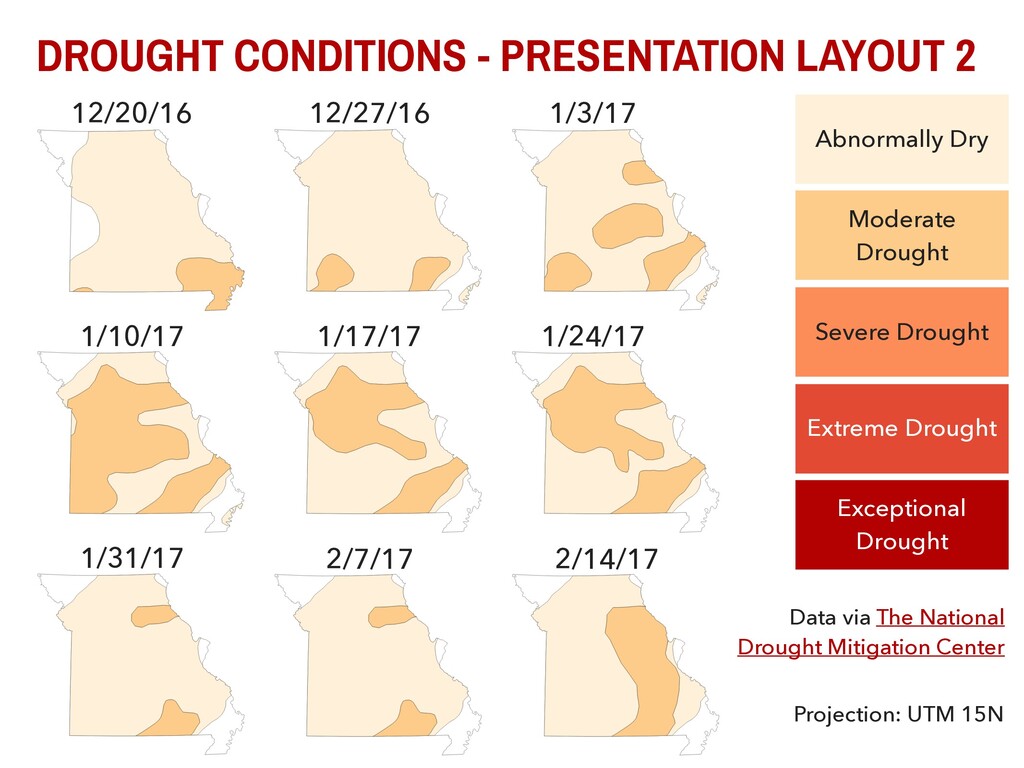
2/14/17 Abnormally Dry Moderate Drought Severe Drought Extreme Drought Exceptional Drought Data via The National Drought Mitigation Center Projection: UTM 15N 12/27/16 1/3/17 1/10/17 12/20/16
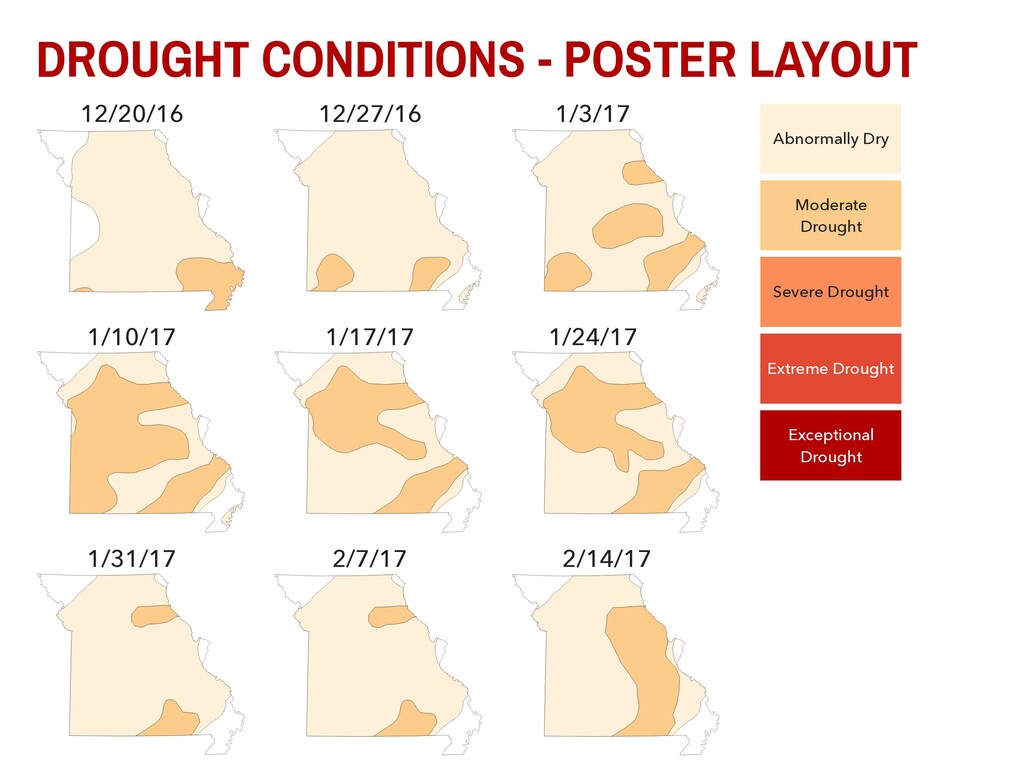
layout with one data frame per time period or category ▸ OR export single layouts with one time period or category per layout and put them together in PowerPoint or a similar application ▸ Keep elements close together! 5. CHANGE ACROSS CATEGORIES CREATING MULTIPLES
(Lecture-05). Make sure you are checking in on the Slack and on GitHub - questions starting to come in and we’ll be getting feedback on lab-02 back this week! You have two weeks to complete PS-01 - it is due before Lecture-06.