Upgrade to Pro — share decks privately, control downloads, hide ads and more …

SOC 4650 and SOC 5650 - Meeting 01

SOC 4650 and SOC 5650 - Meeting 01

Slides for Meeting 01 of the Saint Louis University Course Introduction to GIS. These slides introduce the course, the idea of workflows, and the interactive mapping tool leaflet.

Christopher Prener

February 01, 2021
Tweet

More Decks by Christopher Prener

Other Decks in Education

Transcript

  1. Make sure you have completed all of the course onboarding

    tasks listed on the course website (https://slu-soc5650.github.io) WELCOME! GETTING STARTED
  2. AGENDA INTRODUCTION TO GIS / MODULE 01 / MEETING 01

    1. Front Matter 2. Syllabus Overview 3. Defining GIS 4. Web Mapping COVID in MO 5. Our First Maps! 6. Back Matter
  3. There will be videos posted later this week to view

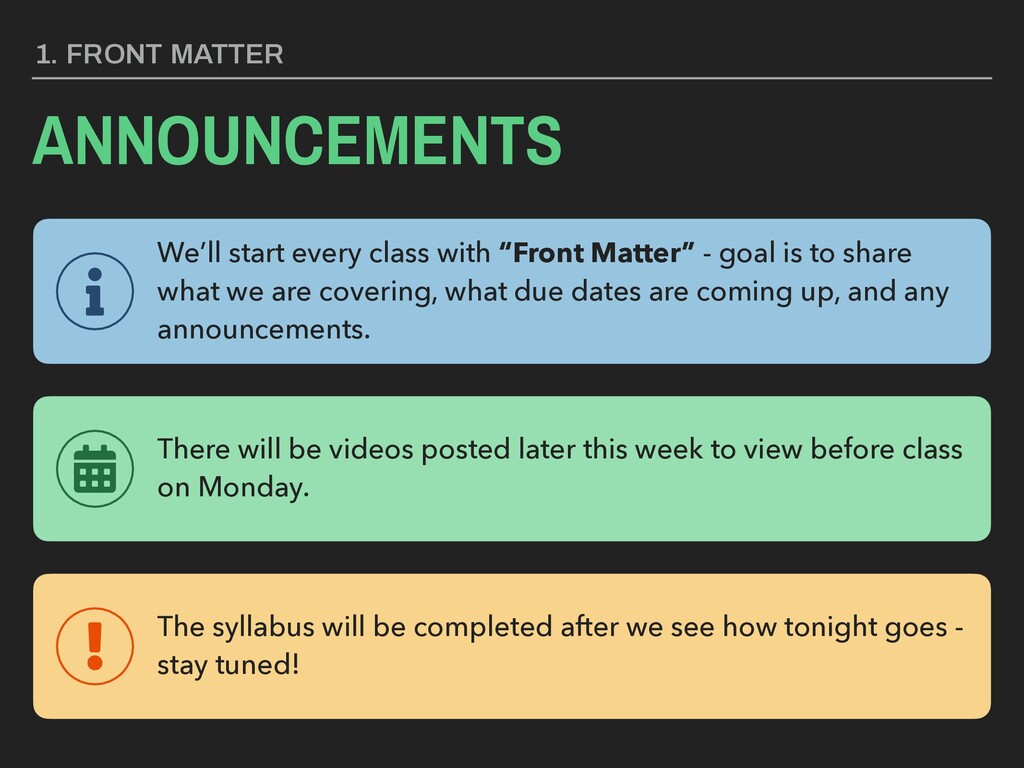
    before class on Monday. 1. FRONT MATTER ANNOUNCEMENTS We’ll start every class with “Front Matter” - goal is to share what we are covering, what due dates are coming up, and any announcements. The syllabus will be completed after we see how tonight goes - stay tuned!
  4. Pierre Bourdieu On Television (1996) THE FUNCTION OF SOCIOLOGY, AS

    OF EVERY SCIENCE, IS TO REVEAL THAT WHICH IS HIDDEN. empirically ^
  5. COURSE OBJECTIVES 2. SYLLABUS OVERVIEW 1. Geographic Information Science 2.

    Data Management 3. Data Visualization 4. Analysis Development 5. Research Synthesis
  6. COURSE OBJECTIVES 2. SYLLABUS OVERVIEW 1. Geographic Information Science -

    Describe the concepts that form the foundation of GISc work. 2. Data Management 3. Data Visualization 4. Analysis Development 5. Research Synthesis
  7. COURSE OBJECTIVES 2. SYLLABUS OVERVIEW 1. Geographic Information Science 2.

    Data Management - Perform basic data cleaning and geoprocessing tasks using R. 3. Data Visualization 4. Analysis Development 5. Research Synthesis
  8. COURSE OBJECTIVES 2. SYLLABUS OVERVIEW 1. Geographic Information Science 2.

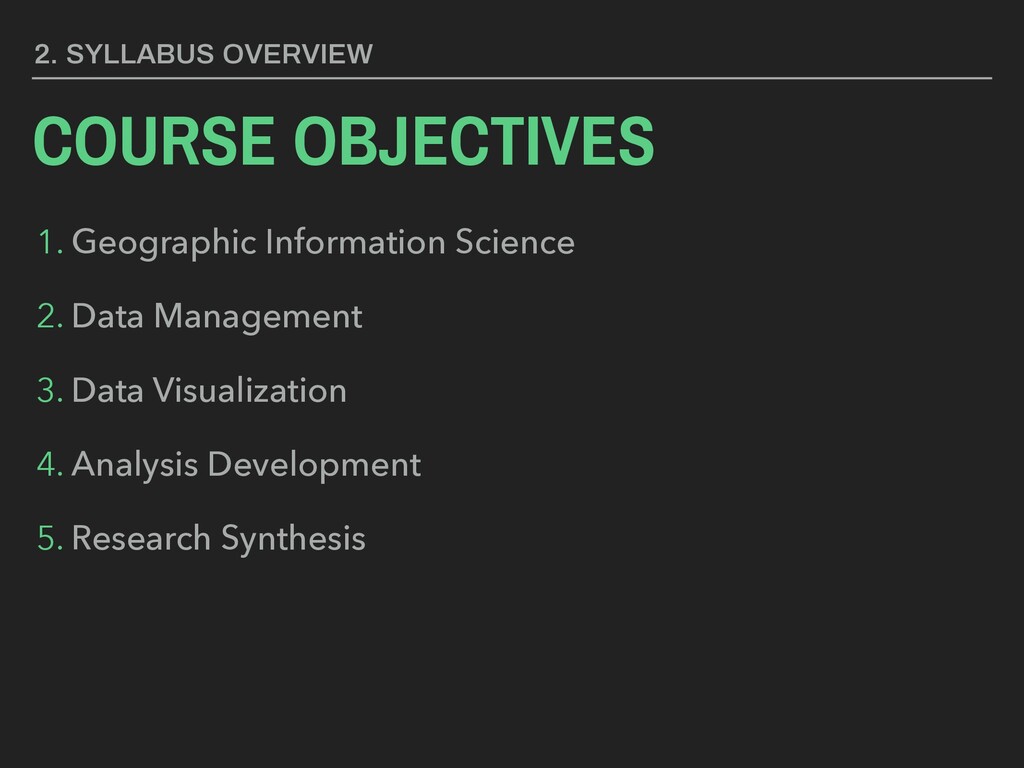
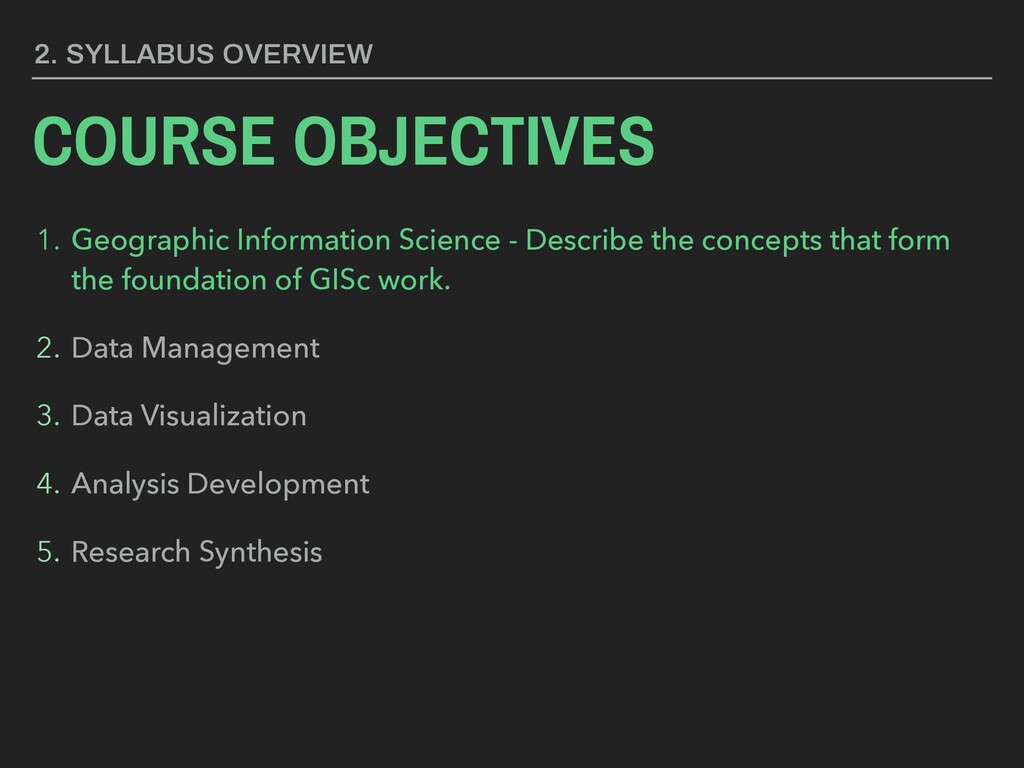
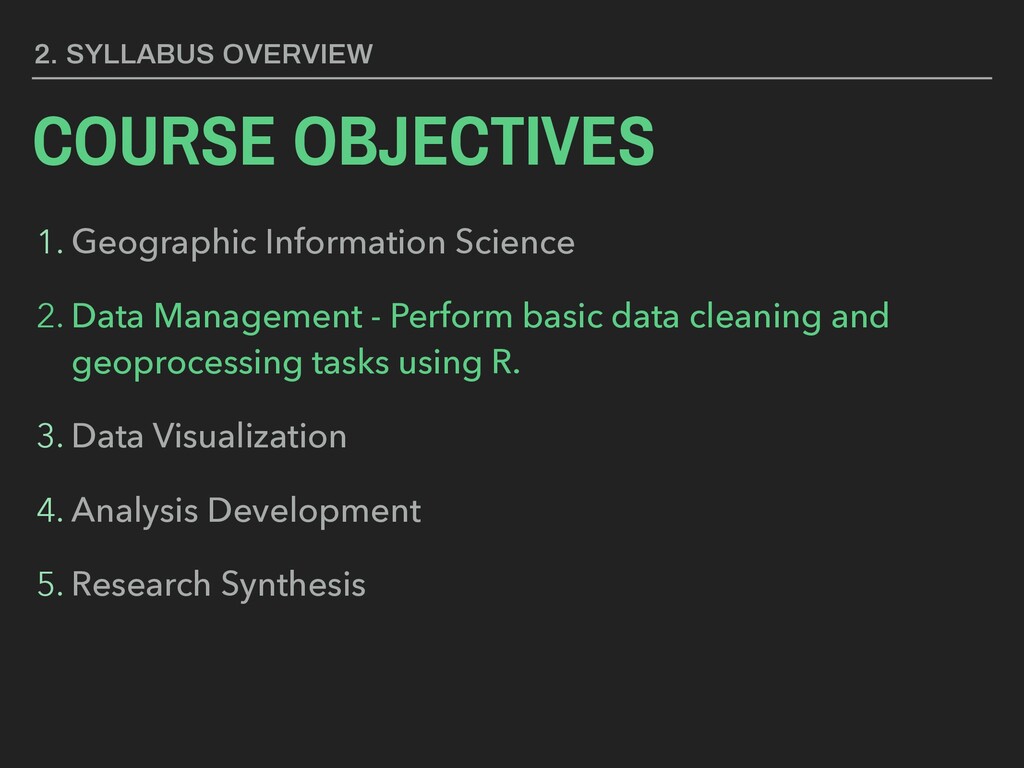
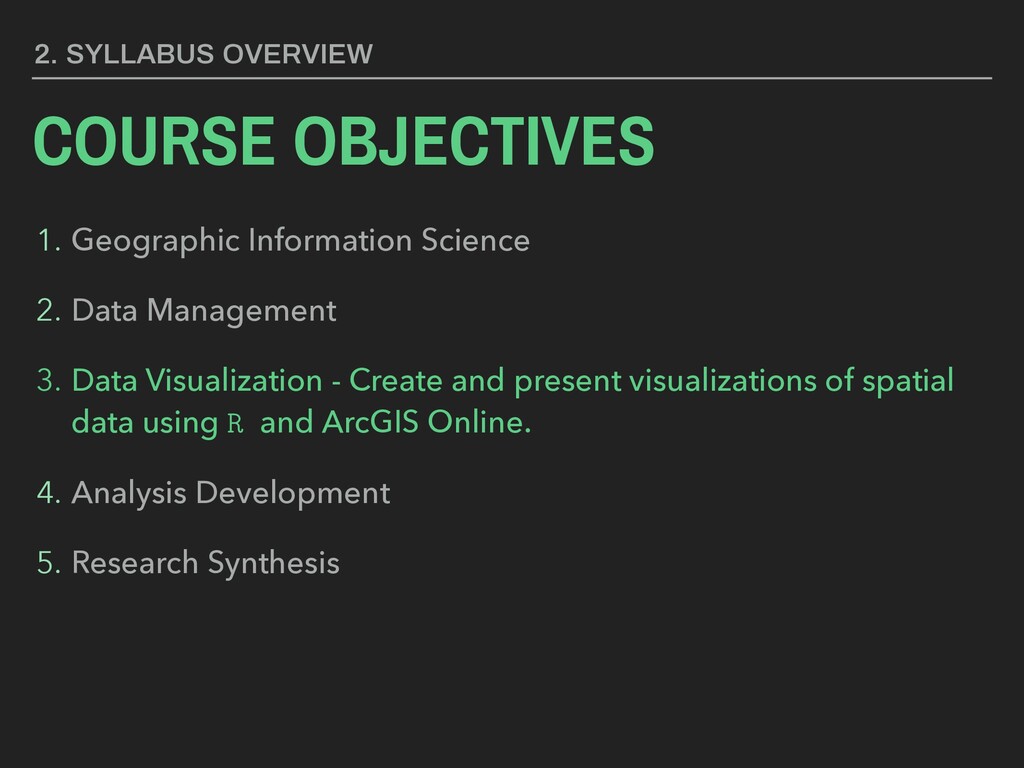
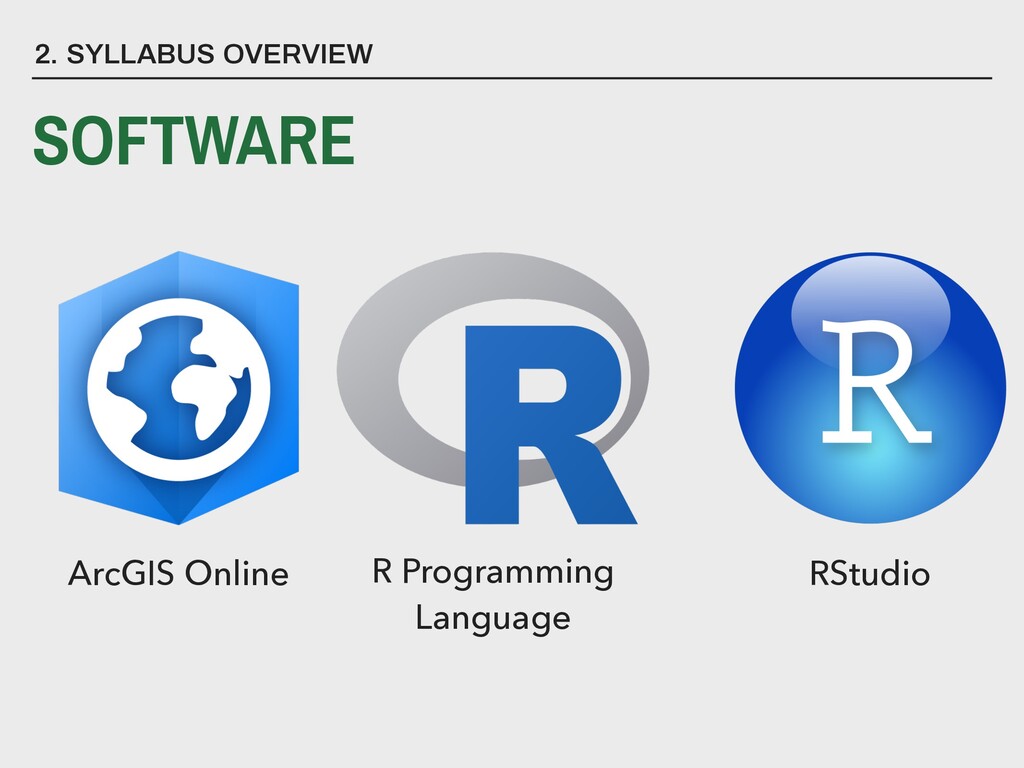
    Data Management 3. Data Visualization - Create and present visualizations of spatial data using R and ArcGIS Online. 4. Analysis Development 5. Research Synthesis
  9. COURSE OBJECTIVES 2. SYLLABUS OVERVIEW 1. Geographic Information Science 2.

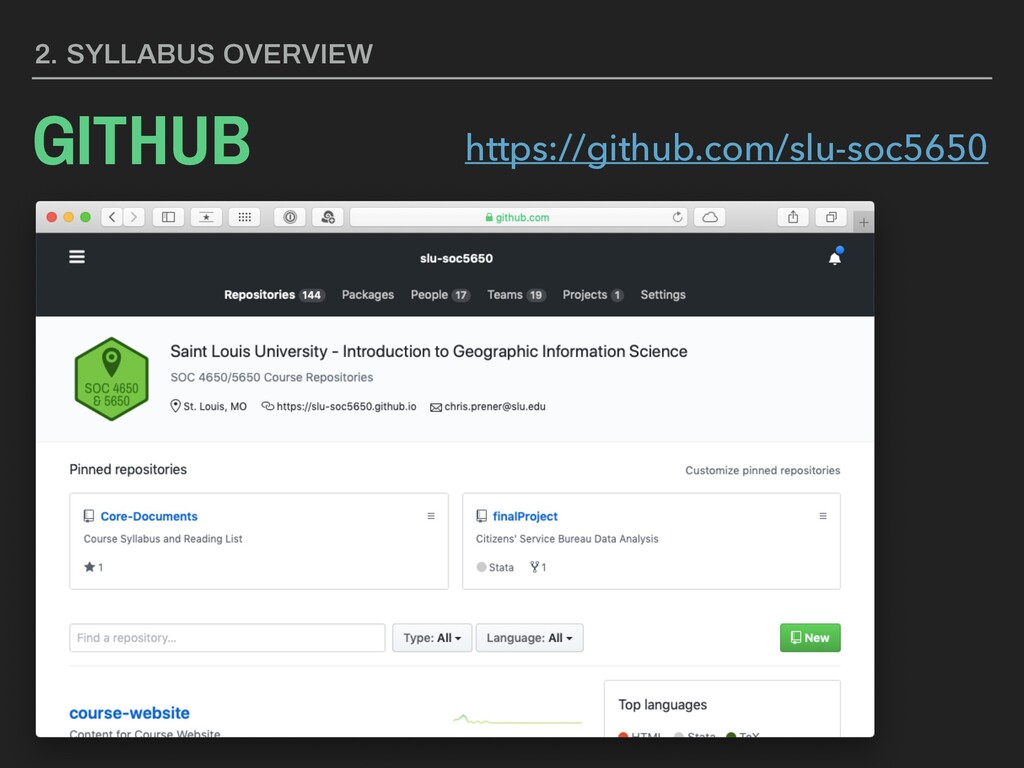
    Data Management 3. Data Visualization 4. Analysis Development - Apply techniques that make GISc work more reproducible, accurate, and collaborative using GitHub, R, Markdown, and other tools. 5. Research Synthesis
  10. COURSE OBJECTIVES 2. SYLLABUS OVERVIEW 1. Geographic Information Science 2.

    Data Management 3. Data Visualization 4. Analysis Development 5. Research Synthesis - Plan and implement a spatial data analysis project that utilizes the techniques described throughout the course.
  11. COURSE POLICIES 2. SYLLABUS OVERVIEW 1. Compassionate Coursework & Title

    IX 2. Attendance & Participation 3. Communication 4. Electronic Devices 5. Student Support 6. Academic Honesty 7. Submission & Late Work
  12. ASSIGNMENTS 2. SYLLABUS OVERVIEW 1. Participation 2. Labs 3. Final

    Project 10% 28% 62% 50 140 310 1,000 25 * 2 = 14 * 10 = =
  13. 1. Participation 2. Labs 3. Final Project ASSIGNMENTS 2. SYLLABUS

    OVERVIEW + - Excellent Satisfactory Substantial Improvement Needed 100% 85% 75% ◦
  14. 2. SYLLABUS OVERVIEW CLASS FEATURES These are the two big

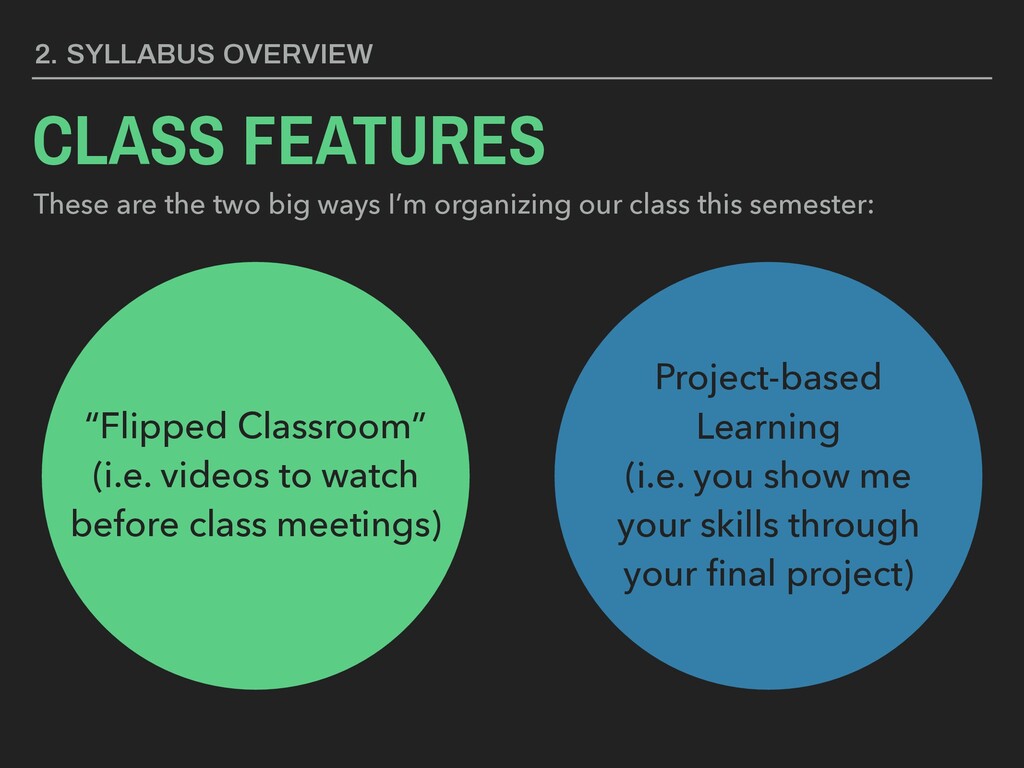
    ways I’m organizing our class this semester: “Flipped Classroom” (i.e. videos to watch before class meetings) Project-based Learning (i.e. you show me your skills through your final project)
  15. WHAT ARE SPATIAL DATA? ▸ Data the can be represented

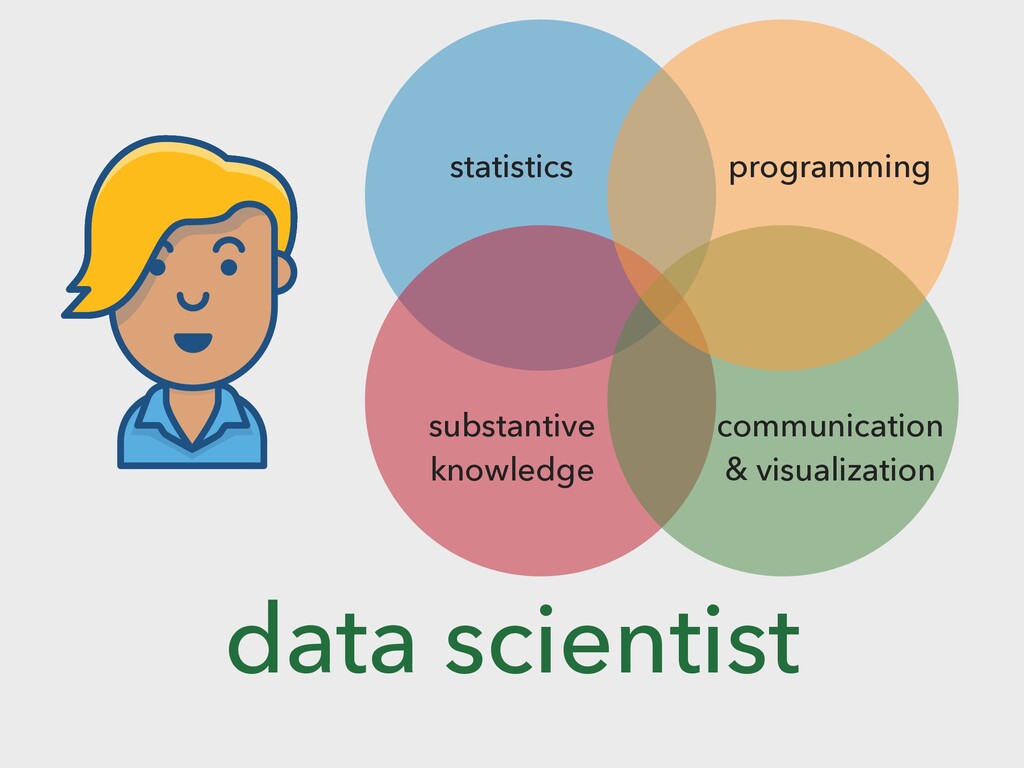
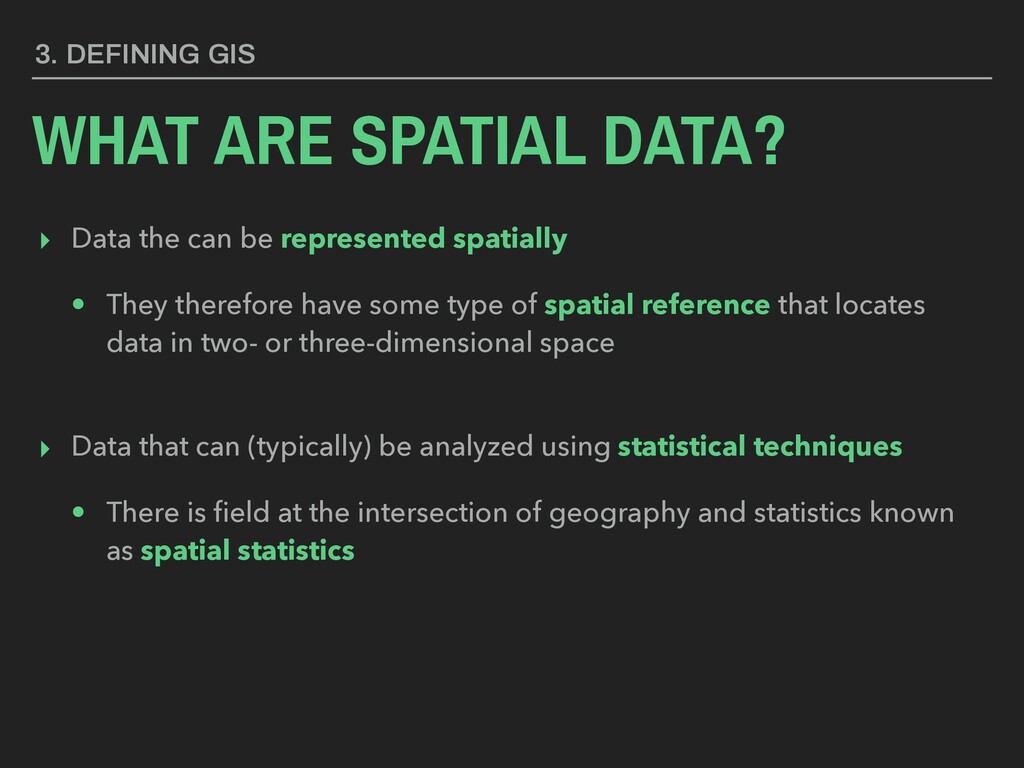
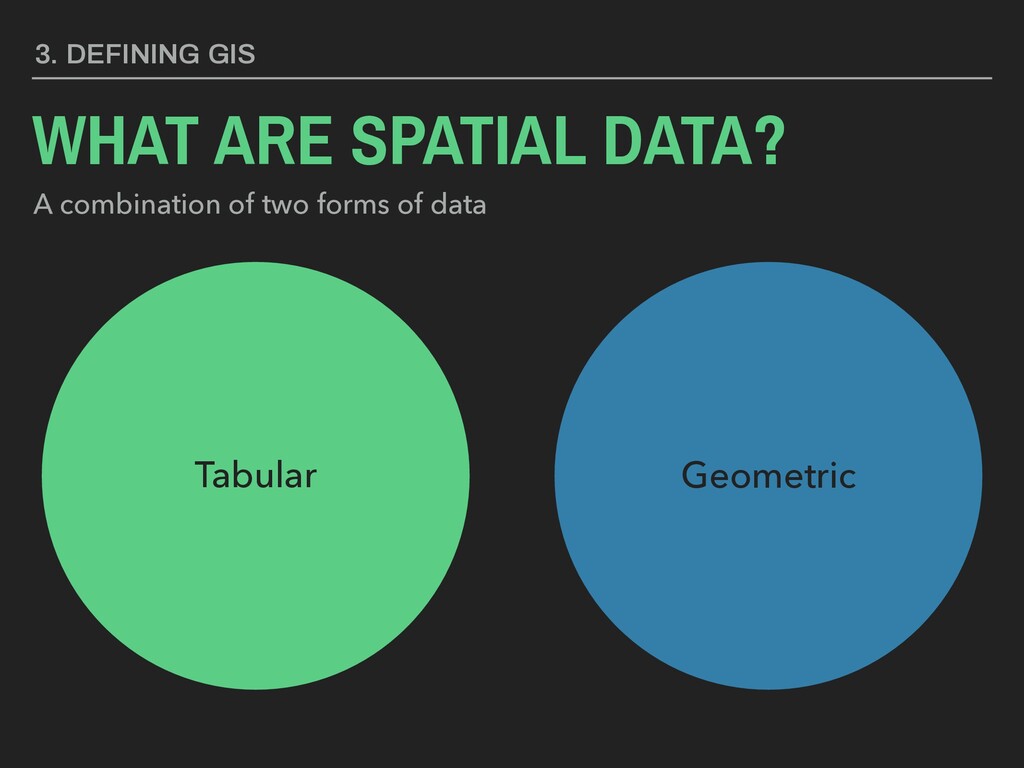
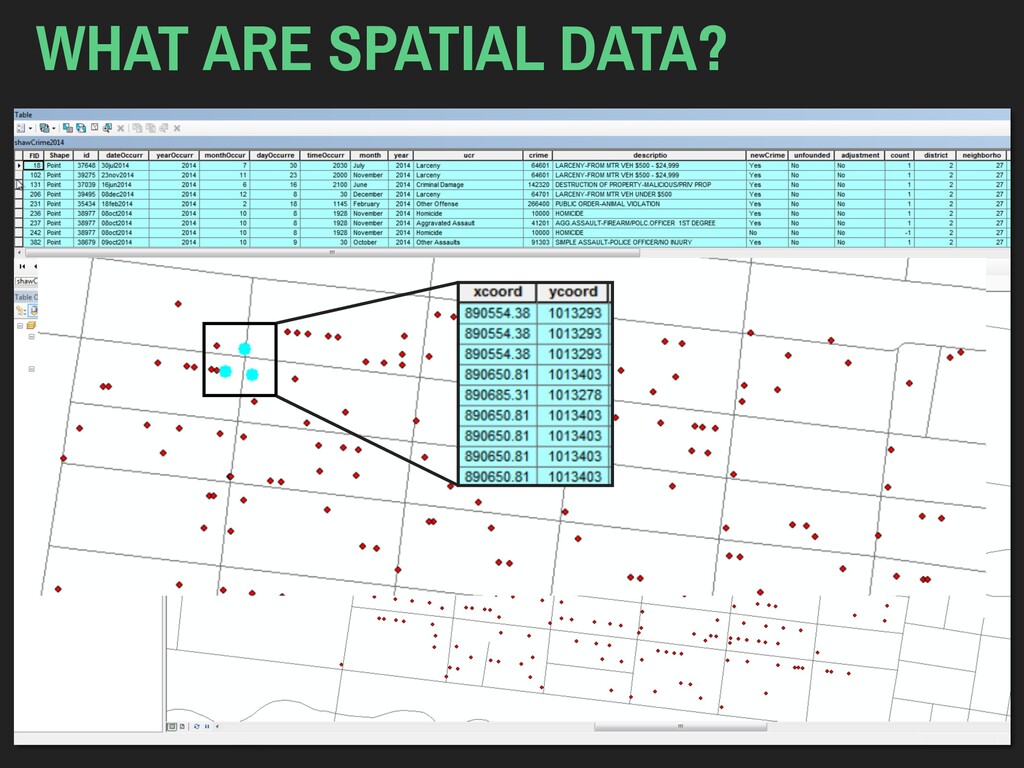
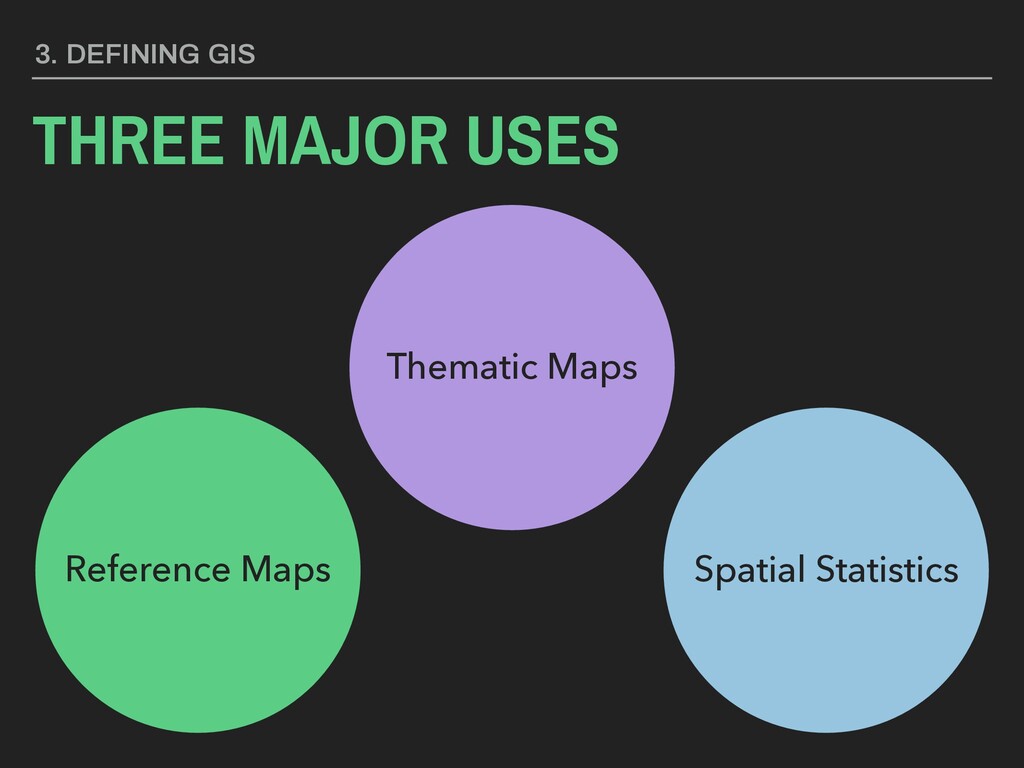
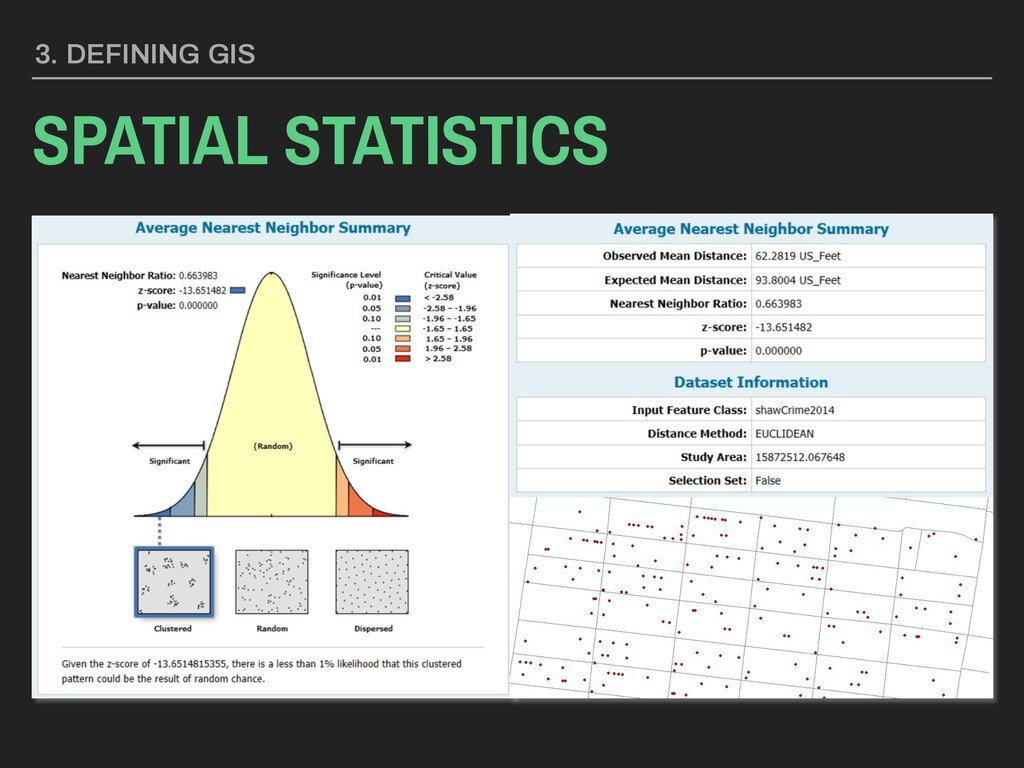
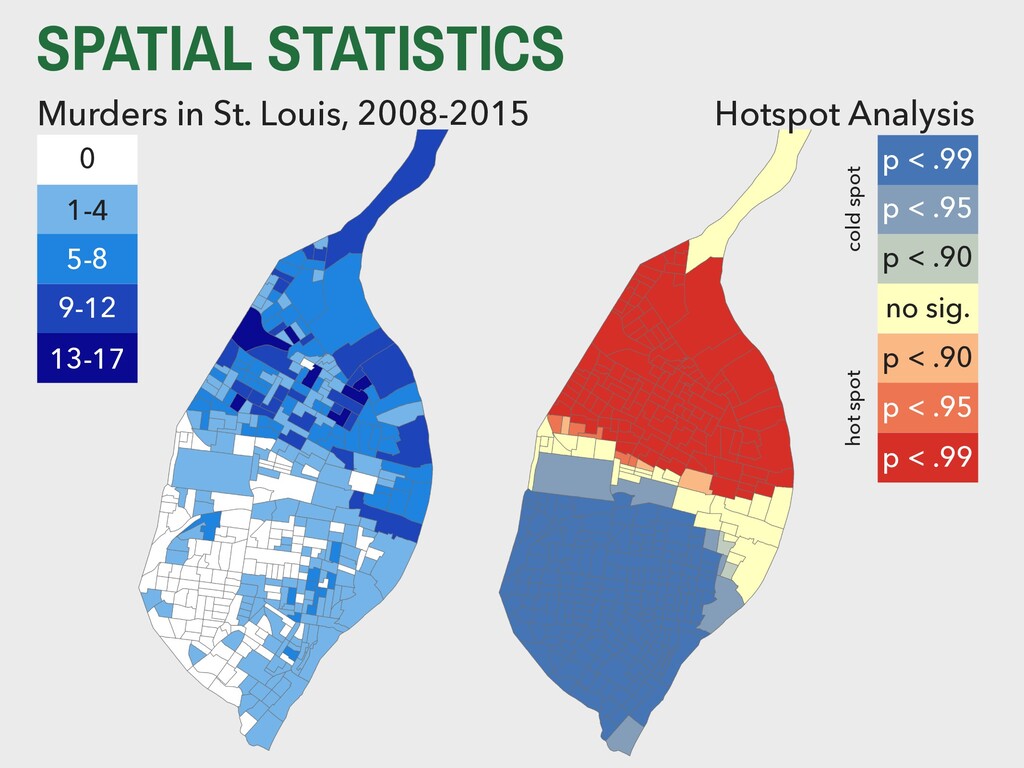
    spatially • They therefore have some type of spatial reference that locates data in two- or three-dimensional space ▸ Data that can (typically) be analyzed using statistical techniques • There is field at the intersection of geography and statistics known as spatial statistics 3. DEFINING GIS
  16. 3. DEFINING GIS WHAT ARE SPATIAL DATA? A combination of

    two forms of data Tabular Geometric
  17. 3. DEFINING GIS REFERENCE MAP SLU North Campus SLU Medical

    Campus Shaw St. Louis Missouri Botanical Garden Shaw Market Flora Place Mullanphy Elementary
  18. EVERYTHING IS RELATED TO EVERYTHING ELSE, BUT NEAR THINGS ARE

    MORE RELATED THAN DISTANT THINGS. William Tobler “A computer movie simulating urban growth in the Detroit region” (1970)
  19. p < .99 p < .95 p < .90 no

    sig. p < .90 p < .95 p < .99 hot spot cold spot 0 1-4 5-8 9-12 13-17 Hotspot Analysis Murders in St. Louis, 2008-2015 SPATIAL STATISTICS
  20. AGENDA REVIEW 6. BACK MATTER 2. Syllabus Overview 3. Defining

    GIS 4. Web Mapping COVID in MO 5. Our First Maps!
  21. The rest of the syllabus, and the video to watch

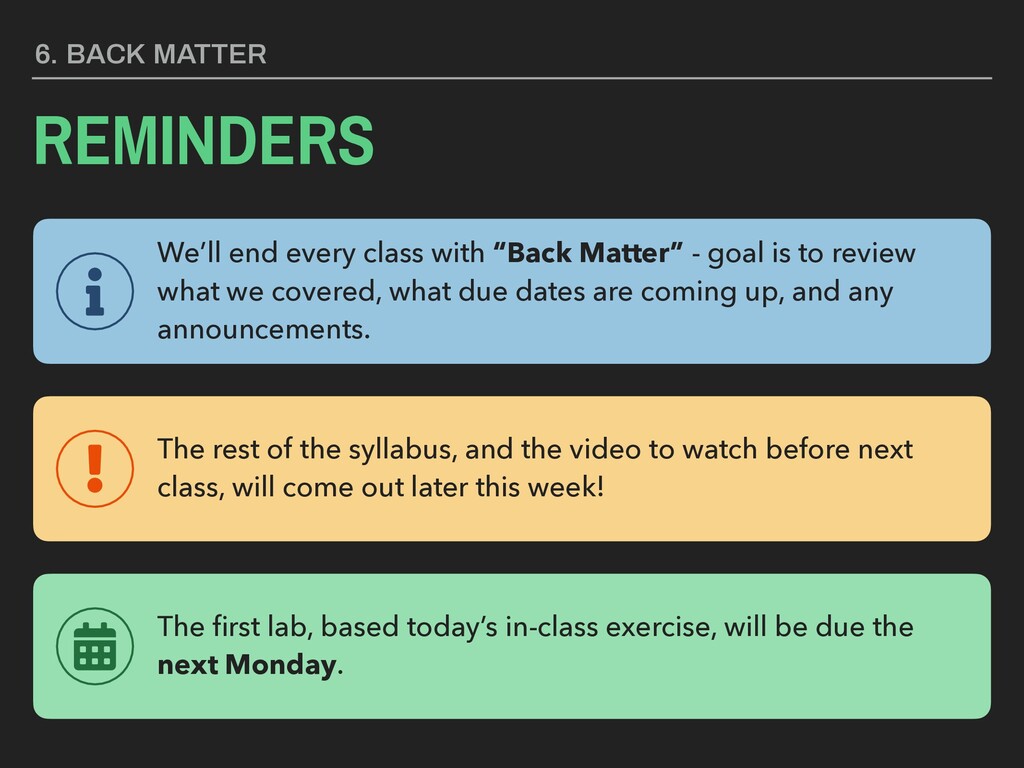
    before next class, will come out later this week! We’ll end every class with “Back Matter” - goal is to review what we covered, what due dates are coming up, and any announcements. The first lab, based today’s in-class exercise, will be due the next Monday. REMINDERS 6. BACK MATTER