Lecture slides for Week 02, Lecture 02a of the Saint Louis University Course Quantitative Analysis: Applied Inferential Statistics. These slides cover the basics of the R package ggplot2.
used for both exploratory data analysis and production of final plots ▸ Not the only way to make plots in R but absolutely the best way ▸ One of the reasons R is so attractive to end users GGPLOT2
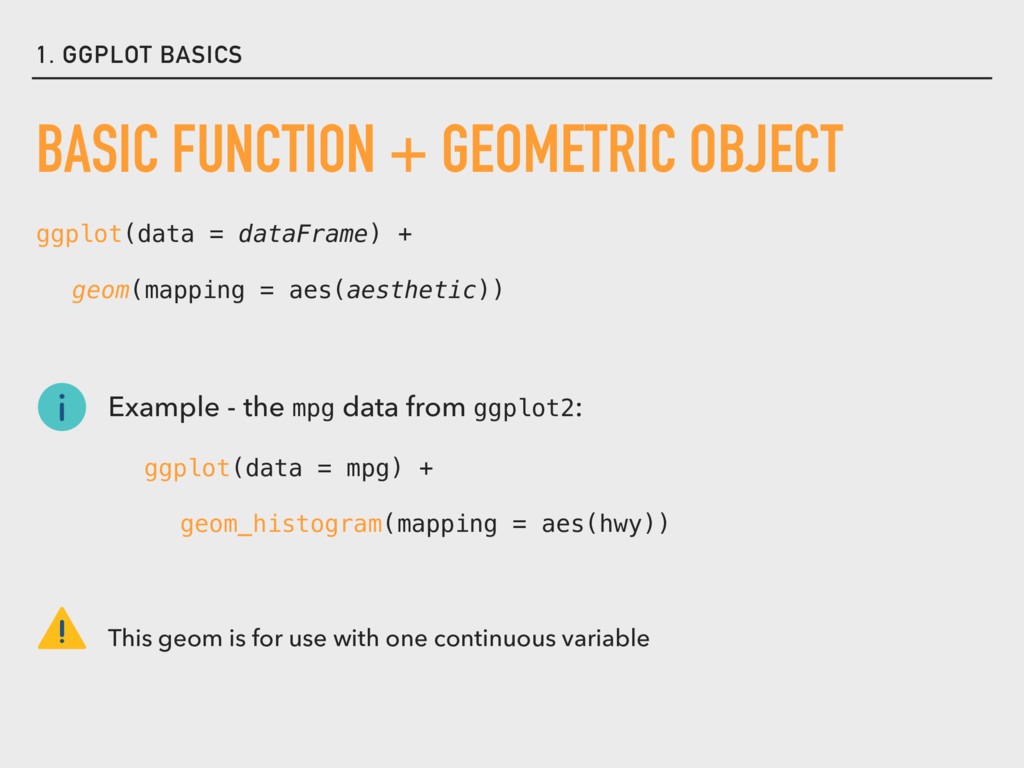
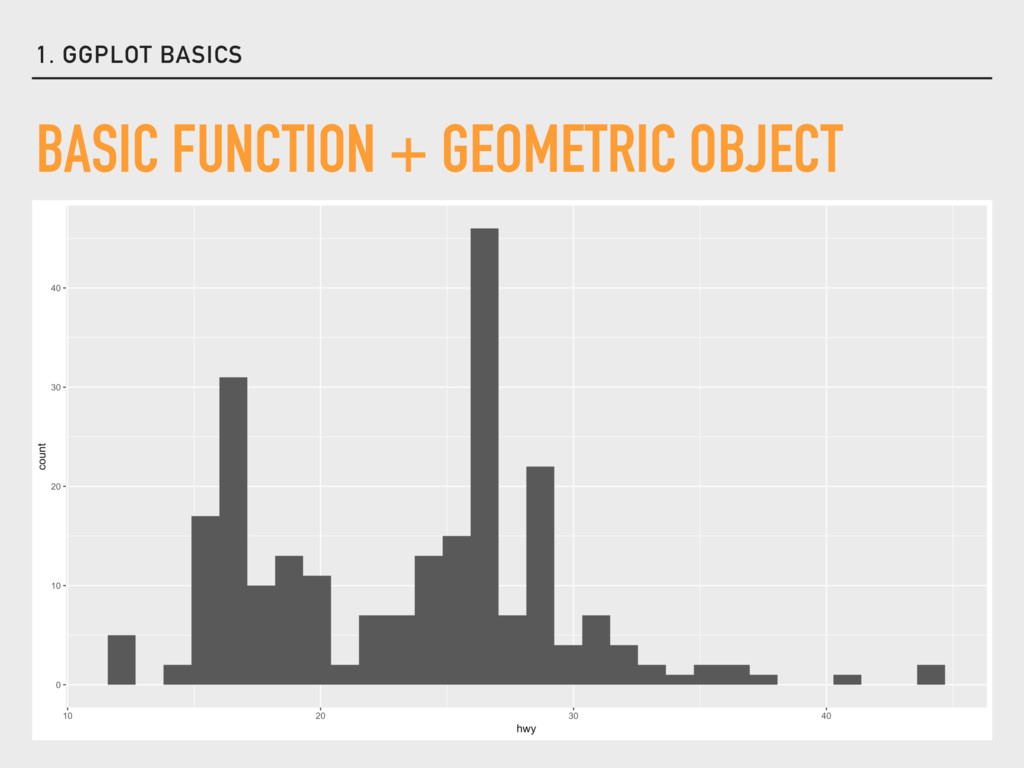
dataFrame) + geom(mapping = aes(aesthetic)) Example - the mpg data from ggplot2: ggplot(data = mpg) + geom_histogram(mapping = aes(hwy)) This geom is for use with one continuous variable
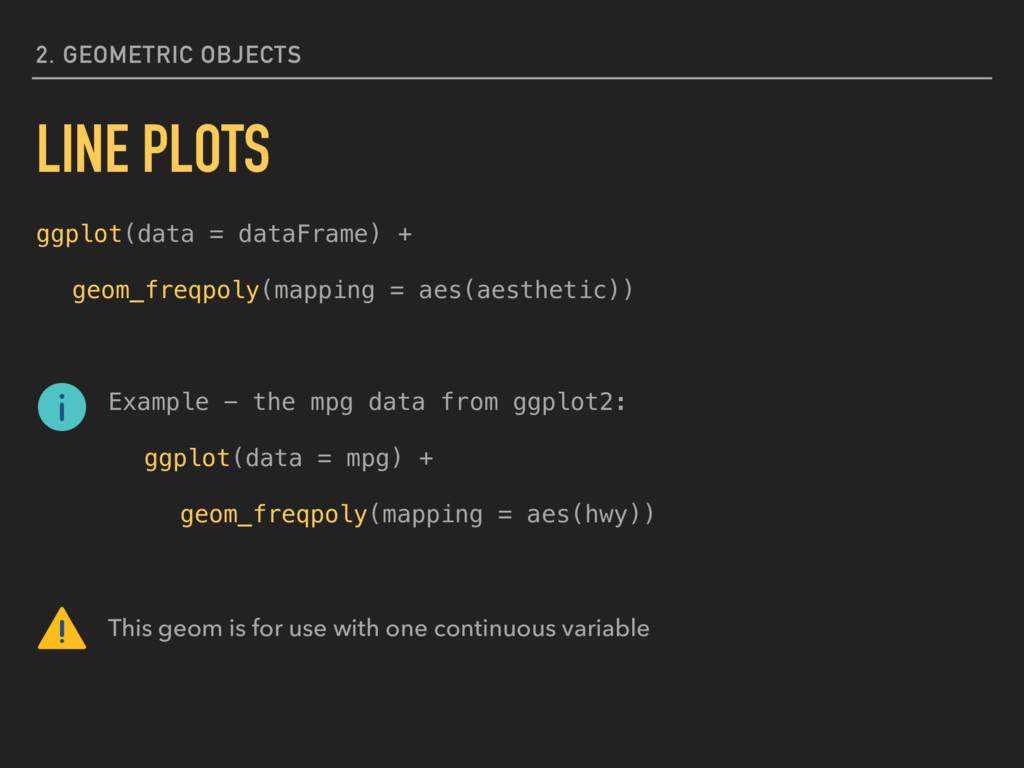
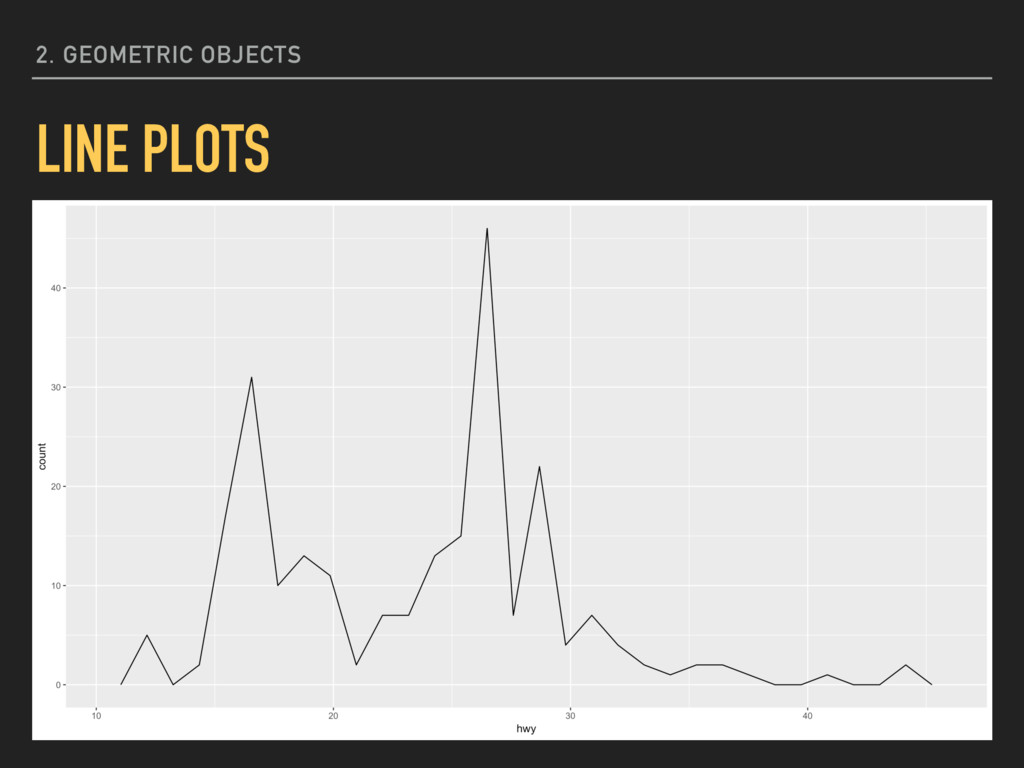
mpg data from ggplot2: ggplot(data = mpg) + geom_freqpoly(mapping = aes(hwy)) This geom is for use with one continuous variable 2. GEOMETRIC OBJECTS LINE PLOTS
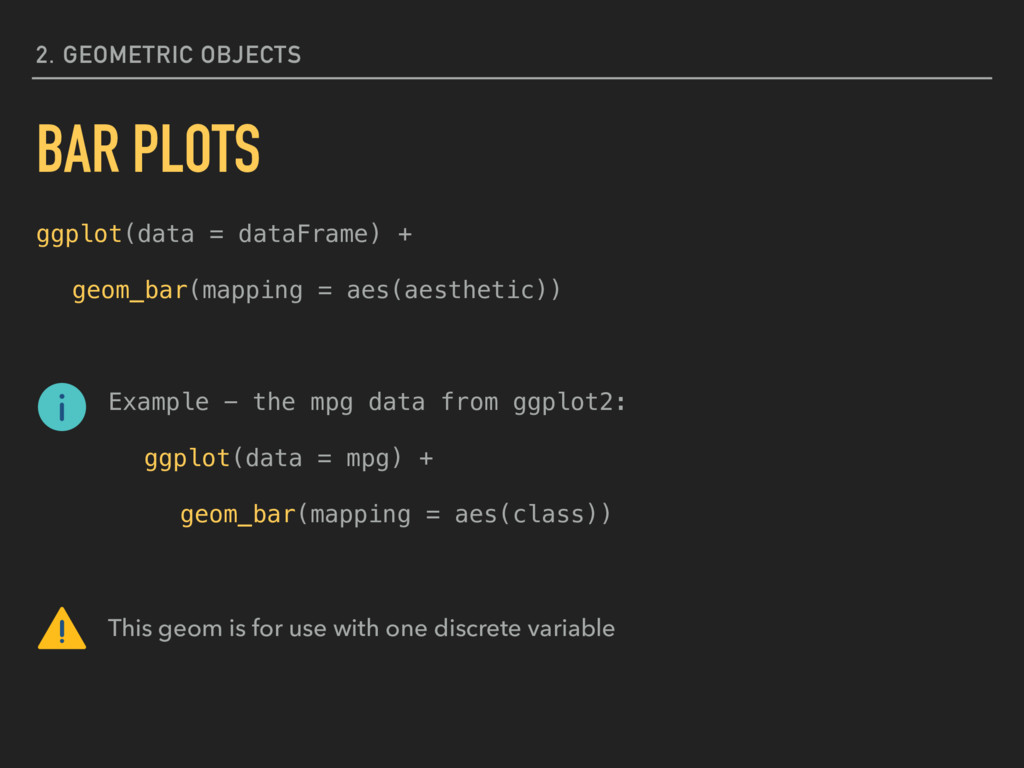
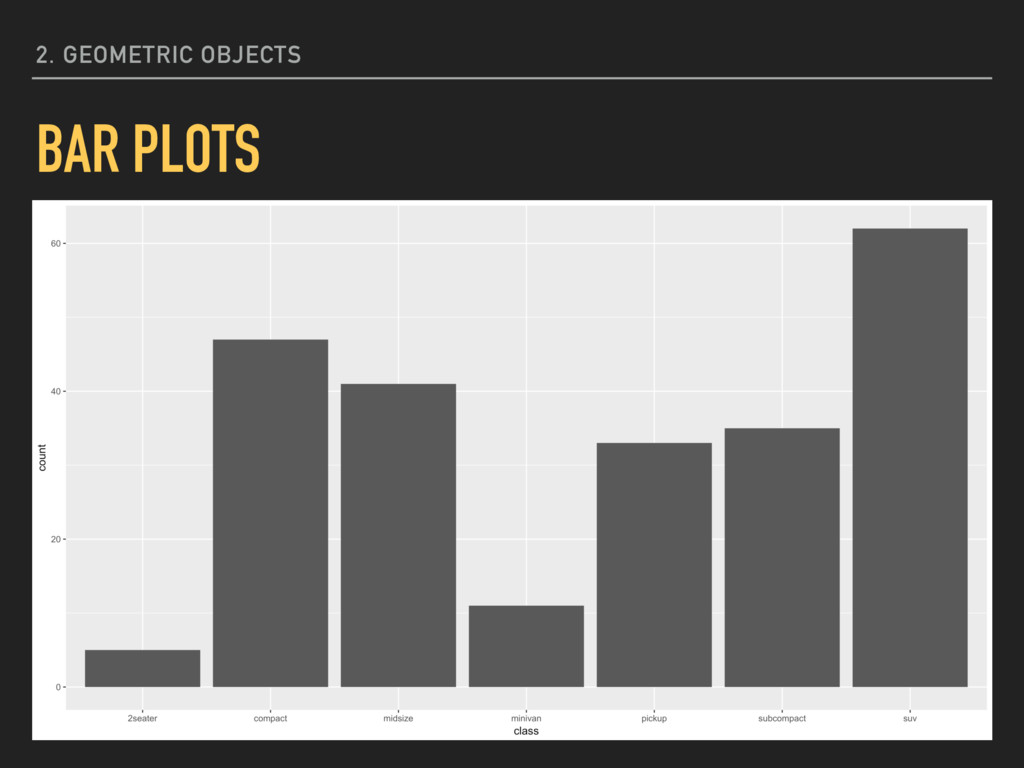
= aes(aesthetic)) Example - the mpg data from ggplot2: ggplot(data = mpg) + geom_bar(mapping = aes(class)) This geom is for use with one discrete variable
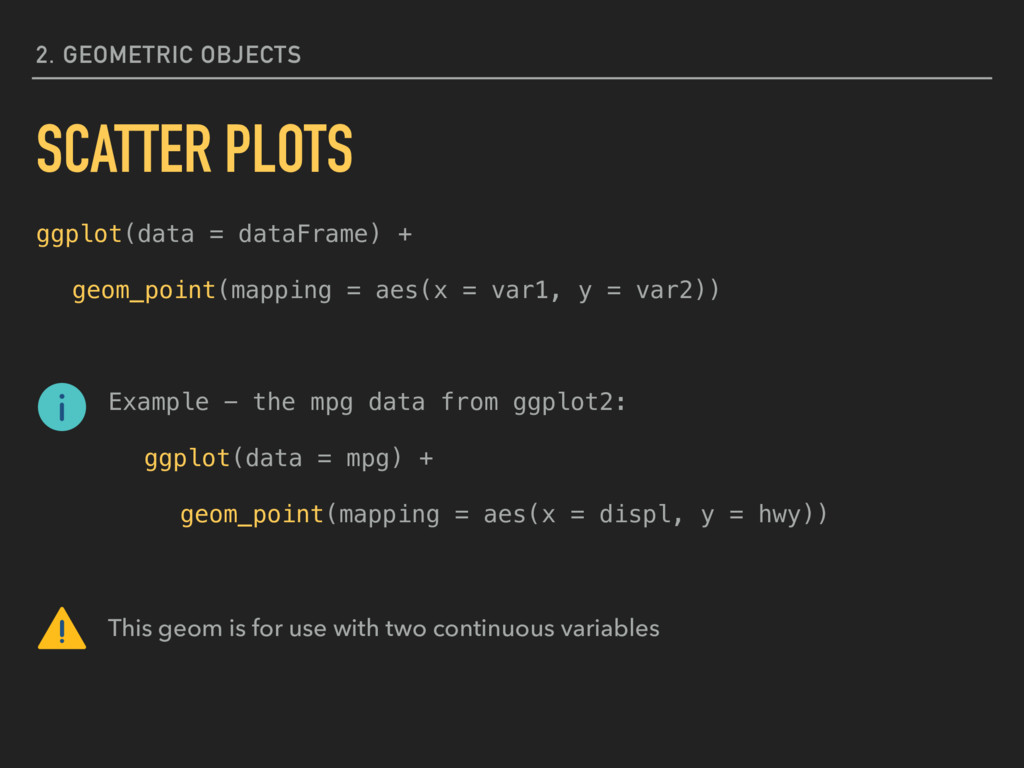
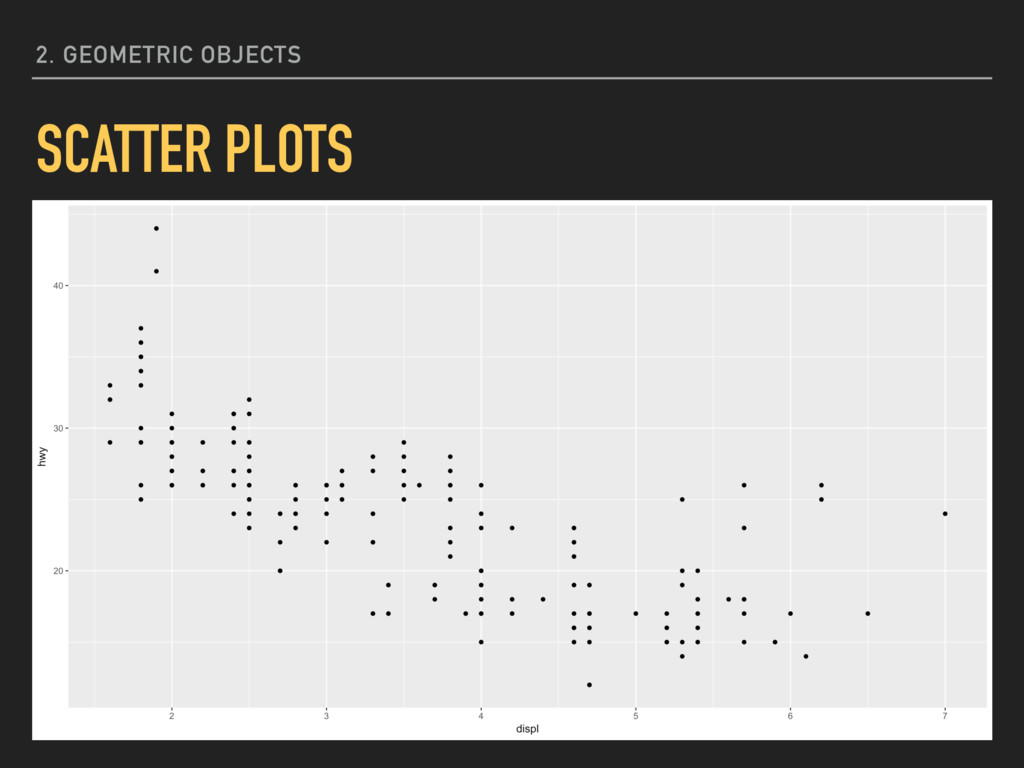
= aes(x = var1, y = var2)) Example - the mpg data from ggplot2: ggplot(data = mpg) + geom_point(mapping = aes(x = displ, y = hwy)) This geom is for use with two continuous variables
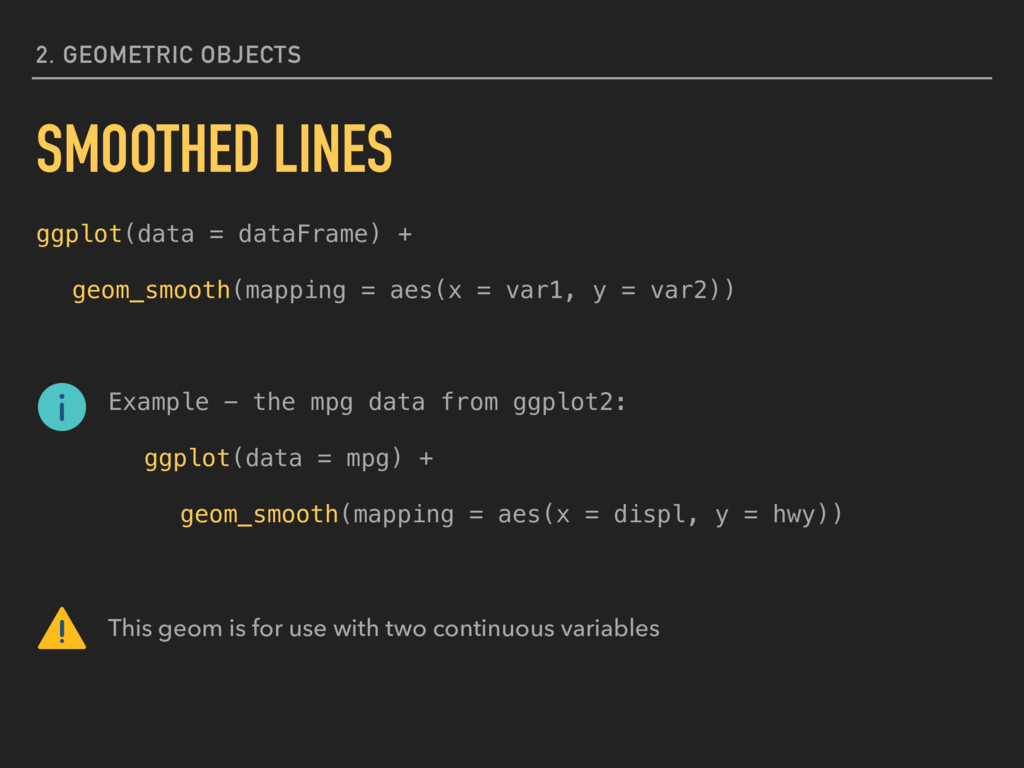
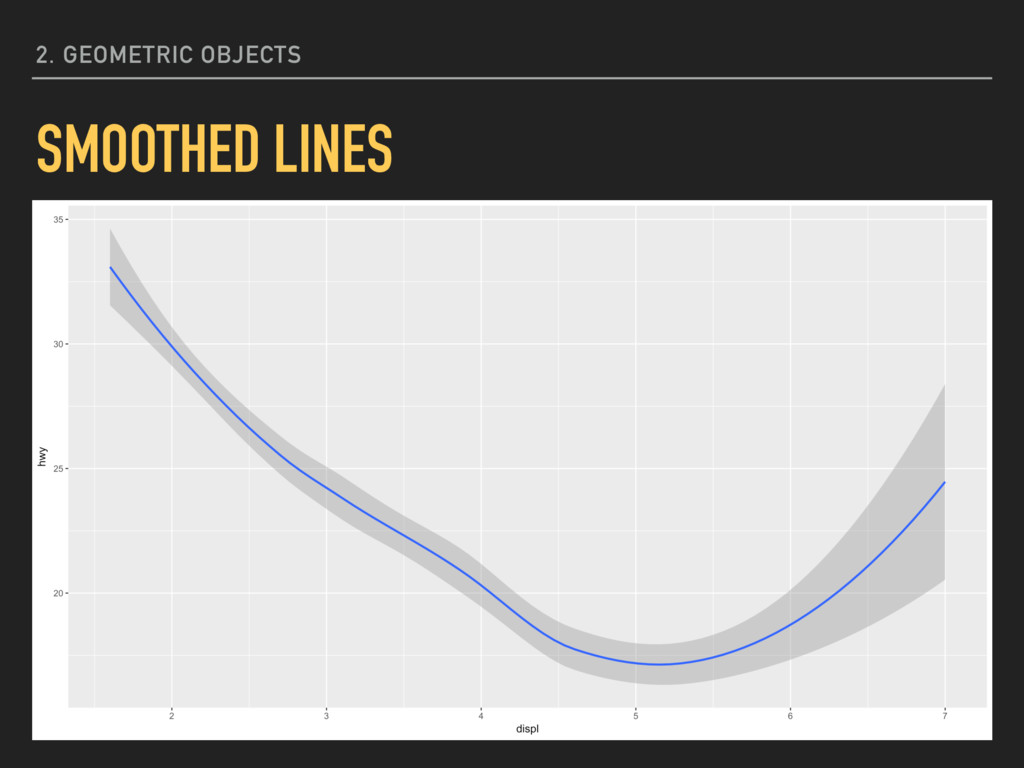
= aes(x = var1, y = var2)) Example - the mpg data from ggplot2: ggplot(data = mpg) + geom_smooth(mapping = aes(x = displ, y = hwy)) This geom is for use with two continuous variables
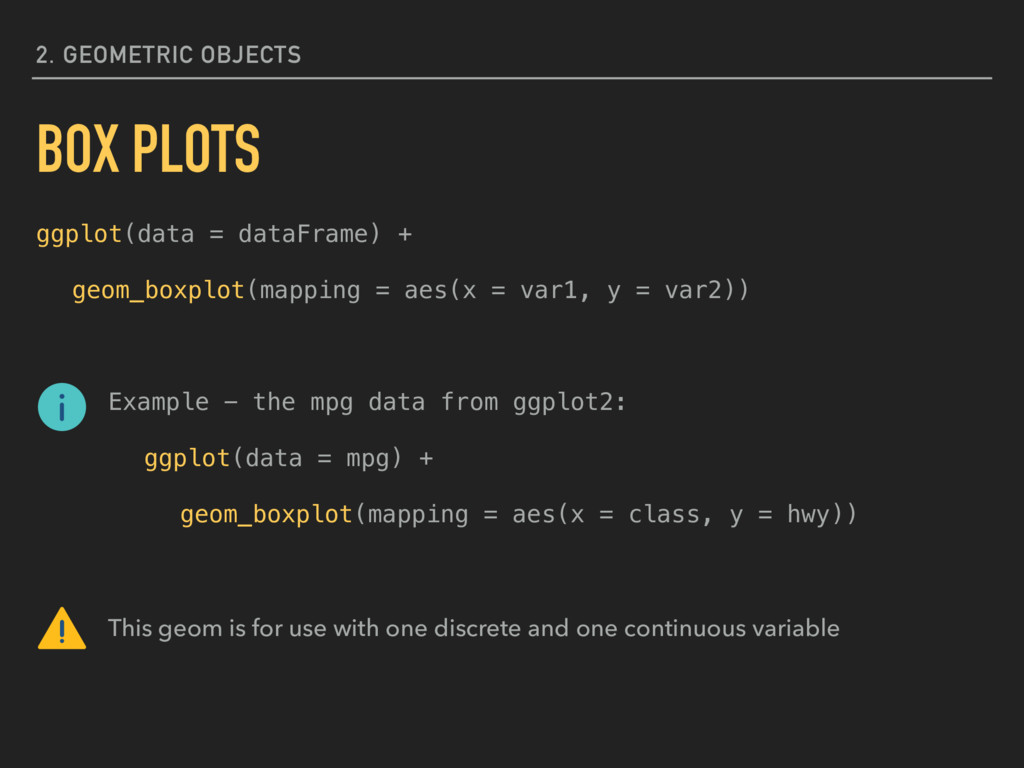
= aes(x = var1, y = var2)) Example - the mpg data from ggplot2: ggplot(data = mpg) + geom_boxplot(mapping = aes(x = class, y = hwy)) This geom is for use with one discrete and one continuous variable