Lecture slides for Week 10 of the Saint Louis University Course Quantitative Analysis: Applied Inferential Statistics. These slides cover the topics related to correlation analyses. Handouts created in RMarkdown are also discussed.
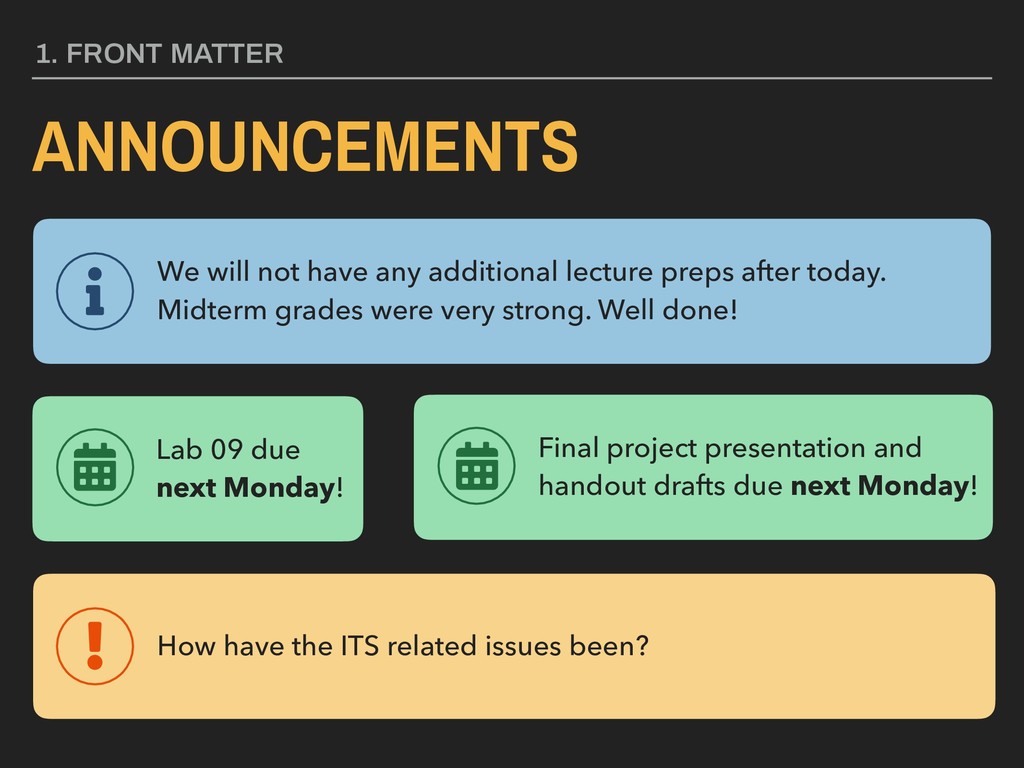
been? Final project presentation and handout drafts due next Monday! Lab 09 due next Monday! We will not have any additional lecture preps after today. Midterm grades were very strong. Well done!
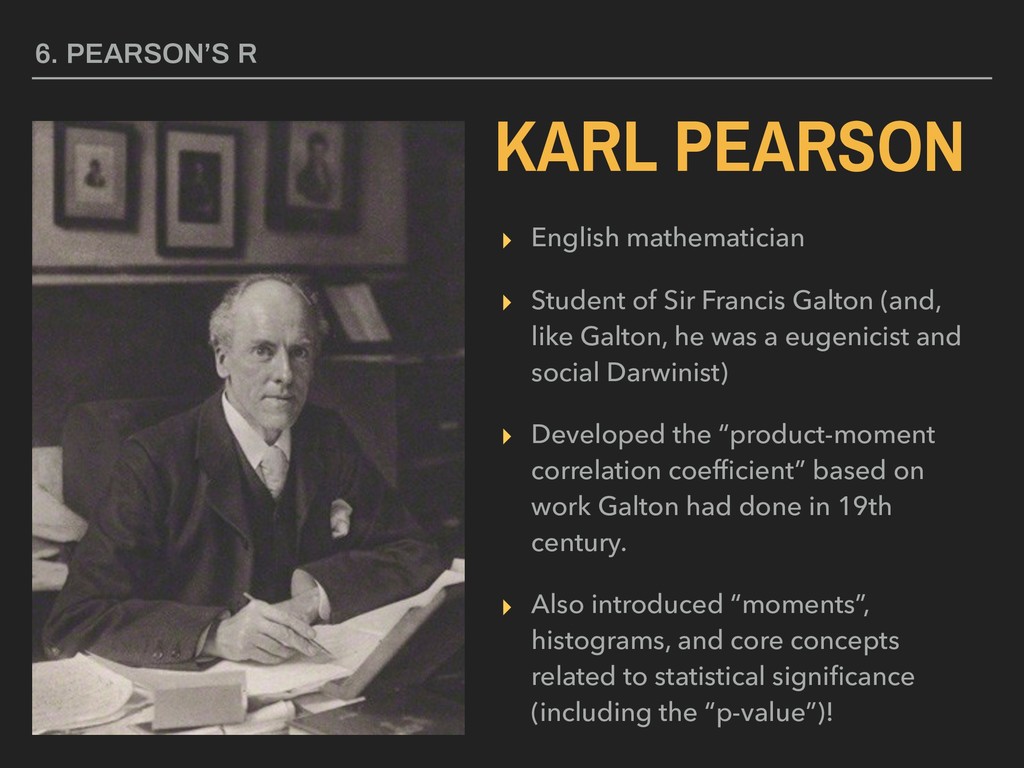
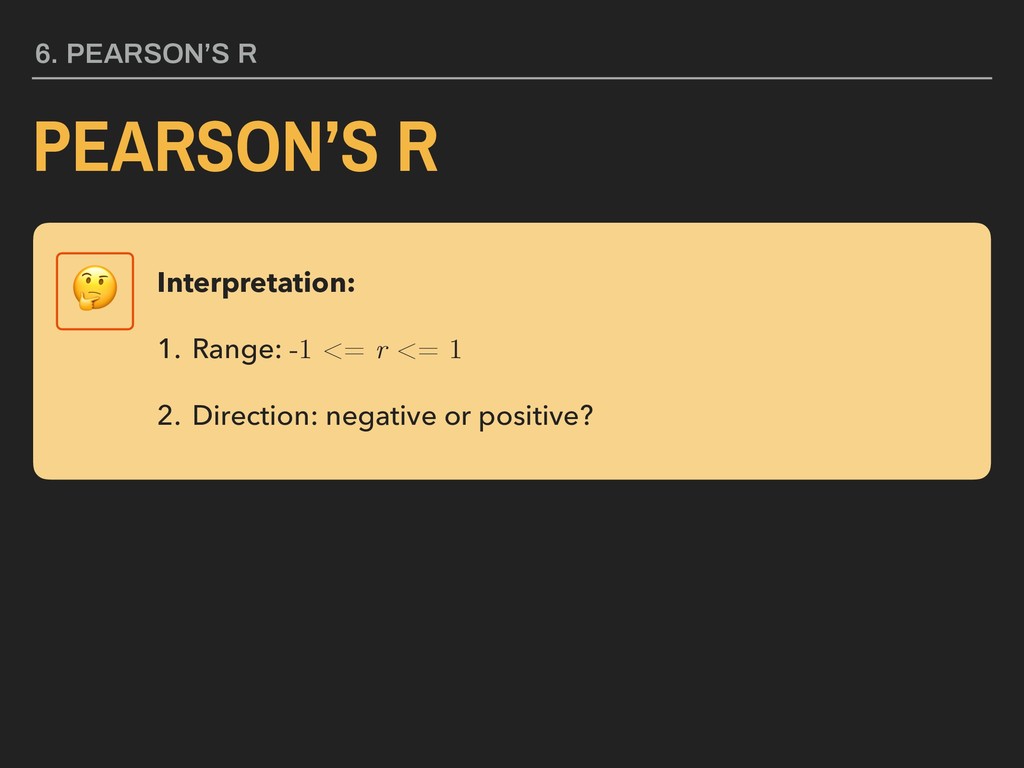
like Galton, he was a eugenicist and social Darwinist) ▸ Developed the “product-moment correlation coefficient” based on work Galton had done in 19th century. ▸ Also introduced “moments”, histograms, and core concepts related to statistical significance (including the “p-value”)! 6. PEARSON’S R KARL PEARSON
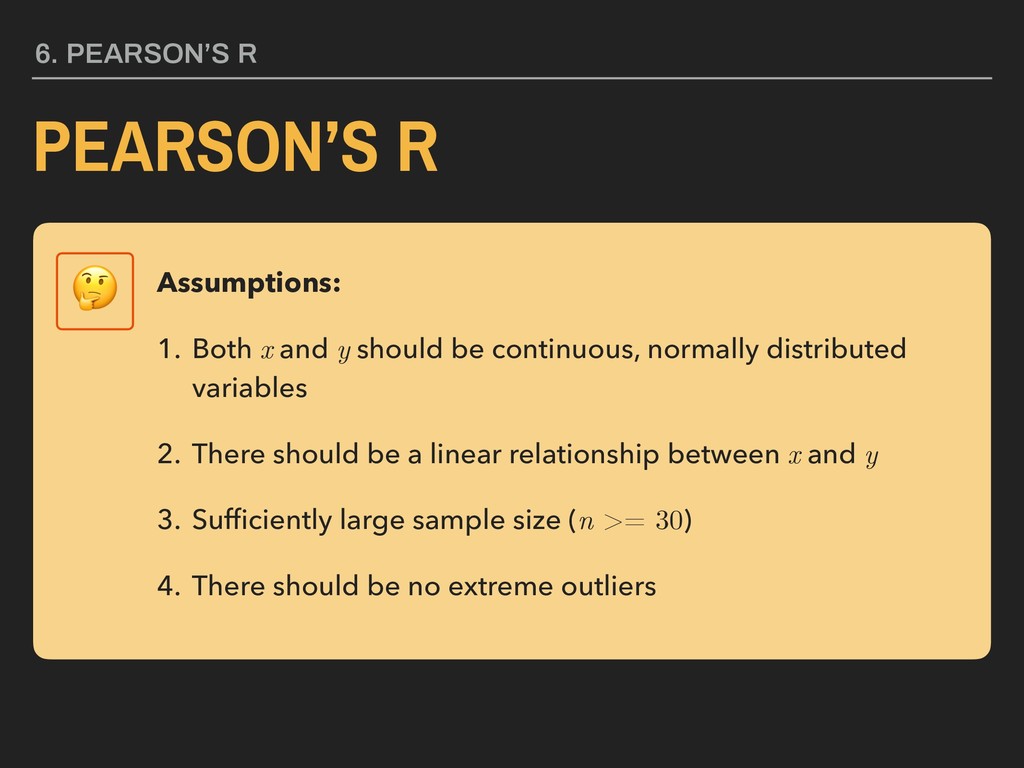
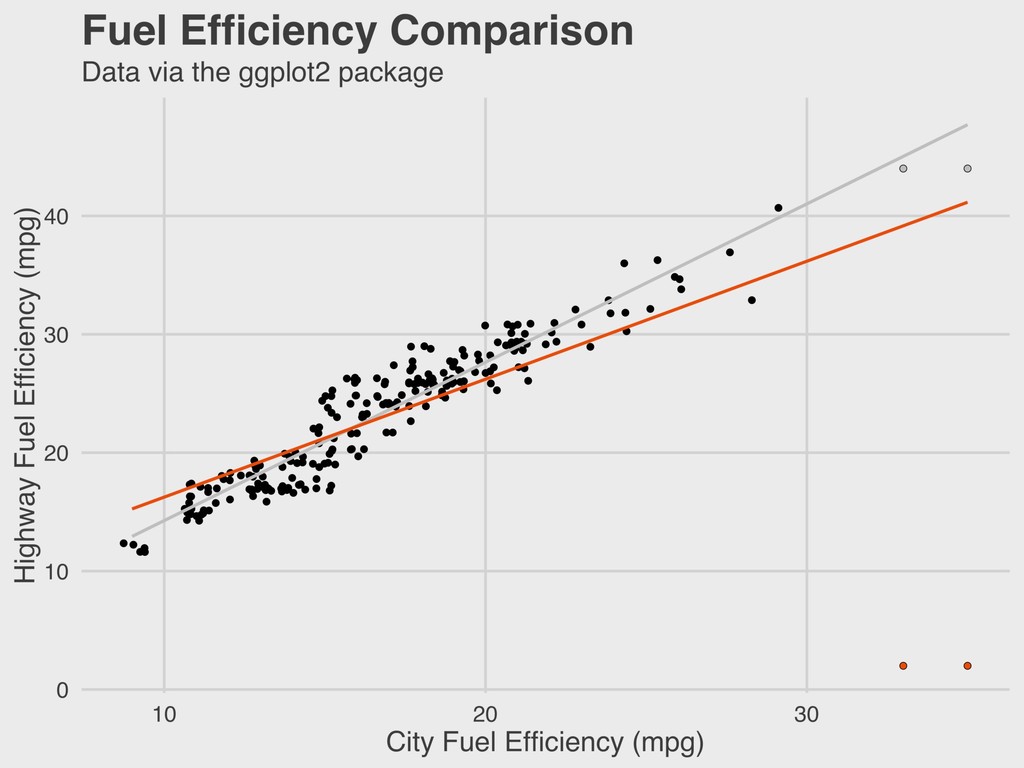
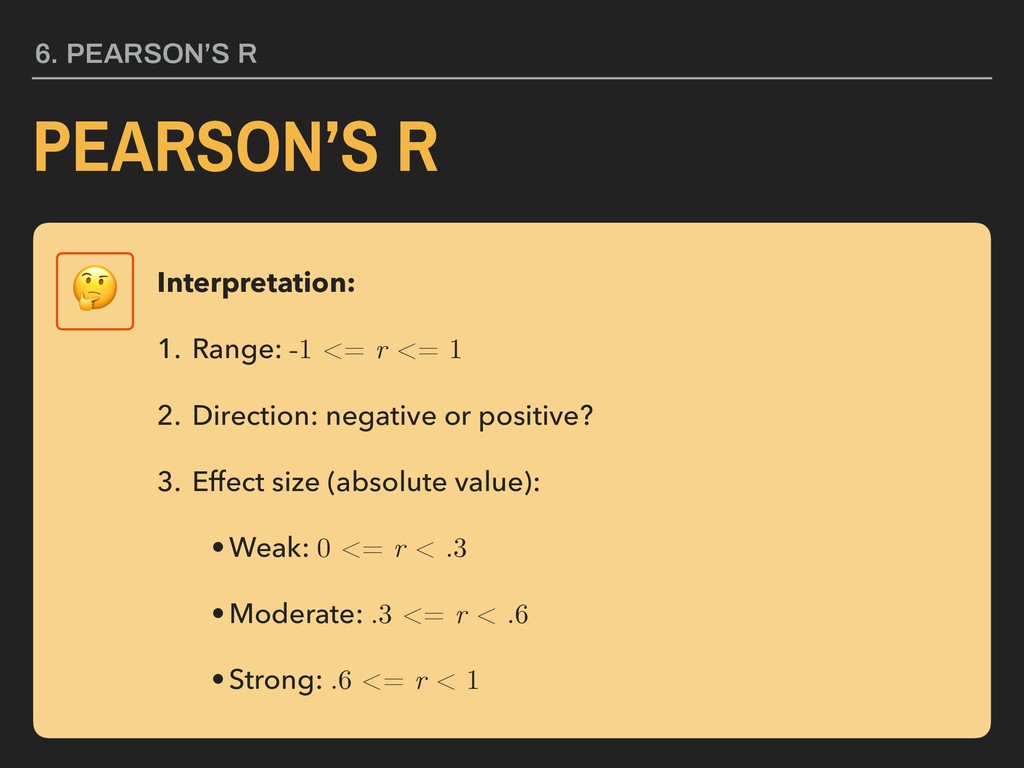
and y should be continuous, normally distributed variables 2. There should be a linear relationship between x and y 3. Sufficiently large sample size (n >= 30) 4. There should be no extreme outliers
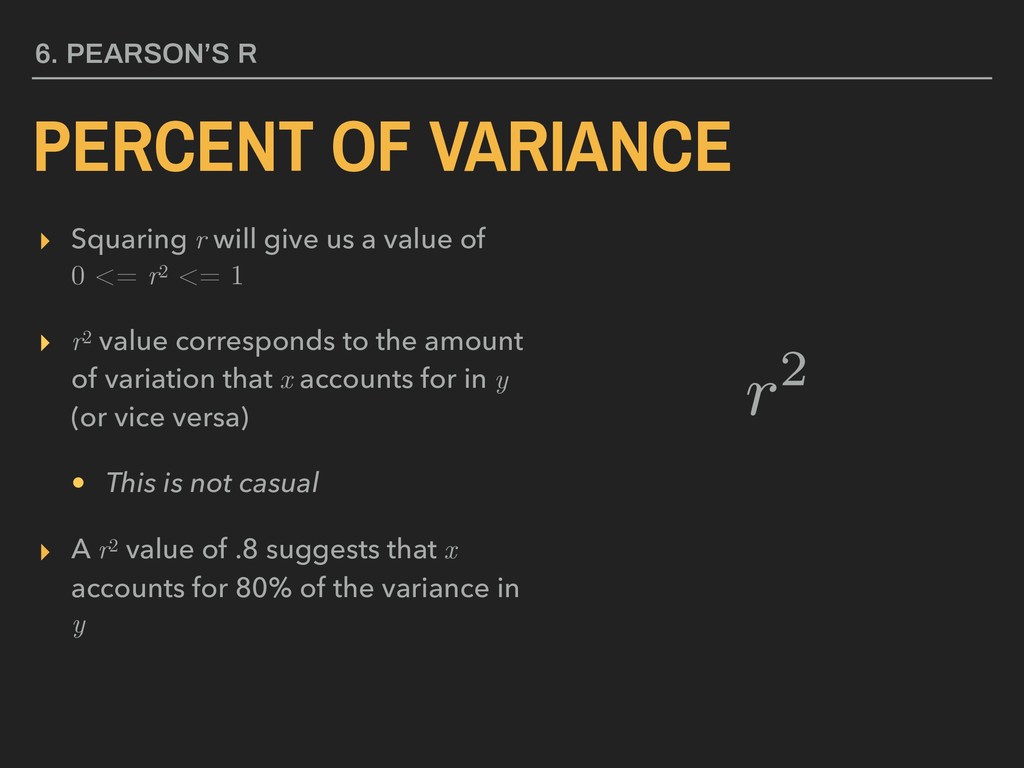
0 <= r2 <= 1 ▸ r2 value corresponds to the amount of variation that x accounts for in y (or vice versa) • This is not casual ▸ A r2 value of .8 suggests that x accounts for 80% of the variance in y 6. PEARSON’S R PERCENT OF VARIANCE
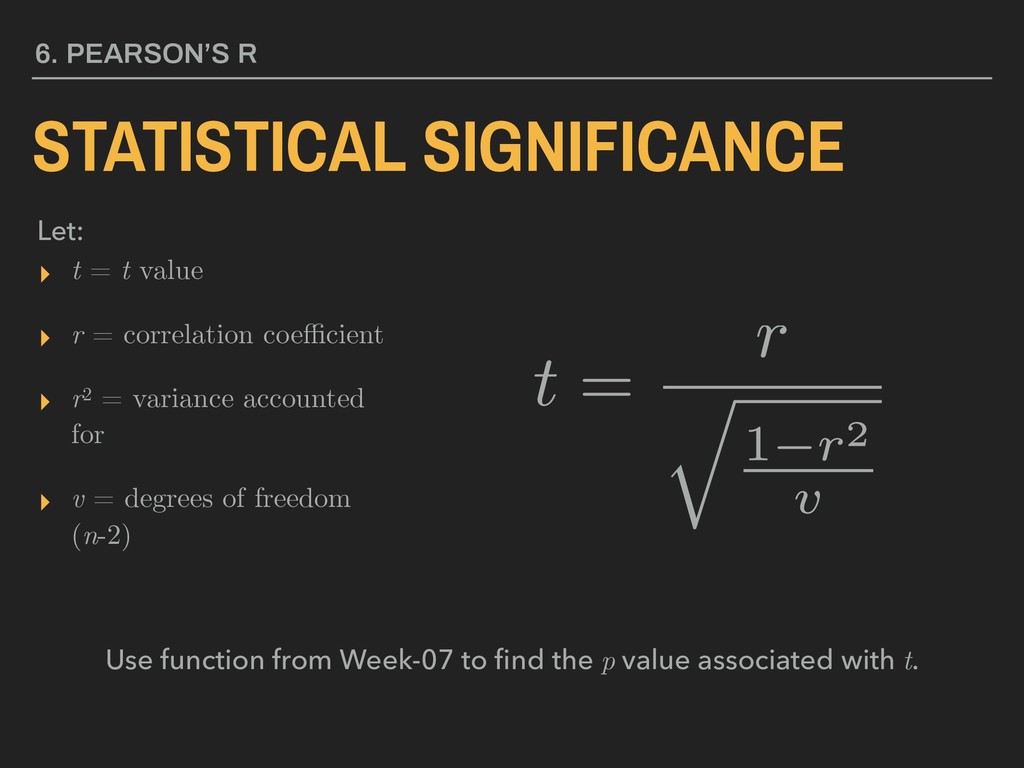
▸ r2 = variance accounted for ▸ v = degrees of freedom (n-2) 6. PEARSON’S R Let: STATISTICAL SIGNIFICANCE Use function from Week-07 to find the p value associated with t.
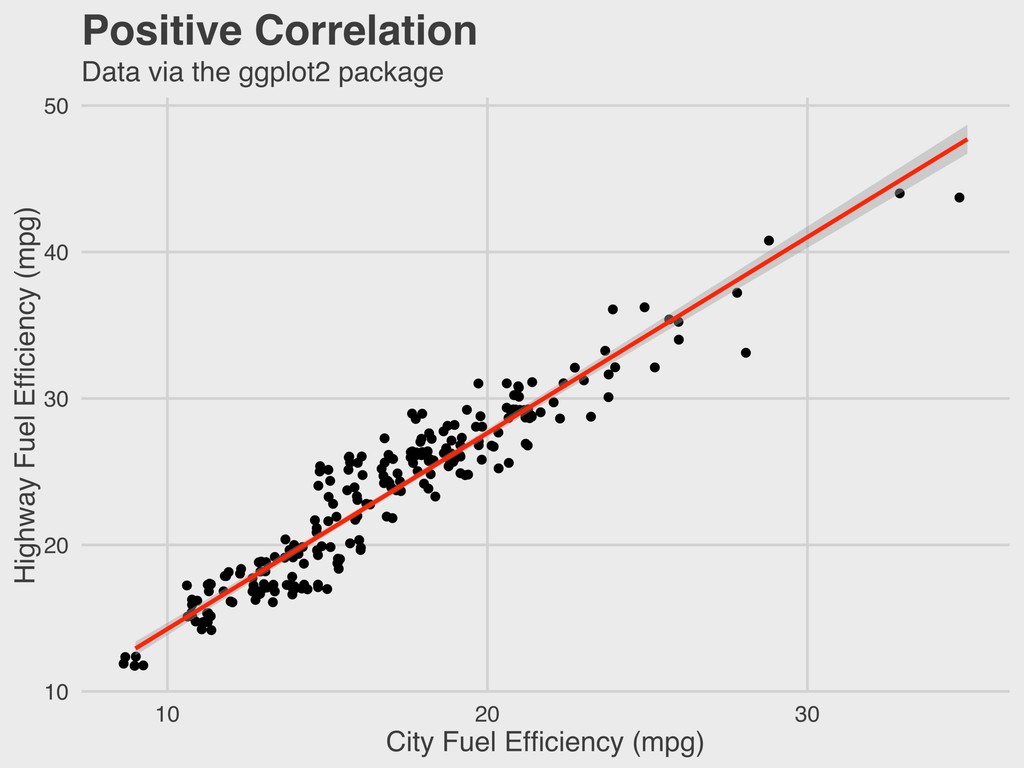
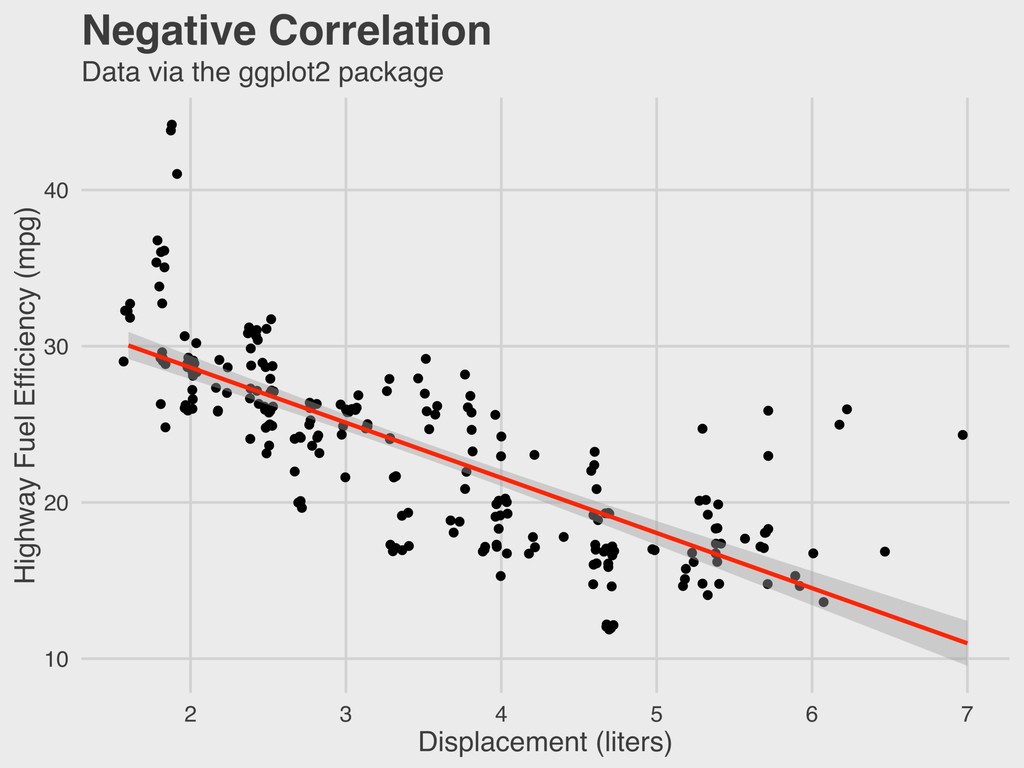
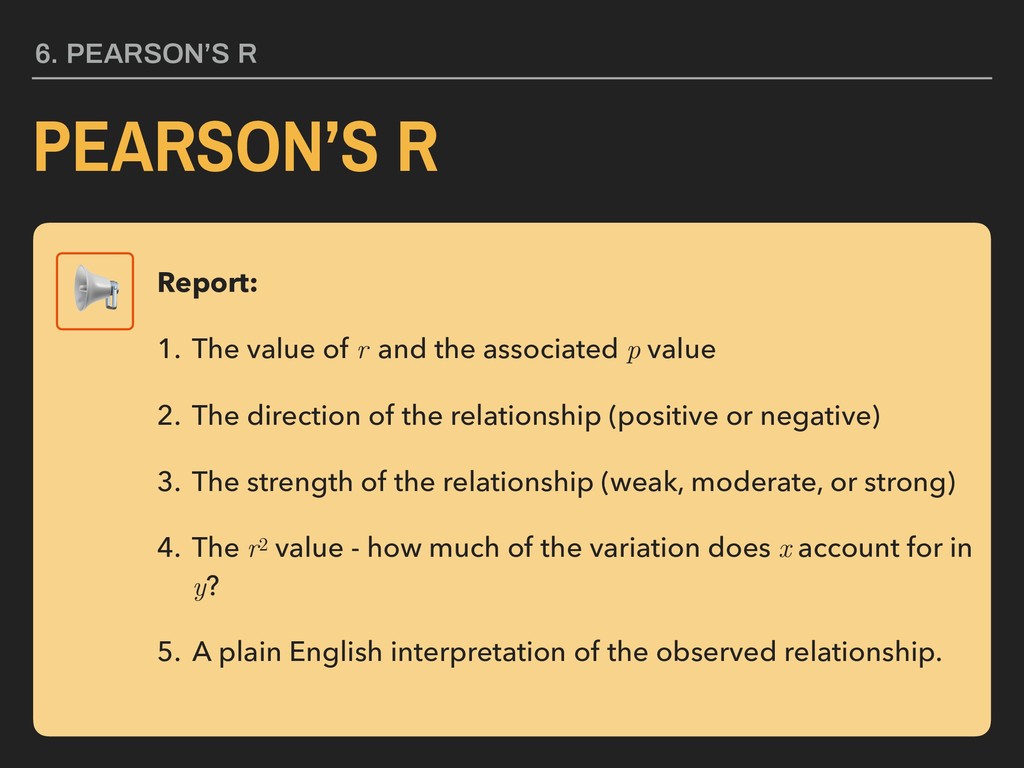
of r and the associated p value 2. The direction of the relationship (positive or negative) 3. The strength of the relationship (weak, moderate, or strong) 4. The r2 value - how much of the variation does x account for in y? 5. A plain English interpretation of the observed relationship.
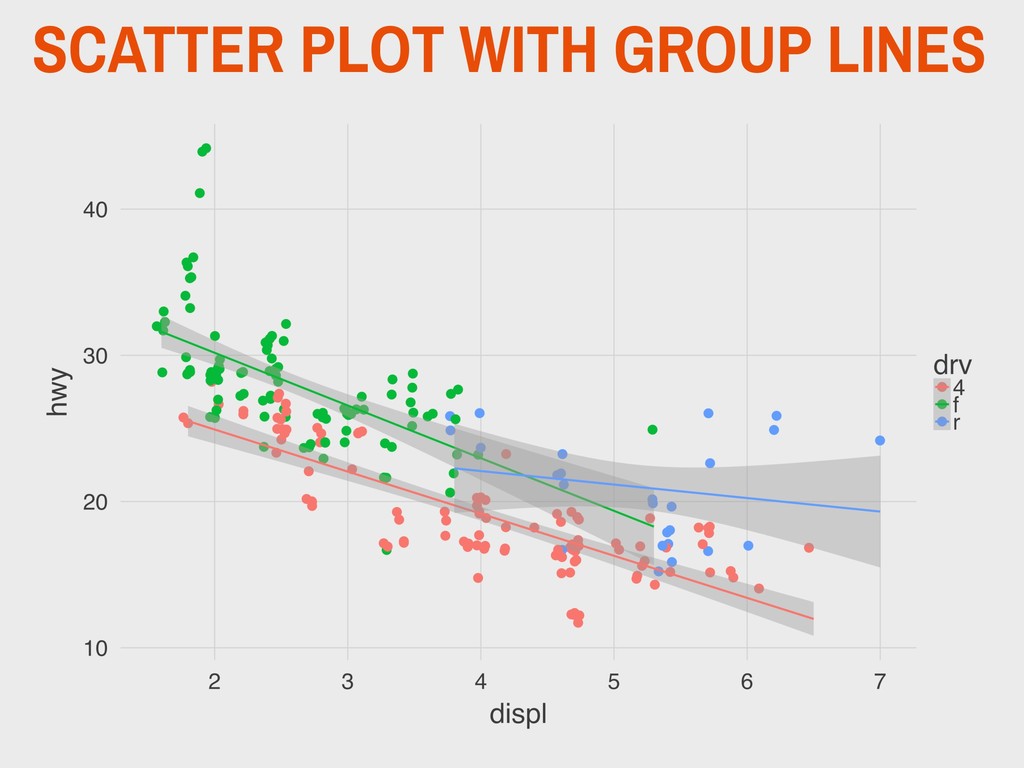
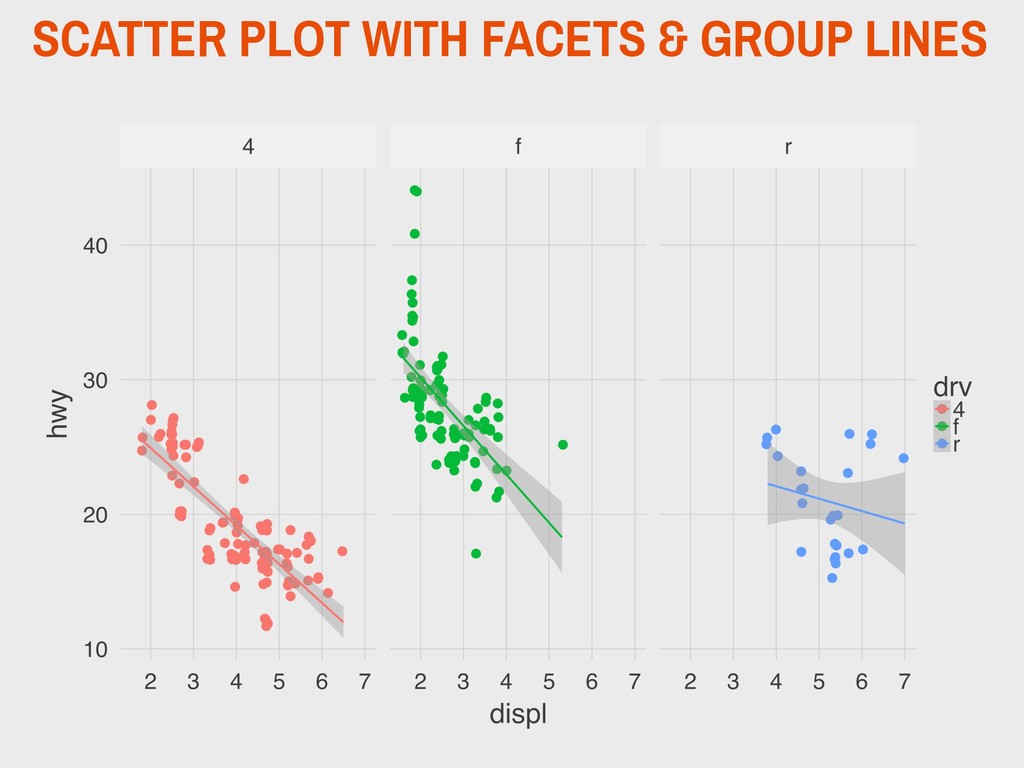
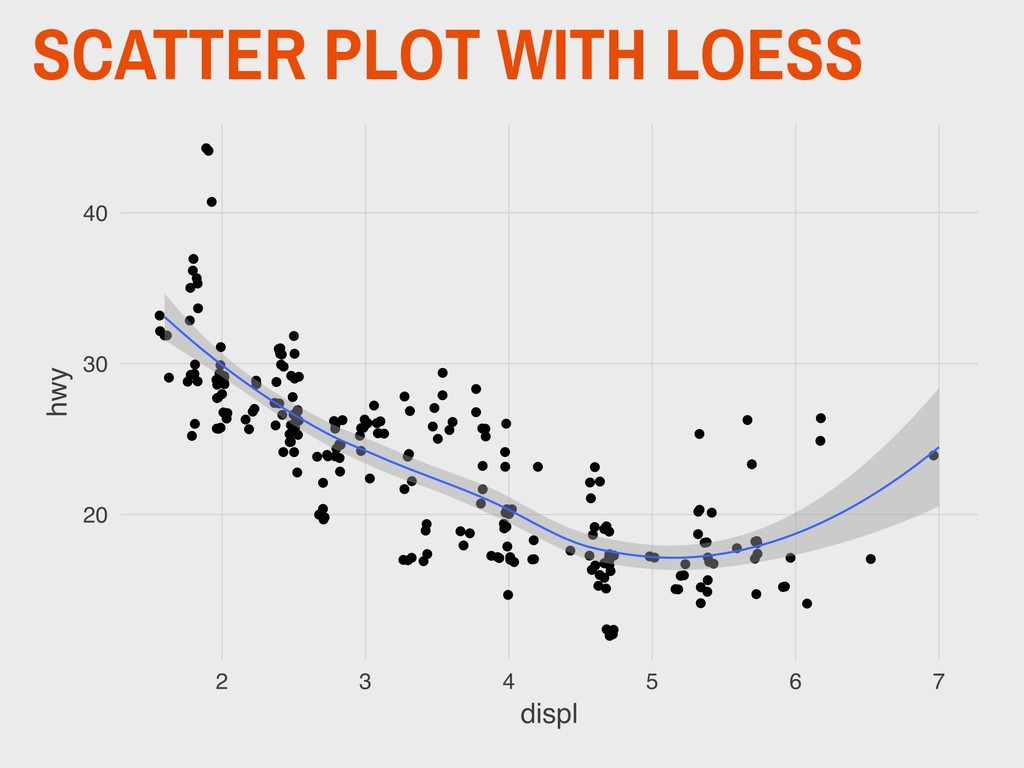
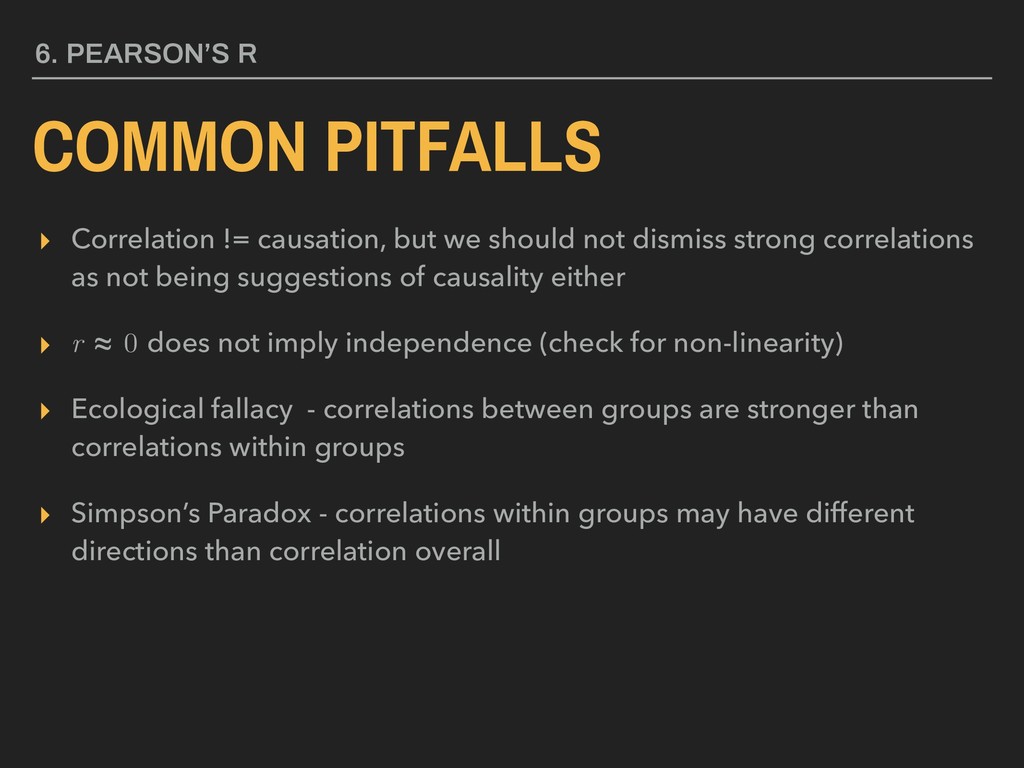
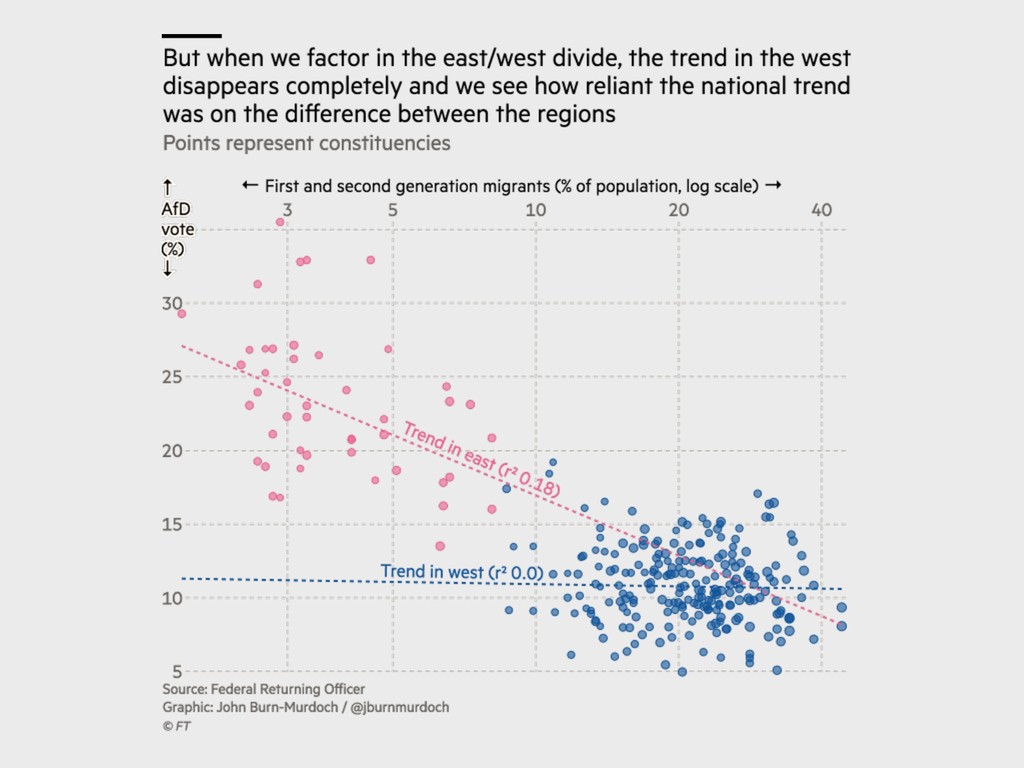
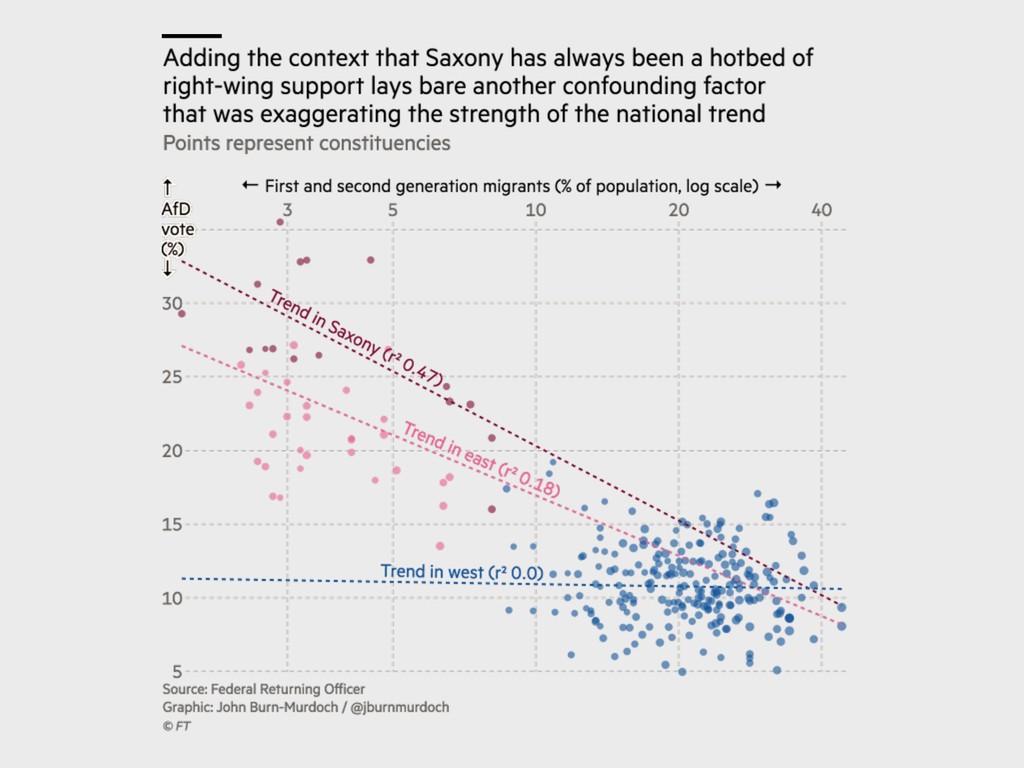
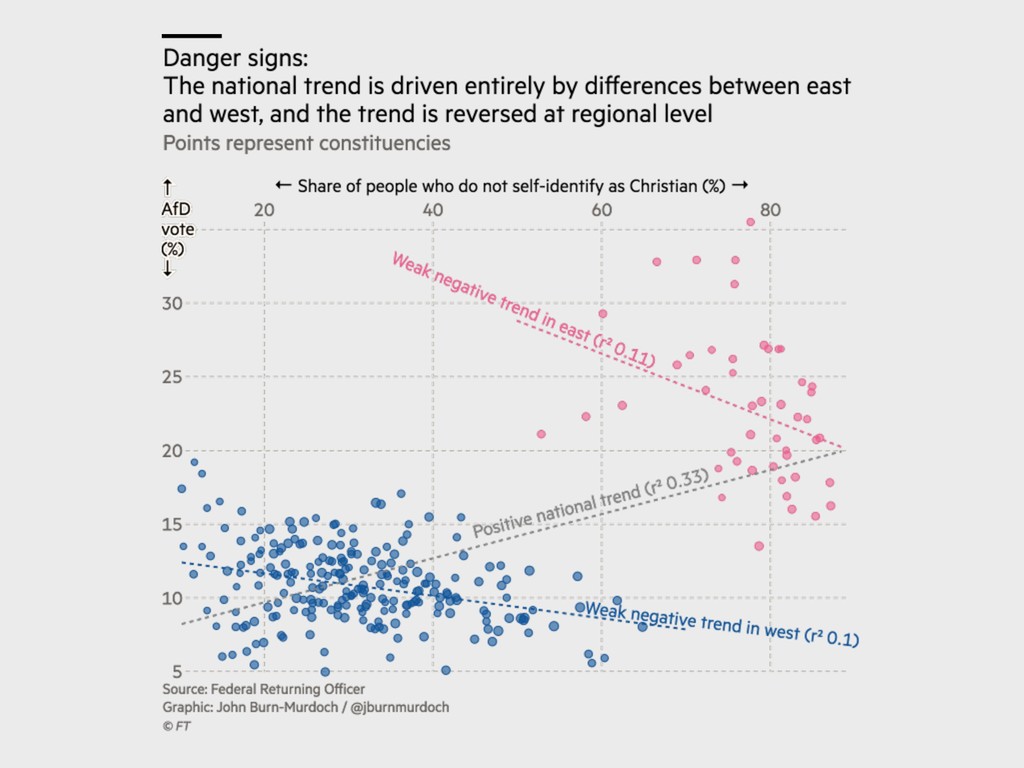
dismiss strong correlations as not being suggestions of causality either ▸ r ≈ 0 does not imply independence (check for non-linearity) ▸ Ecological fallacy - correlations between groups are stronger than correlations within groups ▸ Simpson’s Paradox - correlations within groups may have different directions than correlation overall 6. PEARSON’S R
Midterm grades were very strong. Well done! REMINDERS 7. BACK MATTER Final project presentation and handout drafts due next Monday! Lab 09 due next Monday!