Upgrade to Pro — share decks privately, control downloads, hide ads and more …

Software Microbenchmarking in the Cloud. How Bad is it Really?

Software Microbenchmarking in the Cloud. How Bad is it Really?

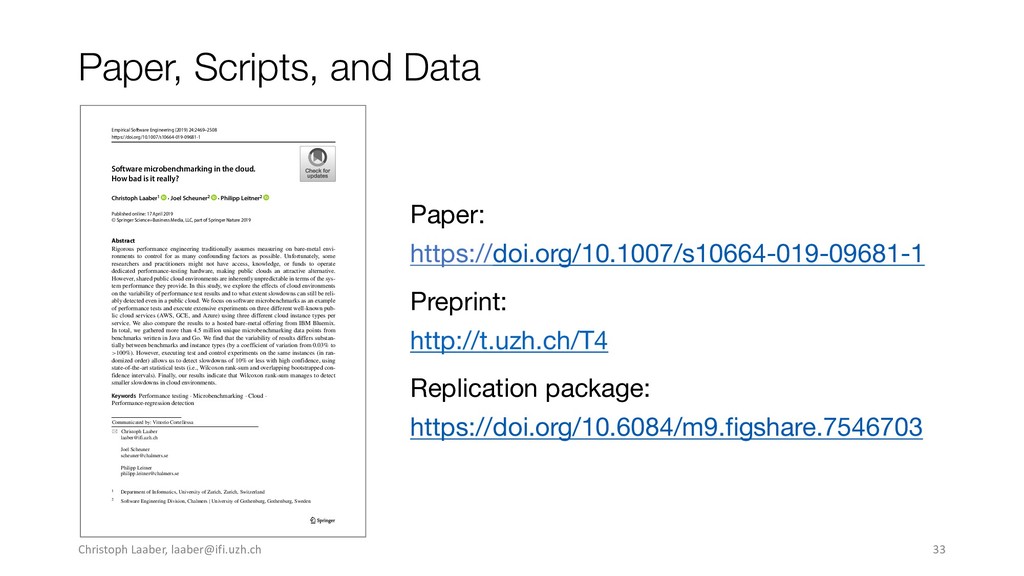
Empirical Software Engineering paper on software microbenchmark result variability and reliability when executed in cloud environments, by Christoph Laaber, Joel Scheuner, and Philipp Leitner. Presented at the 34th IEEE/ACM International Conference on Automated Software Engineering (ASE’ 19), November 11–15, 2019, San Diego, CA, USA.

Christoph Laaber

November 13, 2019
Tweet

More Decks by Christoph Laaber

Other Decks in Research

Transcript

  1. Software Microbenchmarking in the Cloud. How Bad is it Really?

    Christoph Laaber, Joel Scheuner, Philipp Leitner software evolution & architecture lab published in Empirical Software Engineering 24(4) Journal-First 34th IEEE/ACM International Conference on Automated Software Engineering (ASE’ 19), November 11 – 15, 2019, San Diego, CA, USA @ChristophLaaber [email protected] https://www.flickr.com/photos/wetworkphotography/7485255952 http://t.uzh.ch/T4
  2. Why Software Performance Matters! Industry Latency Revenue Research Harder to

    Fix Longer Undiscovered [Jin et al., PLDI’12] [Heger et al., ICPE’13] Open-Source use Christoph Laaber, [email protected] 2
  3. One Potential Solution Industry Latency Revenue Research Harder to Fix

    Longer Undiscovered [Jin et al., PLDI’12] [Heger et al., ICPE’13] Open-Source use Software Microbenchmarks Christoph Laaber, [email protected] 3
  4. What are Software Microbenchmarks? Benchmark density result values Results Execution

    Runtime Throughput Variability/Stability Iterations Trials Machines Unit-level Performance Test Statements/Methods Christoph Laaber, [email protected] 6
  5. What are Software Microbenchmarks? Benchmark Results Comparison Execution Iterations Trials

    Machines density result values v1 v2 = ? Statistical Test Slowdown/Improvement Unit-level Performance Test Runtime Throughput Statements/Methods Christoph Laaber, [email protected] 7
  6. Best Practice Execution Environment Benchmark No virtualization Bare-metal machine Single

    tenant No background processes/services No hardware/software optimizations density execution time Christoph Laaber, [email protected] 8
  7. Why Execute Benchmarks in the Cloud then? Long benchmarking run

    times Unavailability of / no training for bare-metal machines Hosted continuous integration services Little set-up and maintenance effort Christoph Laaber, [email protected] 9
  8. Problems with Cloud Execution Benchmark Virtual machines or containers Cloud

    instance Co-located neighbors Background services (e.g., monitoring) No control over hw/sw optimizations density execution time Christoph Laaber, [email protected] 10
  9. Which slowdown sizes can we reliably detect? How variable are

    microbenchmarks executed in different environments? RQ 1 RQ 2 Empirically study microbenchmark executions in unreliable environments and simulate detectable slowdowns Christoph Laaber, [email protected] 11
  10. Methodology Benchmarks Execution Environments 4 OSS projects 2 languages 19

    benchmarks 3 cloud provider à 3 instance types 1 bare metal server Configurations #190 RQ1: Variability Analysis > 4.5 mio data points: 50 iterations à 1s 10 trials 50 instances < 5% False Positives > 95% True Positives MSR’18 sample Benchmark Execution RQ2: Reliable Slowdown Detection Christoph Laaber, [email protected] 12
  11. Which slowdown sizes can we reliably detect? How variable are

    microbenchmarks executed in different environments? RQ 1 RQ 2 Christoph Laaber, [email protected] 13
  12. RQ 1: Variability -- Results Range between 0.03% and >100%

    CV 1 2 3 3 groups of benchmarks Christoph Laaber, [email protected] 15
  13. RQ 1: Variability -- Results Range between 0.03% and >100%

    CV No variability => stable 1 2 3 Christoph Laaber, [email protected] 16
  14. RQ 1: Variability -- Results Range between 0.03% and >100%

    CV No variability => stable 1 Variable in all environments 2 3 Christoph Laaber, [email protected] 17
  15. RQ 1: Variability -- Results Range between 0.03% and >100%

    CV No variability => stable 1 Variable in all environments 2 Variability changes 3 Christoph Laaber, [email protected] 18
  16. RQ 1: Variability -- Results Range between 0.03% and >100%

    CV No variability => stable AWS and BM similarly stable 1 Variable in all environments 2 Variability changes 3 Christoph Laaber, [email protected] 19
  17. Which slowdown sizes can we reliably detect? How variable are

    microbenchmarks executed in different environments? RQ 1 RQ 2 Christoph Laaber, [email protected] 20
  18. Which slowdown sizes can we reliably detect? How variable are

    microbenchmarks executed in different environments? RQ 1 RQ 2 Christoph Laaber, [email protected] 21
  19. RQ 2: Detection Simulation -- Method Version Testing Batch Testing

    time tn Benchmarks vn Execution Results vn tn+1 Benchmarks vn+1 Execution Results vn+1 Benchmarks vn-1 Benchmarks vn Execution Results vn-1 Execution Results vn time tn-1 tn = ? = ? Christoph Laaber, [email protected] 22
  20. = ? = ? RQ 2: Detection Simulation -- Method

    Version Testing Batch Testing time tn Benchmarks vn Execution Results vn tn+1 Benchmarks vn+1 Execution Results vn+1 Benchmarks vn-1 Benchmarks vn Execution Results vn-1 Execution Results vn time tn-1 tn Sample Sizes Unchanged Code Simulated Slowdown < 5% False Positives > 95% True Positives Christoph Laaber, [email protected] 23
  21. 0% 25% 50% 75% 100% 0% 2% 4% 6% 8%

    RQ 2: False Positives -- Results Density Version Testing Batch Testing False Positives 0% 10% 20% 30% 0% 20% 40% 60% Christoph Laaber, [email protected] 24
  22. # Configurations Slowdown Sizes % % % % % %

    % % RQ 2: Smallest Slowdowns -- Results Reliable slowdown detection: 9% 1 15% 5 23% 10 88% 20 Version Testing Christoph Laaber, [email protected] 25
  23. # Configurations Slowdown Sizes % % % % % %

    % % RQ 2: Smallest Slowdowns -- Results Slowdowns <= 10%: 64% configurations 20 Reliable slowdown detection: 9% 1 15% 5 23% 10 88% 20 Version Testing Christoph Laaber, [email protected] 26
  24. RQ 2: Smallest Slowdowns -- Results # Configurations Slowdown Sizes

    Batch Testing % % % % % % % % % % % % % % % % # Configurations % % % % % % % % Version Testing Christoph Laaber, [email protected] 27
  25. RQ 2: Smallest Slowdowns -- Results % % % %

    % % % % # Configurations Slowdown Sizes Reliable slowdown detection: 25% 1 97% 5 100% 10 100% 20 Batch Testing Christoph Laaber, [email protected] 28
  26. % % % % % % % % # Configurations

    Slowdown Sizes RQ 2: Smallest Slowdowns -- Results Slowdowns <= 10%: 79% configurations 5 Reliable slowdown detection: 25% 1 97% 5 100% 10 100% 20 Batch Testing Christoph Laaber, [email protected] 29
  27. What have we learned? Always check for false positives Batch

    testing increases reliability Detection of 5%-10% slowdowns often possible IBM bare-metal and AWS instances deliver stable results Christoph Laaber, [email protected] 30
  28. Future Ahead! Automatically decide how often to replicate executions Prioritize/select

    reliable benchmarks Generate reliable benchmarks Help developers writing tests that have stable results Christoph Laaber, [email protected] 31
  29. @ChristophLaaber [email protected] Software Microbenchmarking in the Cloud. How Bad is

    it Really? Christoph Laaber, Joel Scheuner, Philipp Leitner software evolution & architecture lab Future Ahead! Automatically decide how often to replicate executions Prioritize/select benchmarks that are reliable Generate benchmarks that are reliable Help developers write tests that have stable results https://doi.org/10.1007/s10664-019-09681-1 http://t.uzh.ch/T4 Problems with Cloud Execution Benchmark Virtual machines or containers Cloud instance Co-located neighbors Background services (e.g., monitoring) No control over hw/sw optimizations density execution time RQ 1: Variability -- Results Range between 0.03% and >100% CV No variability => stable AWS and BM similarly stable 1 Variable in all environments 2 Variability changes 3 RQ 2: Smallest Slowdowns -- Results # Configurations Slowdown Sizes Batch Testing % % % % % % % % % % % % % % % % # Configurations % % % % % % % % Version Testing Why Execute Benchmarks in the Cloud then? Long benchmarking run times Unavailability of / no training for bare-metal machines Hosted continuous integration services Little set-up and maintenance effort 0% 25% 50% 75% 100% 0% 2% 4% 6% 8% RQ 2: False Positives -- Results Density Version Testing Batch Testing False Positives 0% 10% 20% 30% 0% 20% 40% 60%
  30. Paper, Scripts, and Data https://doi.org/10.6084/m9.figshare.7546703 Replication package: Paper: https://doi.org/10.1007/s10664-019-09681-1 Preprint:

    http://t.uzh.ch/T4 Empirical Software Engineering (2019) 24:2469–2508 https://doi.org/10.1007/s10664-019-09681-1 Software microbenchmarking in the cloud. How bad is it really? Christoph Laaber1 · Joel Scheuner2 · Philipp Leitner2 Published online: 17 April 2019 © Springer Science+Business Media, LLC, part of Springer Nature 2019 Abstract Rigorous performance engineering traditionally assumes measuring on bare-metal envi- ronments to control for as many confounding factors as possible. Unfortunately, some researchers and practitioners might not have access, knowledge, or funds to operate dedicated performance-testing hardware, making public clouds an attractive alternative. However, shared public cloud environments are inherently unpredictable in terms of the sys- tem performance they provide. In this study, we explore the effects of cloud environments on the variability of performance test results and to what extent slowdowns can still be reli- ably detected even in a public cloud. We focus on software microbenchmarks as an example of performance tests and execute extensive experiments on three different well-known pub- lic cloud services (AWS, GCE, and Azure) using three different cloud instance types per service. We also compare the results to a hosted bare-metal offering from IBM Bluemix. In total, we gathered more than 4.5 million unique microbenchmarking data points from benchmarks written in Java and Go. We find that the variability of results differs substan- tially between benchmarks and instance types (by a coefficient of variation from 0.03% to >100%). However, executing test and control experiments on the same instances (in ran- domized order) allows us to detect slowdowns of 10% or less with high confidence, using state-of-the-art statistical tests (i.e., Wilcoxon rank-sum and overlapping bootstrapped con- fidence intervals). Finally, our results indicate that Wilcoxon rank-sum manages to detect smaller slowdowns in cloud environments. Keywords Performance testing · Microbenchmarking · Cloud · Performance-regression detection Communicated by: Vittorio Cortellessa Christoph Laaber [email protected] Joel Scheuner [email protected] Philipp Leitner [email protected] 1 Department of Informatics, University of Zurich, Zurich, Switzerland 2 Software Engineering Division, Chalmers | University of Gothenburg, Gothenburg, Sweden Christoph Laaber, [email protected] 33