| John Carroll, III III. South Market | Caleb Hudak IV. Cambridge Market | Ben Coffin V. Investment Market | Tony Hayes VI. Retail Market | Todd Alexander VII. Q&A Session
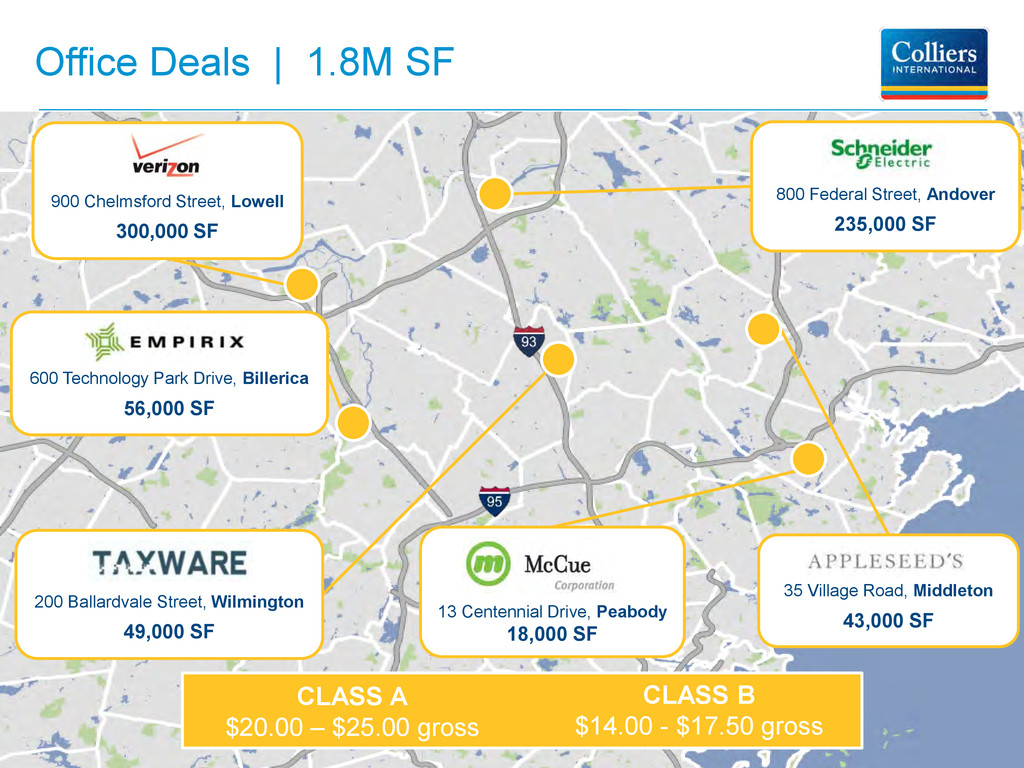
SF CLASS A $20.00 – $25.00 gross CLASS B $14.00 - $17.50 gross 900 Chelmsford Street, Lowell 300,000 SF 600 Technology Park Drive, Billerica 56,000 SF 200 Ballardvale Street, Wilmington 49,000 SF 13 Centennial Drive, Peabody 18,000 SF 800 Federal Street, Andover 235,000 SF
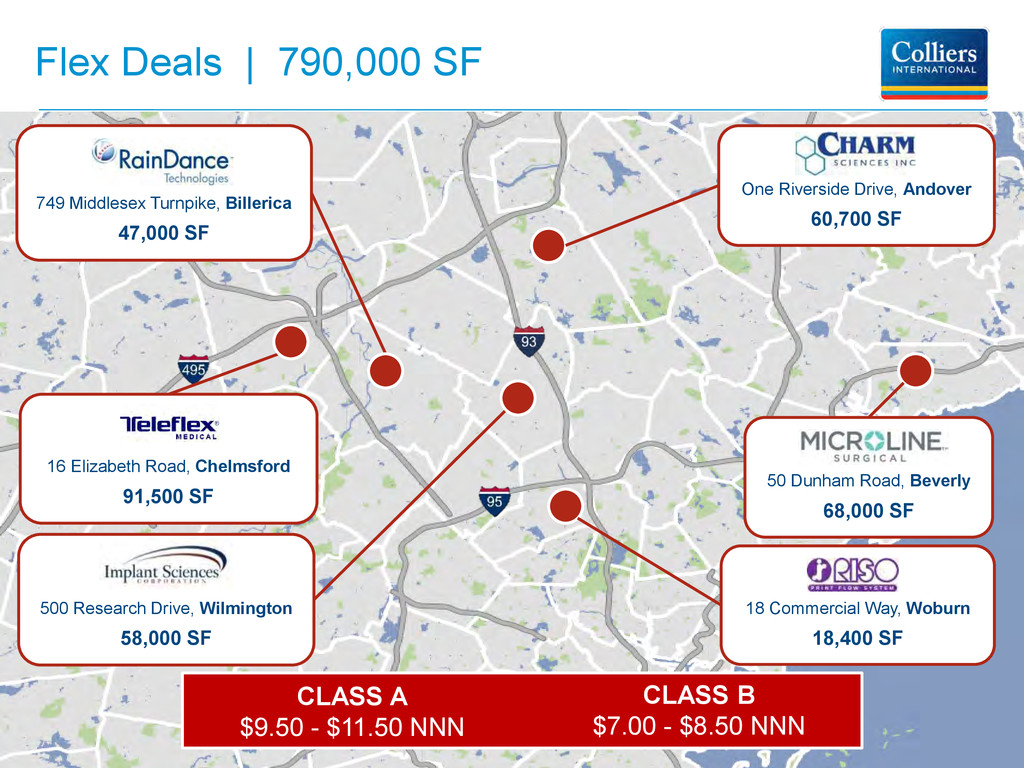
SF One Riverside Drive, Andover 60,700 SF 50 Dunham Road, Beverly 68,000 SF CLASS A $9.50 - $11.50 NNN CLASS B $7.00 - $8.50 NNN 749 Middlesex Turnpike, Billerica 47,000 SF 500 Research Drive, Wilmington 58,000 SF 16 Elizabeth Road, Chelmsford 91,500 SF
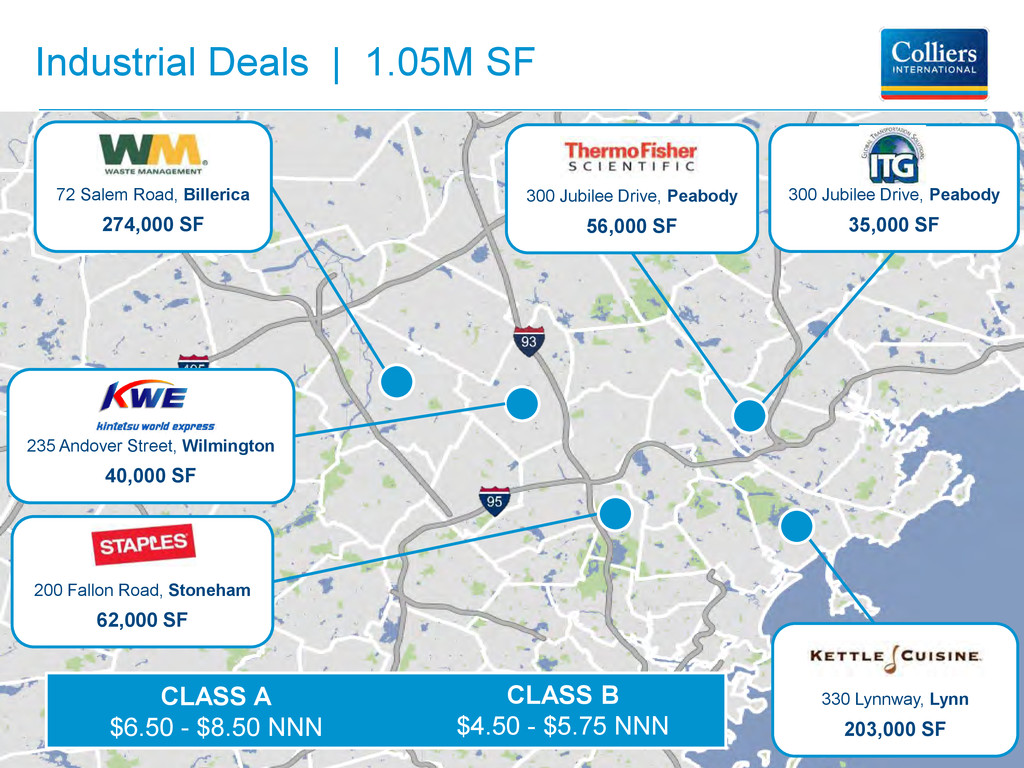
40,000 SF Industrial Deals | 1.05M SF 200 Fallon Road, Stoneham 62,000 SF 330 Lynnway, Lynn 203,000 SF CLASS A $6.50 - $8.50 NNN CLASS B $4.50 - $5.75 NNN 300 Jubilee Drive, Peabody 56,000 SF 300 Jubilee Drive, Peabody 35,000 SF
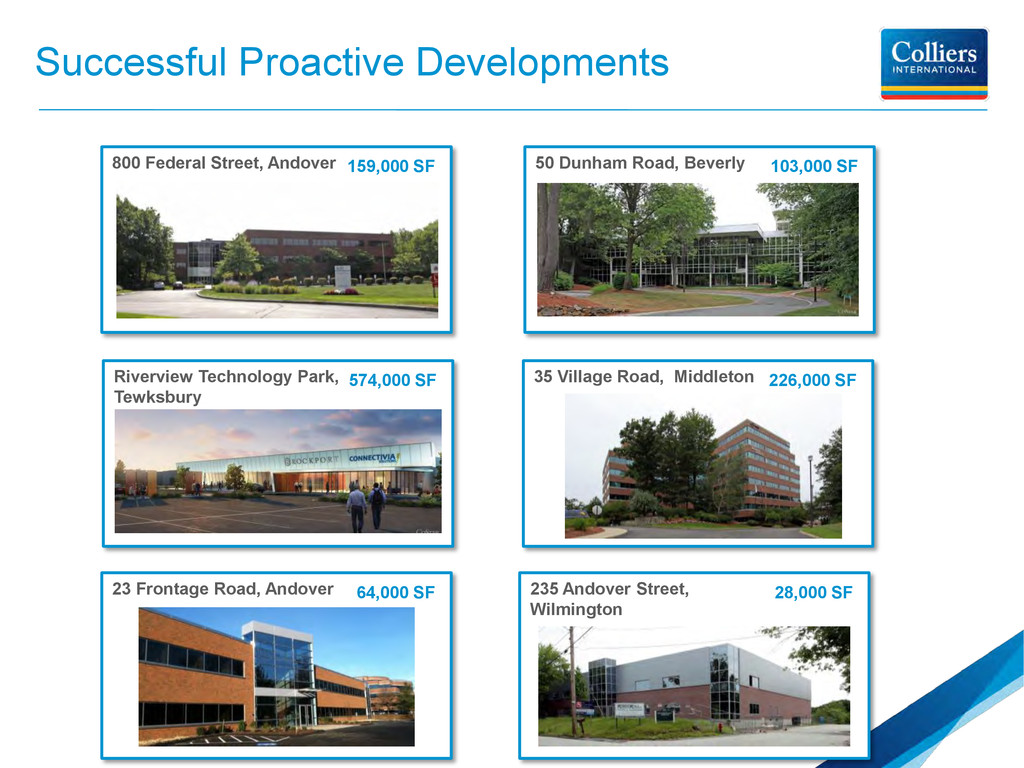
Dunham Road, Beverly 103,000 SF Riverview Technology Park, Tewksbury 574,000 SF 35 Village Road, Middleton 226,000 SF 235 Andover Street, Wilmington 28,000 SF 23 Frontage Road, Andover 64,000 SF
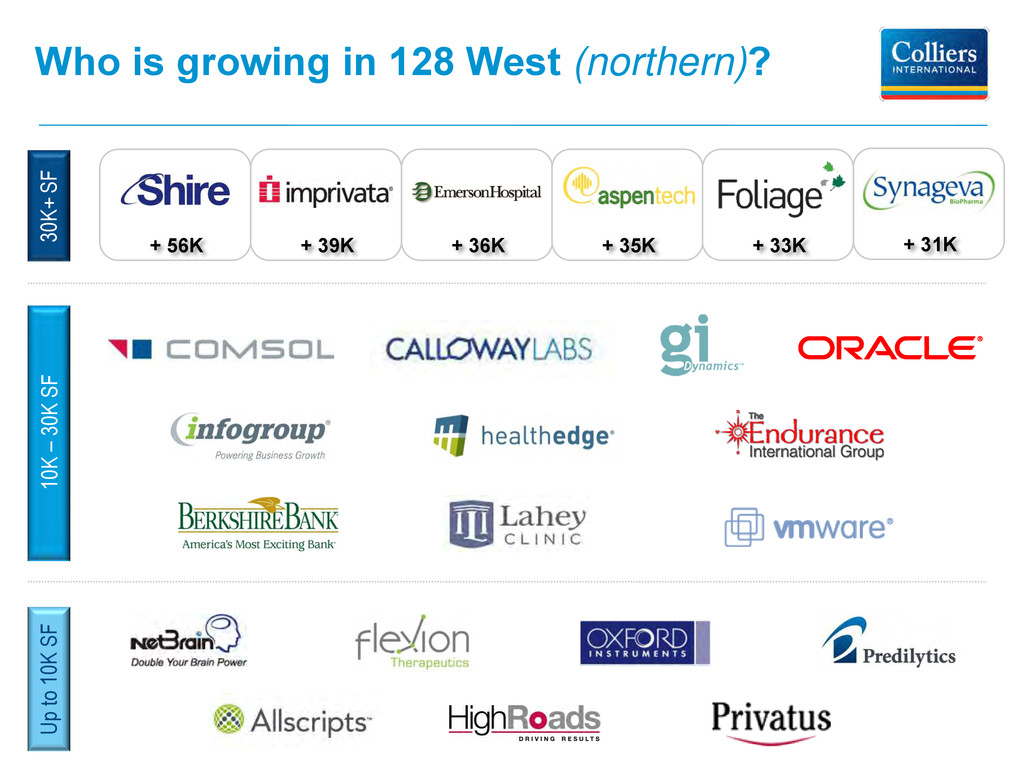
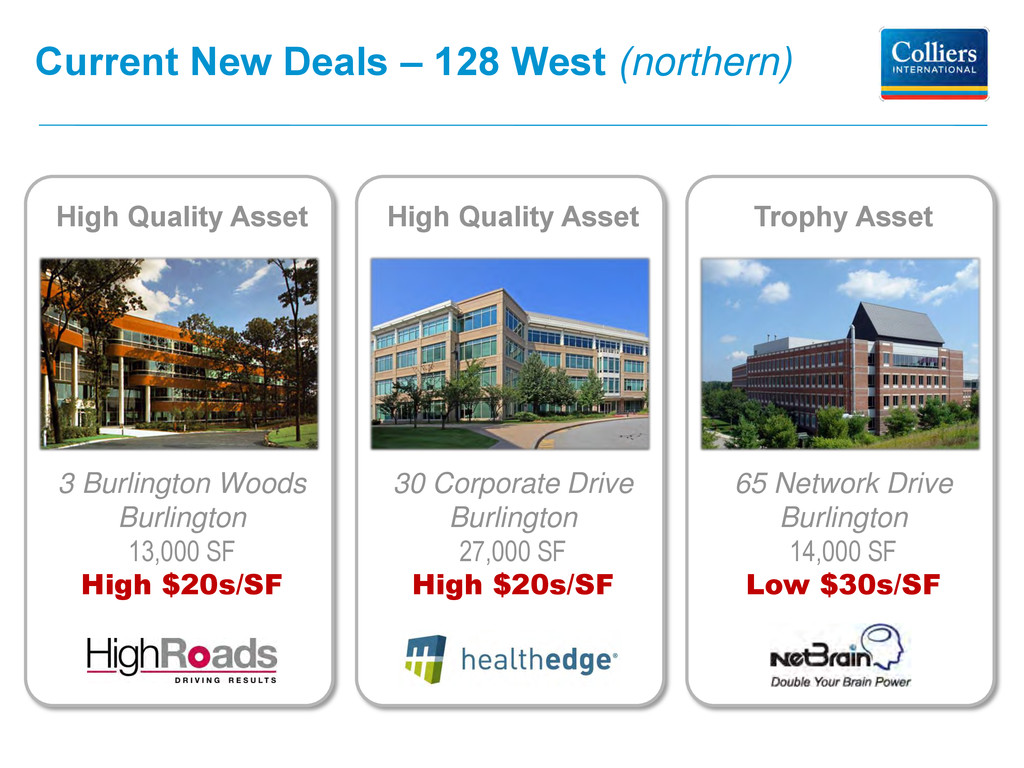
30 Corporate Drive Burlington 27,000 SF High $20s/SF High Quality Asset 3 Burlington Woods Burlington 13,000 SF High $20s/SF High Quality Asset Current New Deals – 128 West (northern)
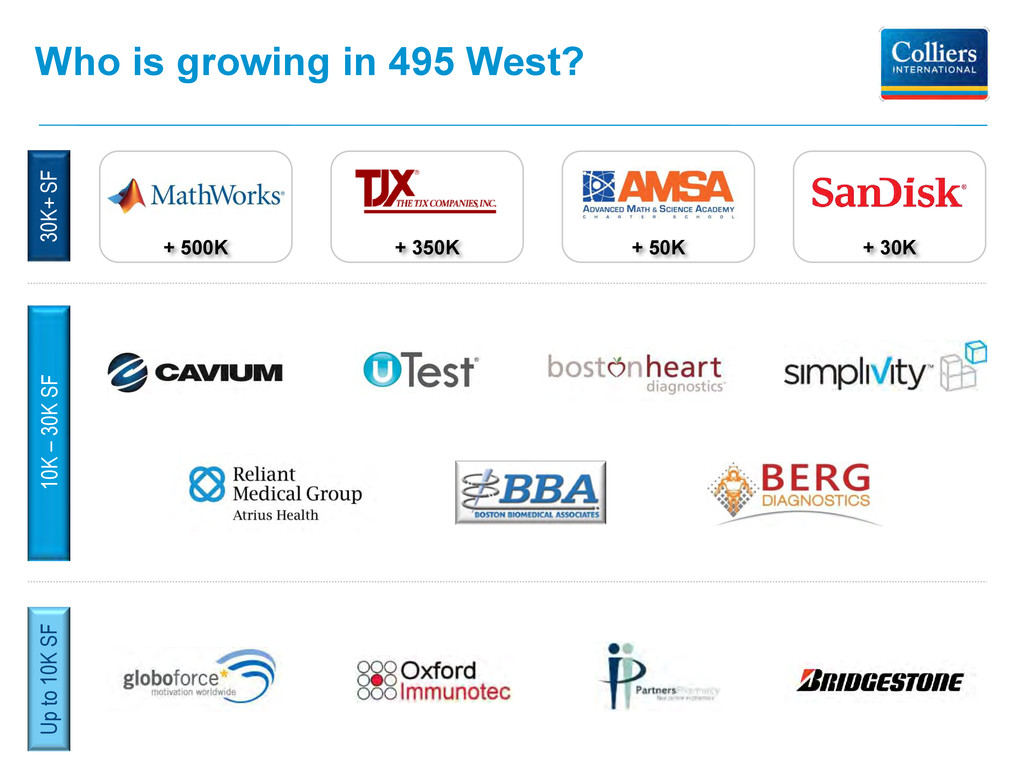
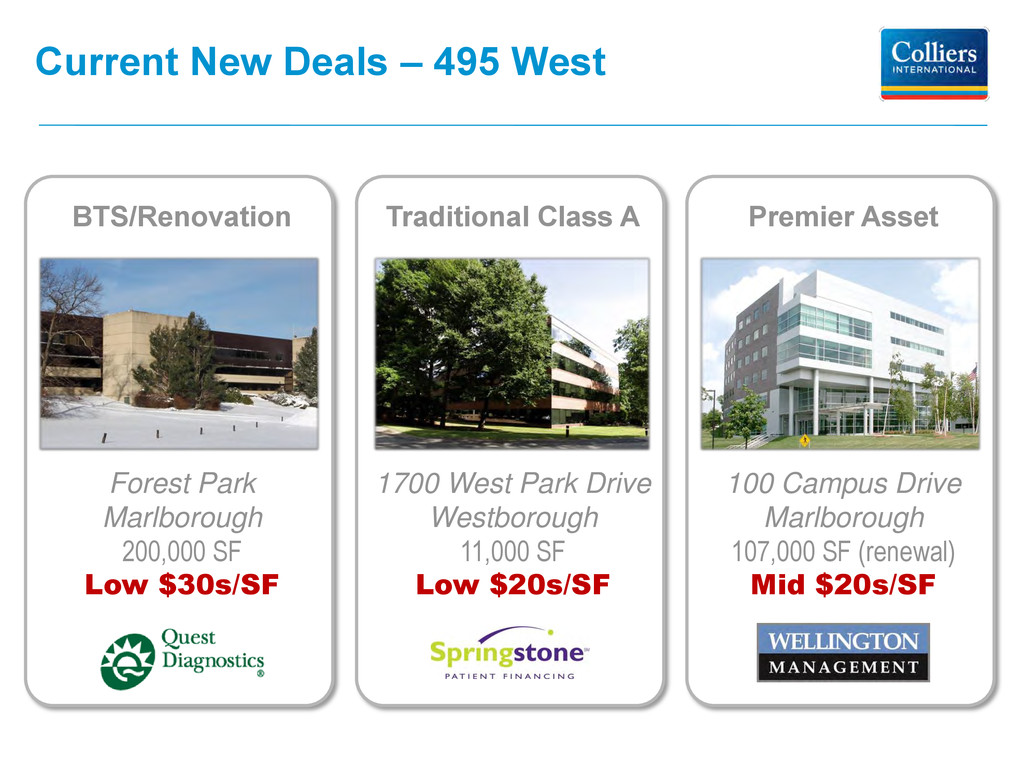
Asset 1700 West Park Drive Westborough 11,000 SF Low $20s/SF Traditional Class A Forest Park Marlborough 200,000 SF Low $30s/SF BTS/Renovation Current New Deals – 495 West
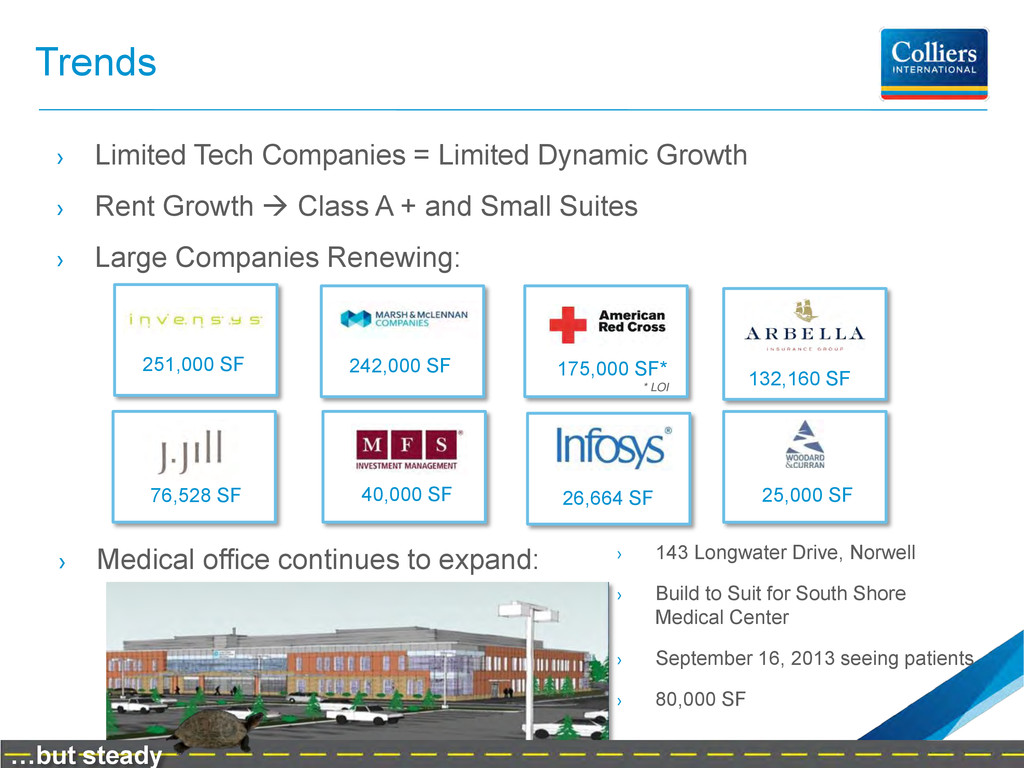
Rent Growth Class A + and Small Suites › Large Companies Renewing: 76,528 SF 26,664 SF 132,160 SF 40,000 SF 175,000 SF* * LOI 25,000 SF 242,000 SF 251,000 SF › Medical office continues to expand: › 143 Longwater Drive, Norwell › Build to Suit for South Shore Medical Center › September 16, 2013 seeing patients › 80,000 SF …but steady
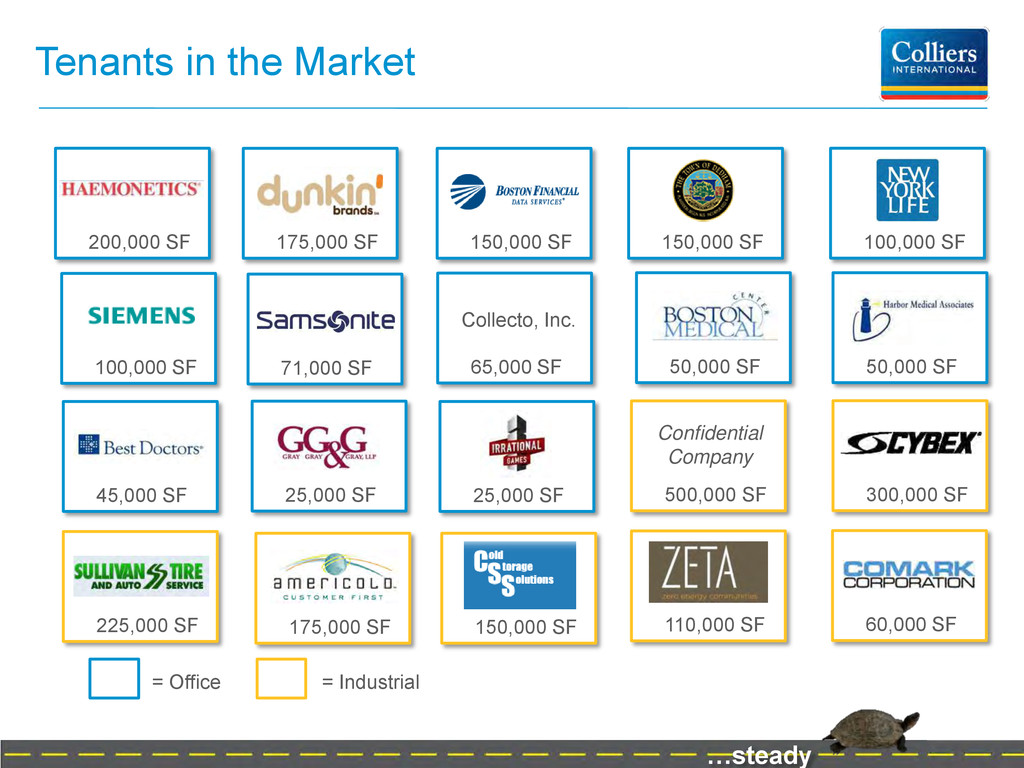
100,000 SF 100,000 SF 150,000 SF 175,000 SF 65,000 SF Collecto, Inc. 25,000 SF 25,000 SF 71,000 SF 150,000 SF 50,000 SF 45,000 SF 50,000 SF 500,000 SF Confidential Company 175,000 SF 150,000 SF 225,000 SF 110,000 SF 60,000 SF 300,000 SF …steady
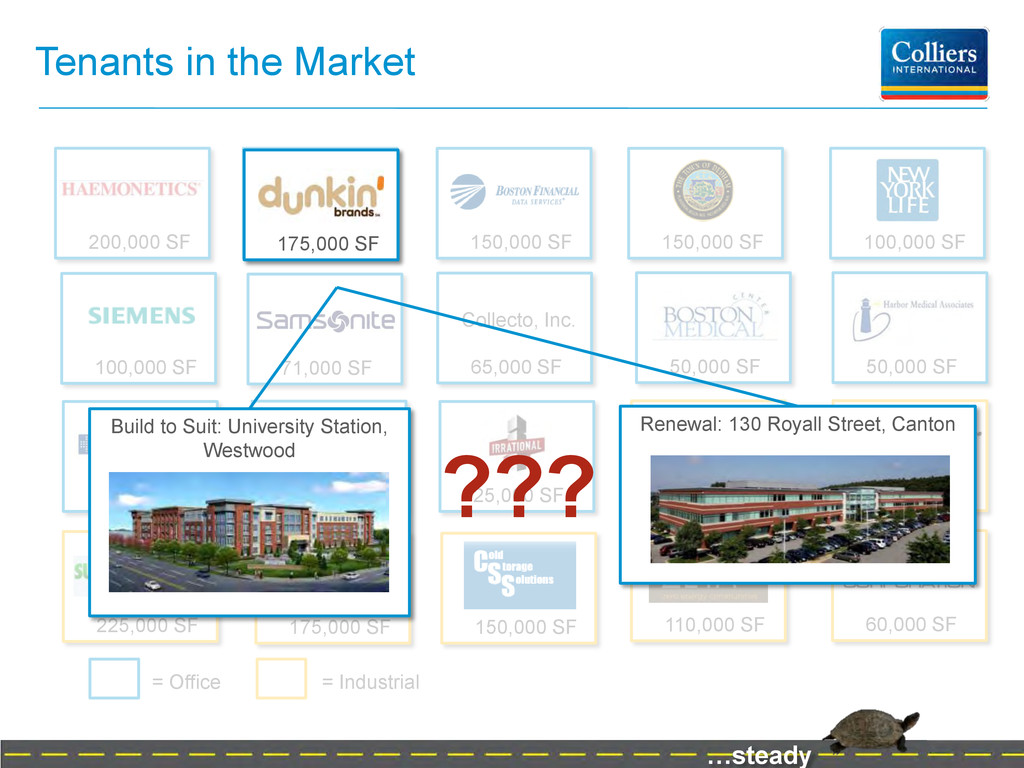
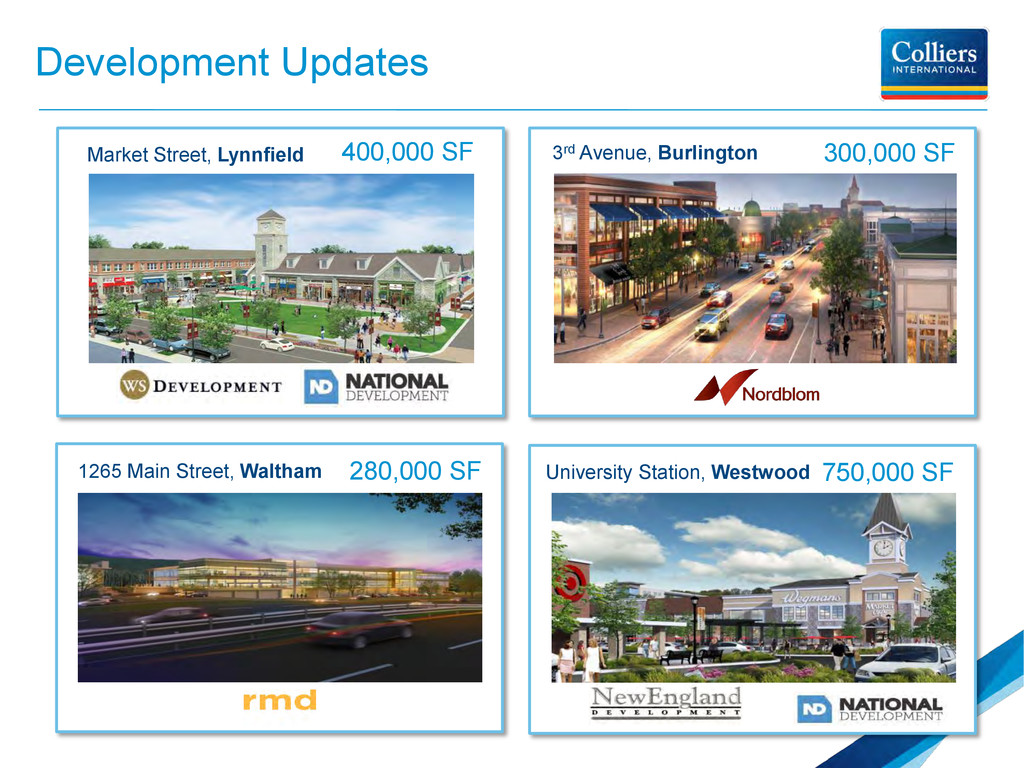
100,000 SF 100,000 SF 150,000 SF 175,000 SF 65,000 SF Collecto, Inc. 25,000 SF 25,000 SF 71,000 SF 150,000 SF 50,000 SF 45,000 SF 50,000 SF 500,000 SF Confidential Company 175,000 SF 150,000 SF 225,000 SF 110,000 SF 60,000 SF 300,000 SF ??? Build to Suit: University Station, Westwood Renewal: 130 Royall Street, Canton 175,000 SF …steady
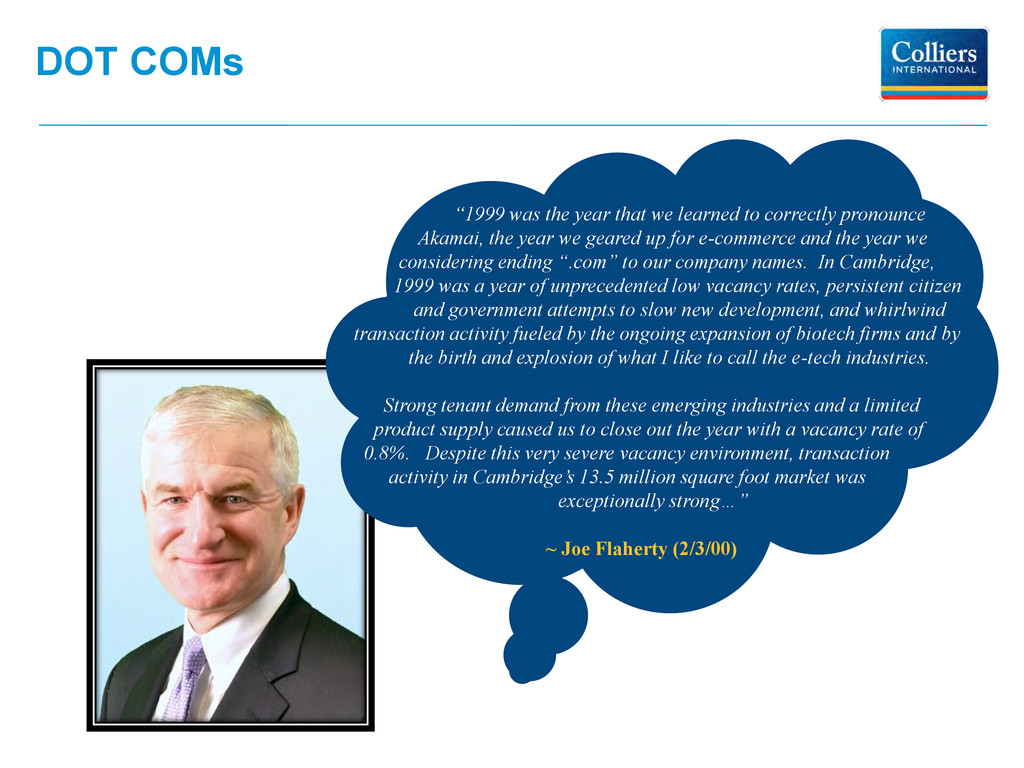
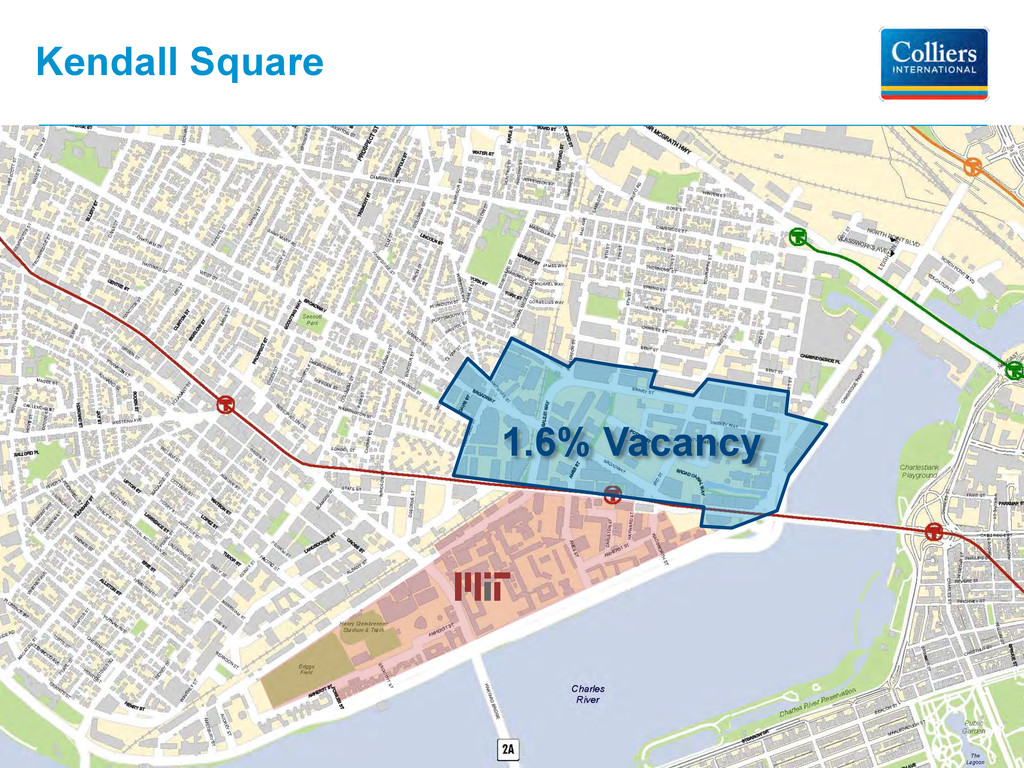
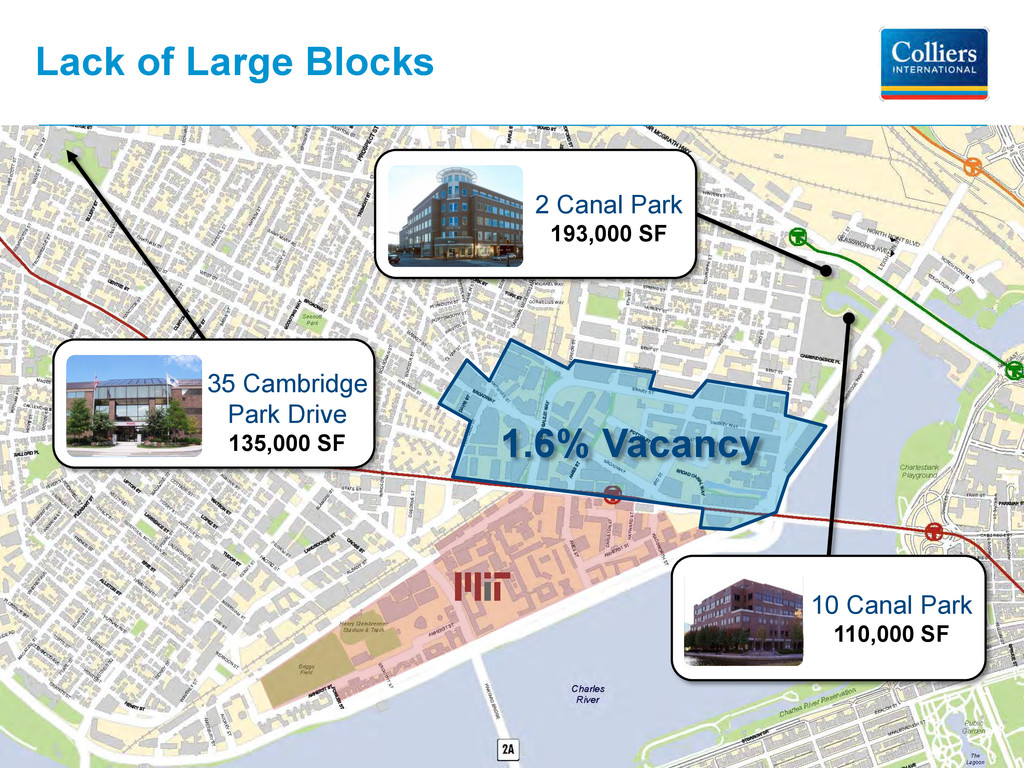
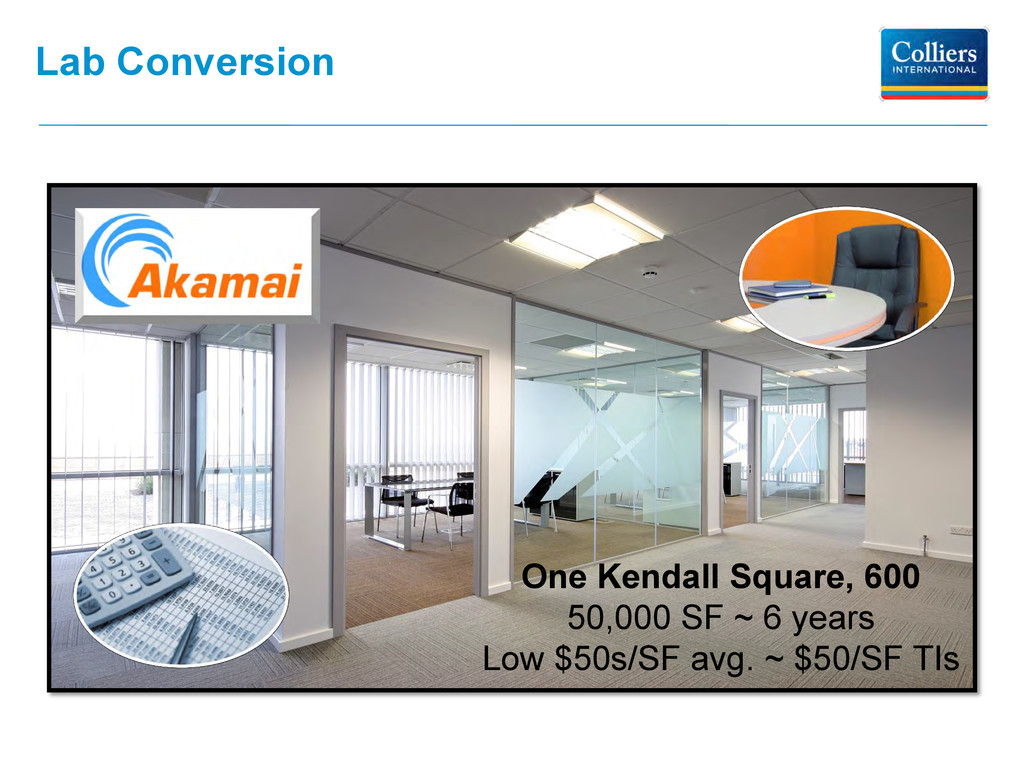
correctly pronounce Akamai, the year we geared up for e-commerce and the year we considering ending “.com” to our company names. In Cambridge, 1999 was a year of unprecedented low vacancy rates, persistent citizen and government attempts to slow new development, and whirlwind transaction activity fueled by the ongoing expansion of biotech firms and by the birth and explosion of what I like to call the e-tech industries. Strong tenant demand from these emerging industries and a limited product supply caused us to close out the year with a vacancy rate of 0.8%. Despite this very severe vacancy environment, transaction activity in Cambridge’s 13.5 million square foot market was exceptionally strong…” ~ Joe Flaherty (2/3/00)
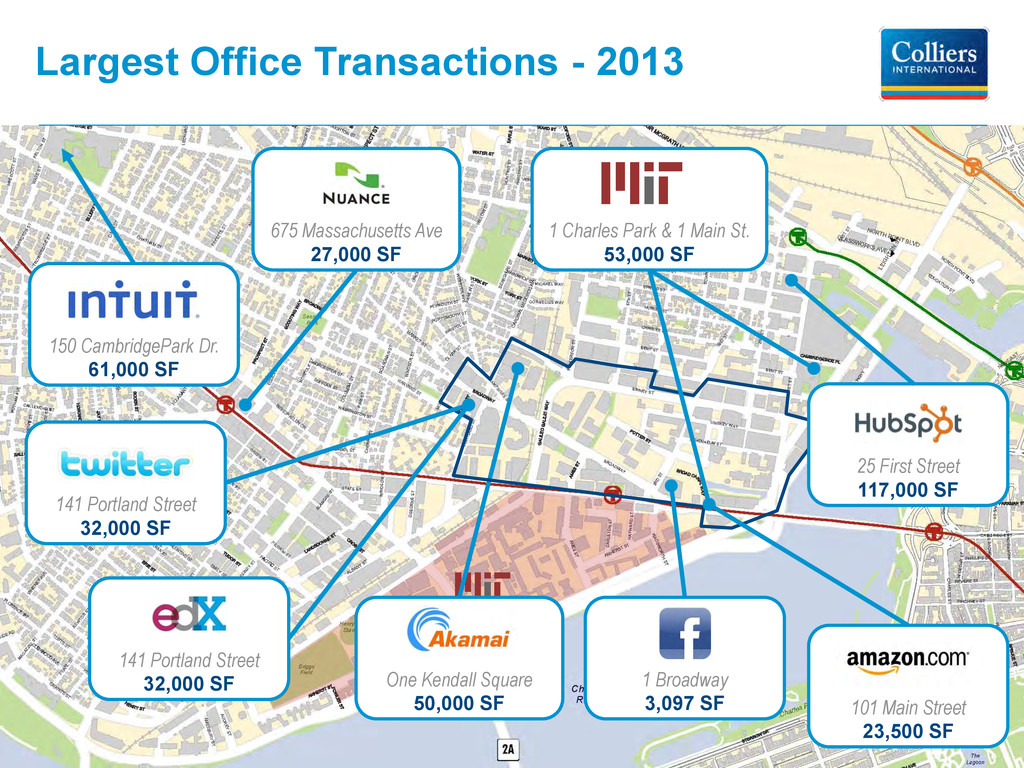
Largest Office Transactions - 2013 1 Broadway 3,097 SF 101 Main Street 23,500 SF 141 Portland Street 32,000 SF 25 First Street 117,000 SF 150 CambridgePark Dr. 61,000 SF 1 Charles Park & 1 Main St. 53,000 SF 141 Portland Street 32,000 SF
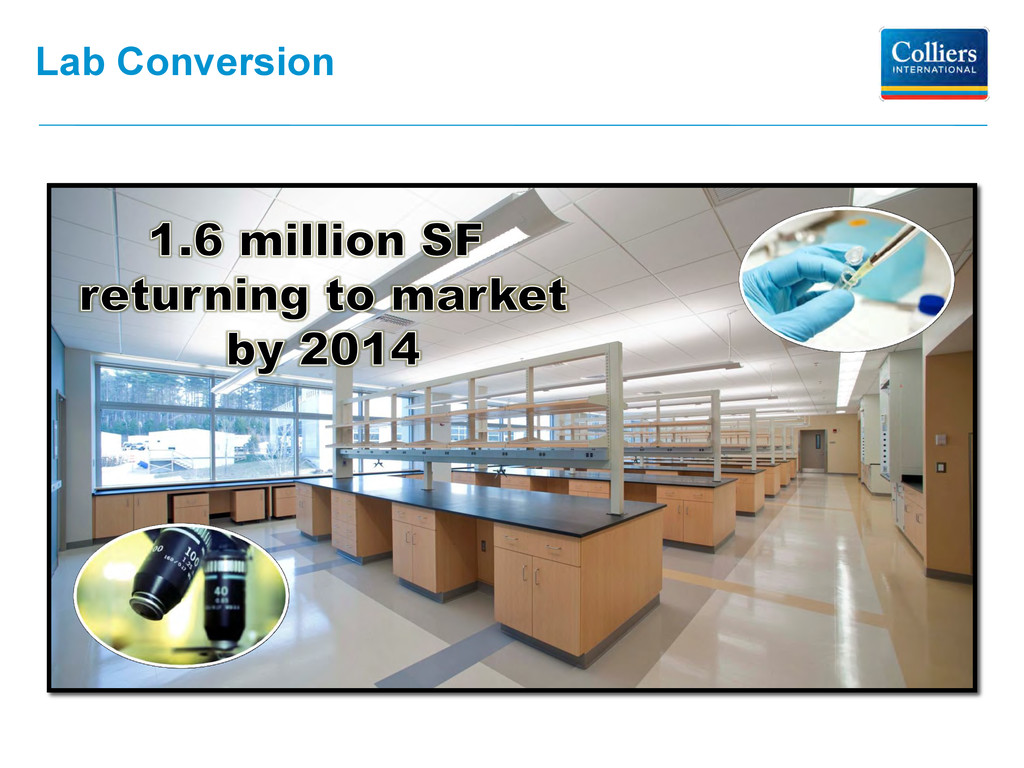
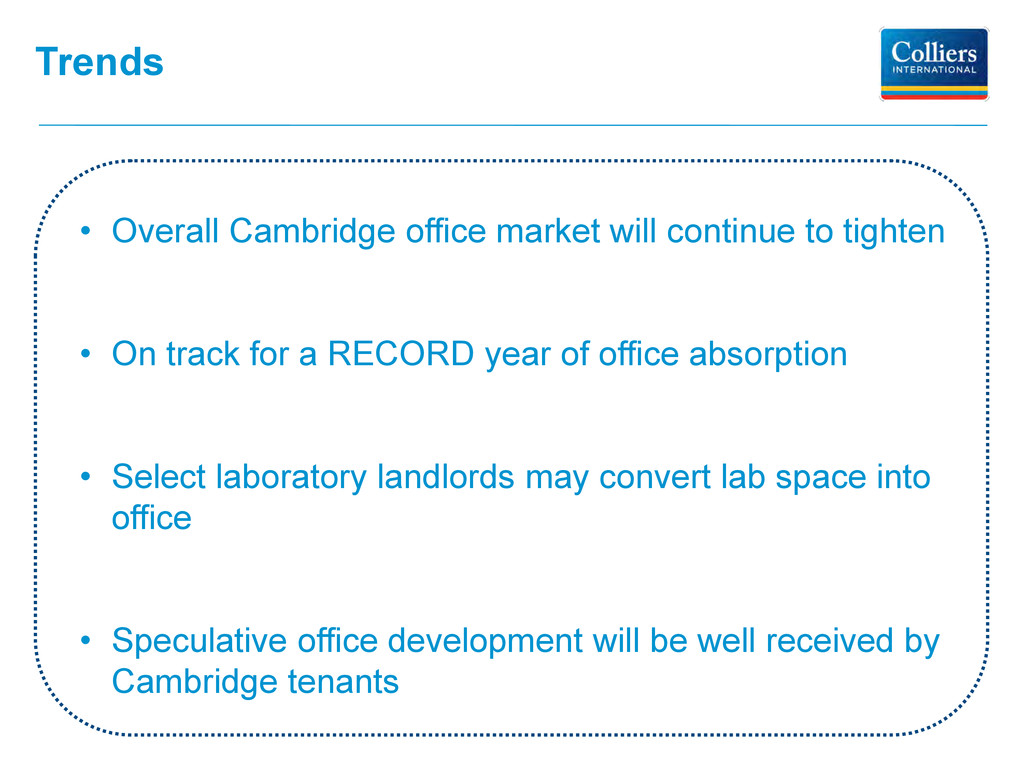
• On track for a RECORD year of office absorption • Select laboratory landlords may convert lab space into office • Speculative office development will be well received by Cambridge tenants
TA Realty 25 Mall Road 25 Burlington Mall Road, Burlington 285,000 SF Seller: Behringer Harvard $69,600,000 ($256/SF) 6.0% Cap Buyer: Piedmont REIT Nokia Headquarters 5 Wayside Drive, Burlington 271,500 SF Seller: Bentall Kennedy/MEPT $110,000,000 ($226/SF) Buyer: Davis/Principal Burlington Centre Corporate Drive, Burlington 487,000 SF Seller: Blackstone/EOP $216,000,000 ($209/SF) 6.3% Cap Buyer: Charles River/ National Development New England Executive Park Executive Park Drive, Burlington 1,032,000 SF
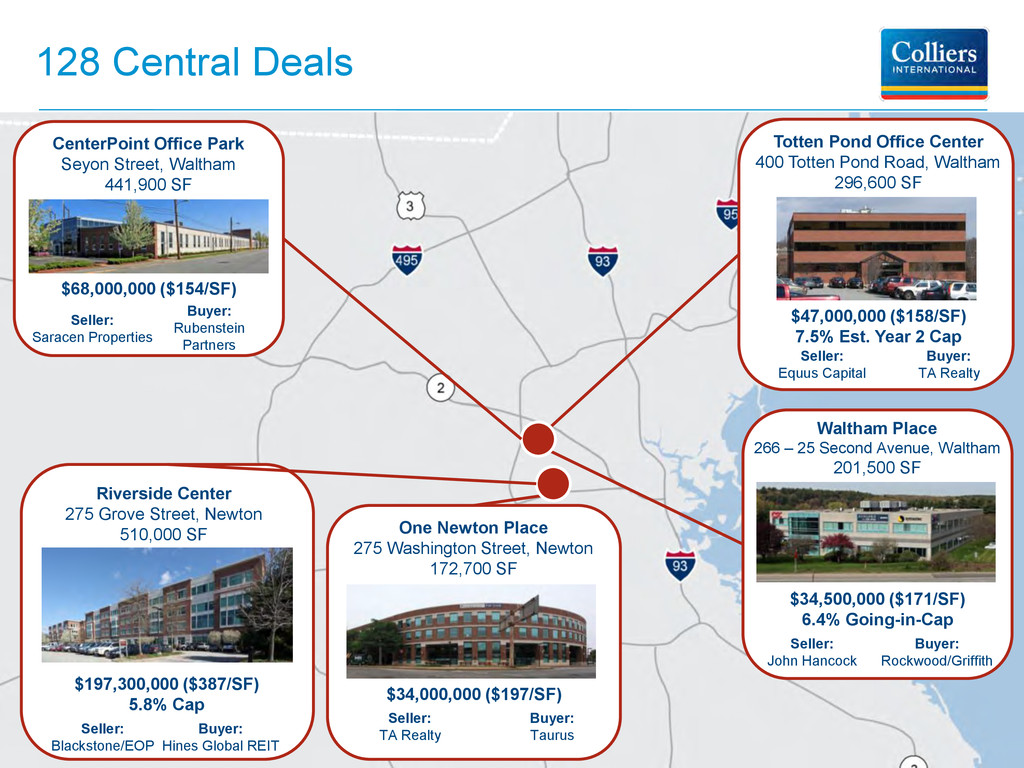
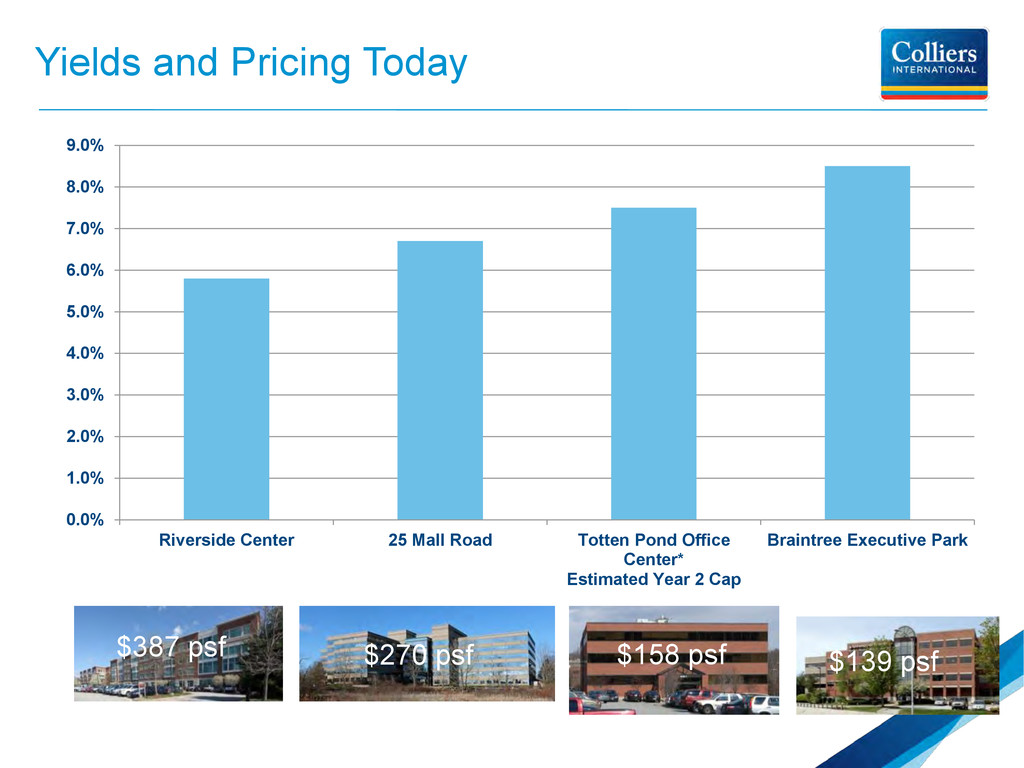
Year 2 Cap Buyer: TA Realty Totten Pond Office Center 400 Totten Pond Road, Waltham 296,600 SF Seller: TA Realty $34,000,000 ($197/SF) Buyer: Taurus One Newton Place 275 Washington Street, Newton 172,700 SF Seller: John Hancock $34,500,000 ($171/SF) 6.4% Going-in-Cap Buyer: Rockwood/Griffith Waltham Place 266 – 25 Second Avenue, Waltham 201,500 SF Seller: Saracen Properties $68,000,000 ($154/SF) Buyer: Rubenstein Partners CenterPoint Office Park Seyon Street, Waltham 441,900 SF Seller: Blackstone/EOP $197,300,000 ($387/SF) 5.8% Cap Buyer: Hines Global REIT Riverside Center 275 Grove Street, Newton 510,000 SF
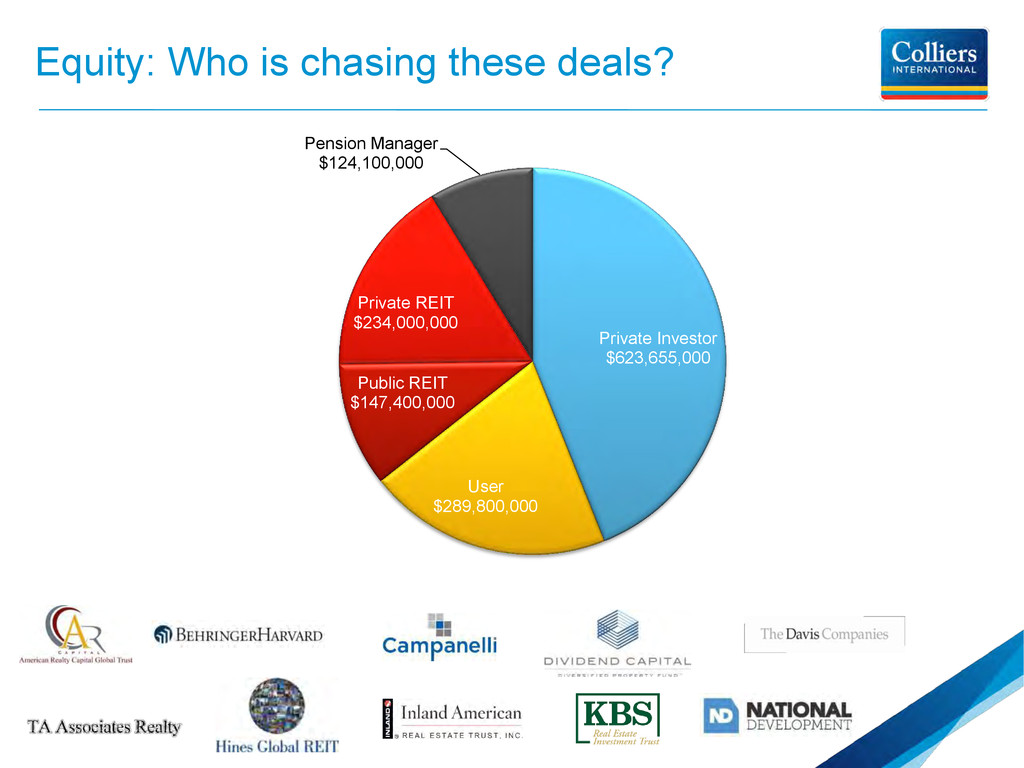
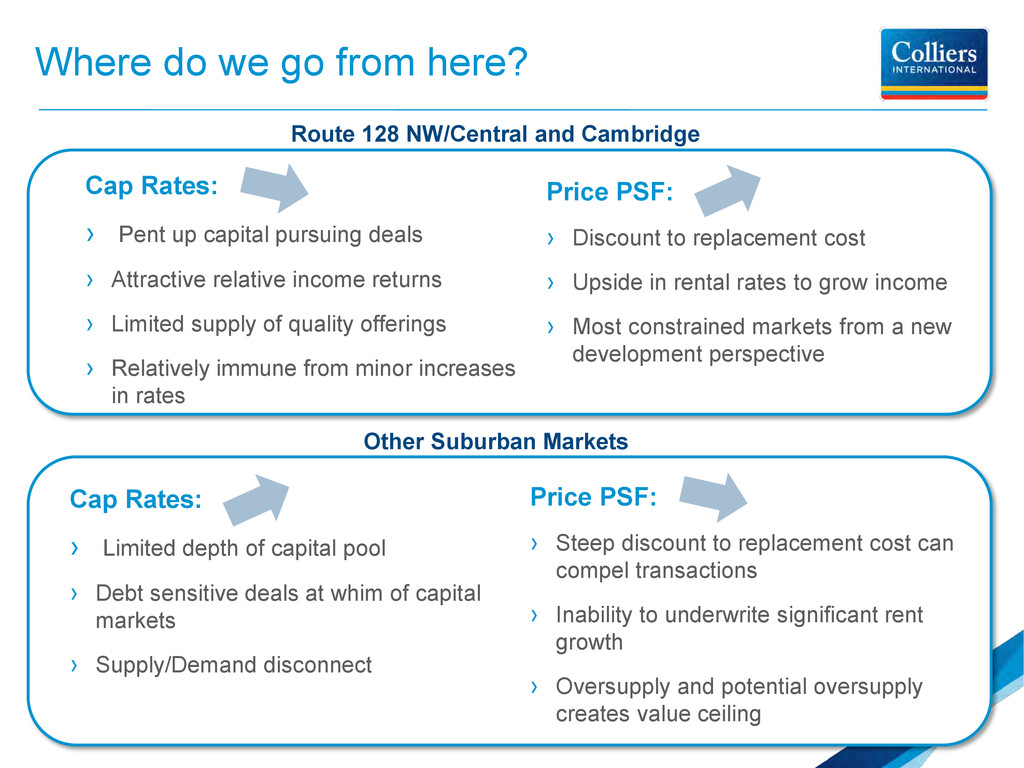
up capital pursuing deals › Attractive relative income returns › Limited supply of quality offerings › Relatively immune from minor increases in rates Price PSF: › Discount to replacement cost › Upside in rental rates to grow income › Most constrained markets from a new development perspective Route 128 NW/Central and Cambridge 1,201,308,578 Cap Rates: › Limited depth of capital pool › Debt sensitive deals at whim of capital markets › Supply/Demand disconnect Price PSF: › Steep discount to replacement cost can compel transactions › Inability to underwrite significant rent growth › Oversupply and potential oversupply creates value ceiling Other Suburban Markets
› Rising Tide hasn’t lifted all boats › Close-in suburbs lead way in transaction and sales volumes › Ample, diverse capital base continues to pursue suburban will continue to pursue deals in the market › Diverse market with full range of deal types from A+ core, to opportunistic redevelopment