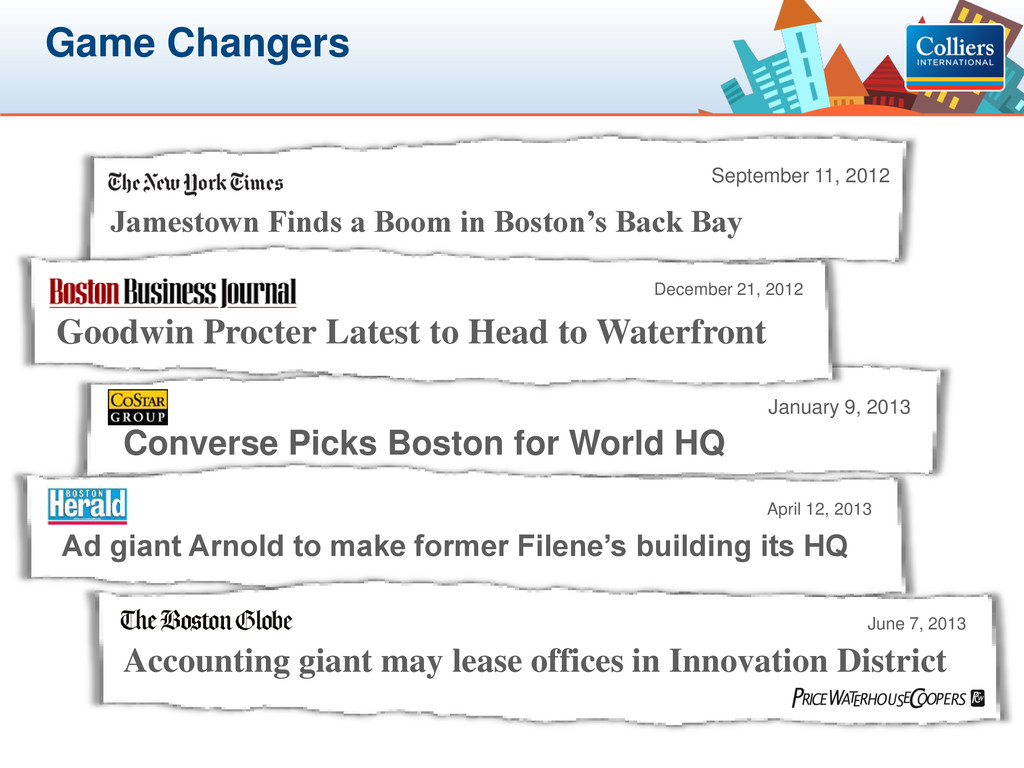
Finds a Boom in Boston’s Back Bay Game Changers Converse Picks Boston for World HQ January 9, 2013 December 21, 2012 Goodwin Procter Latest to Head to Waterfront April 12, 2013 Ad giant Arnold to make former Filene’s building its HQ June 7, 2013 Accounting giant may lease offices in Innovation District
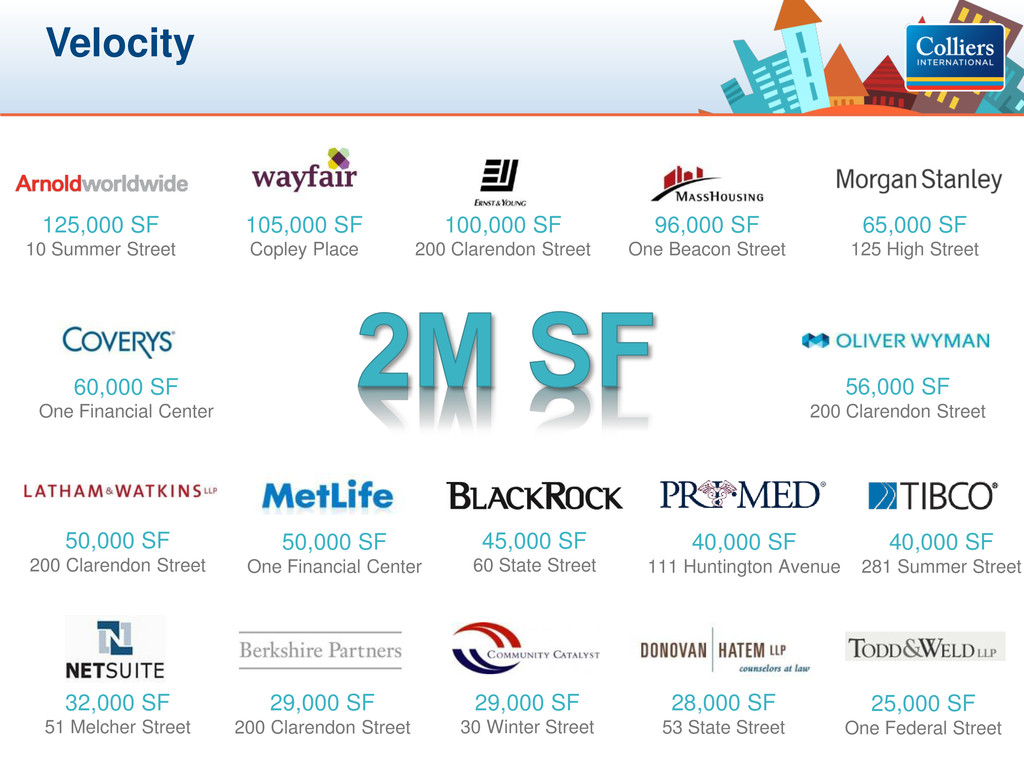
Velocity 96,000 SF One Beacon Street 100,000 SF 200 Clarendon Street 50,000 SF One Financial Center 56,000 SF 200 Clarendon Street 29,000 SF 30 Winter Street 25,000 SF One Federal Street 60,000 SF One Financial Center 50,000 SF 200 Clarendon Street 65,000 SF 125 High Street 29,000 SF 200 Clarendon Street 40,000 SF 111 Huntington Avenue 28,000 SF 53 State Street 40,000 SF 281 Summer Street 45,000 SF 60 State Street 125,000 SF 10 Summer Street 32,000 SF 51 Melcher Street
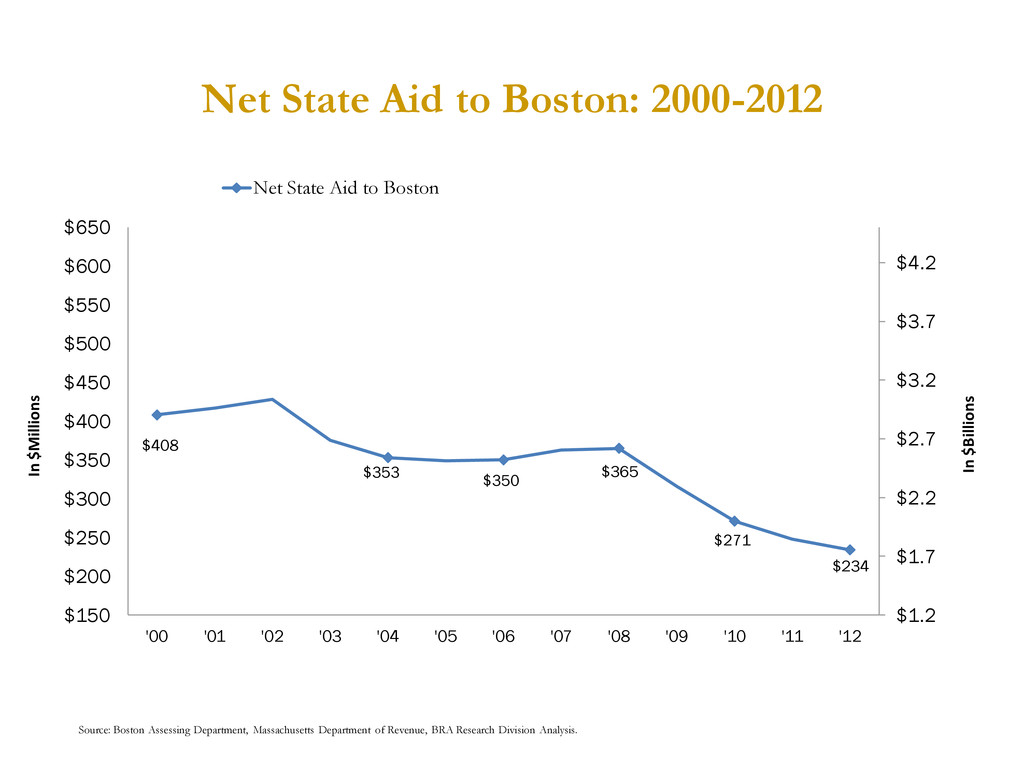
$3.2 $3.7 $4.2 $150 $200 $250 $300 $350 $400 $450 $500 $550 $600 $650 '00 '01 '02 '03 '04 '05 '06 '07 '08 '09 '10 '11 '12 In $Millions Net State Aid to Boston Net State Aid to Boston: 2000-2012 Source: Boston Assessing Department, Massachusetts Department of Revenue, BRA Research Division Analysis. In $Billions
$271 $234 $1.2 $1.7 $2.2 $2.7 $3.2 $3.7 $4.2 $150 $200 $250 $300 $350 $400 $450 $500 $550 $600 $650 '00 '01 '02 '03 '04 '05 '06 '07 '08 '09 '10 '11 '12 In $Millions Net State Aid to Boston Taxes Derived from Boston Net State Aid to Boston: 2000-2012 Taxes Derived from Boston: 2000-2012 Source: Boston Assessing Department, Massachusetts Department of Revenue, BRA Research Division Analysis. In $Billions
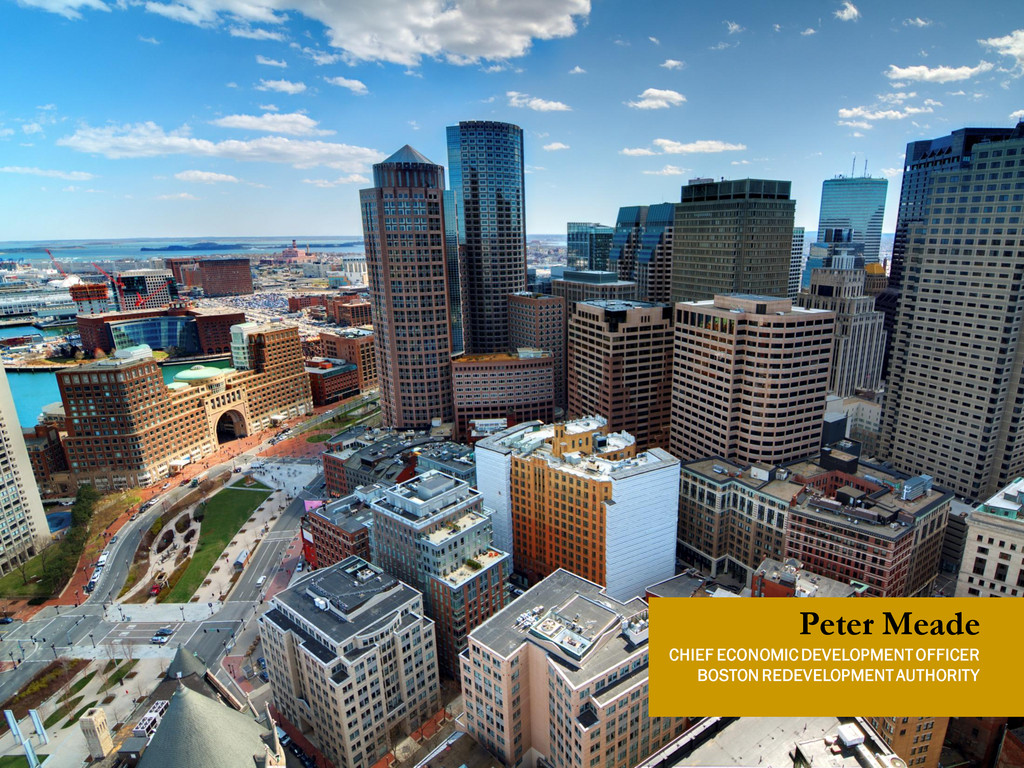
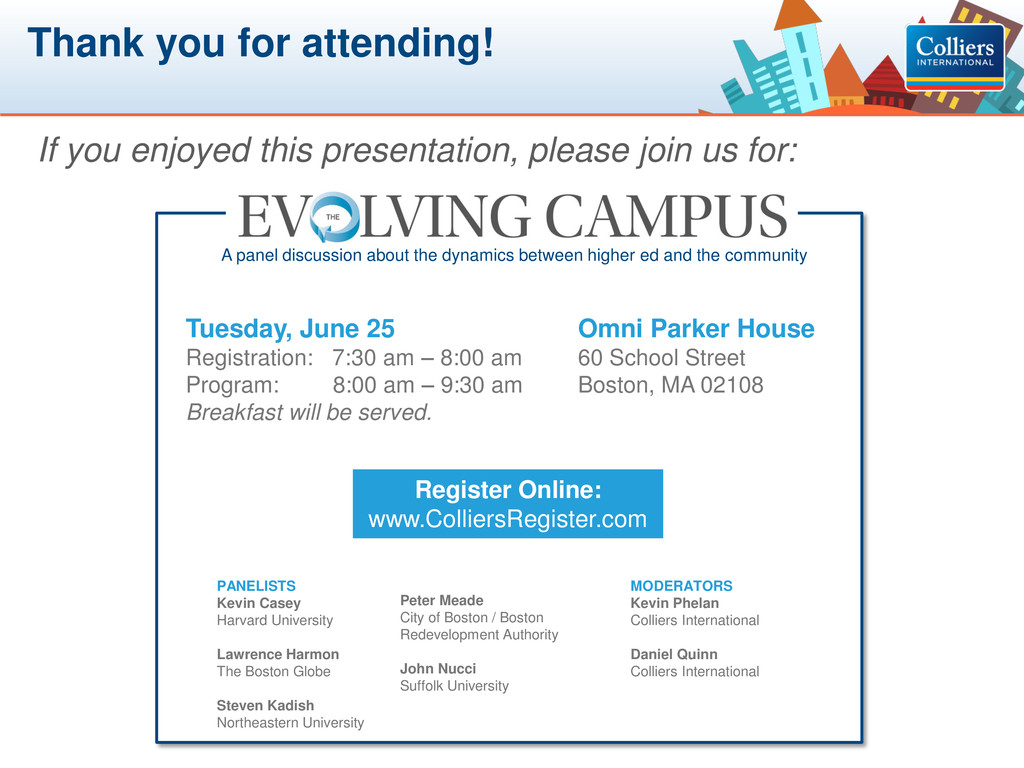
If you enjoyed this presentation, please join us for: Tuesday, June 25 Registration: 7:30 am – 8:00 am Program: 8:00 am – 9:30 am Breakfast will be served. Omni Parker House 60 School Street Boston, MA 02108 Register Online: www.ColliersRegister.com A panel discussion about the dynamics between higher ed and the community MODERATORS Kevin Phelan Colliers International Daniel Quinn Colliers International PANELISTS Kevin Casey Harvard University Lawrence Harmon The Boston Globe Steven Kadish Northeastern University Peter Meade City of Boston / Boston Redevelopment Authority John Nucci Suffolk University