Electric to select Boston as new global headquarters”. “Boston’s biggest office sale this year just closed – for $1.3 billion [500 Boylston & 222 Berkeley Street]”. “It’s official: Putnam Investments making big move to 100 Federal St. ” “Boston Globe will move HQ to downtown office [53 State Street]”. “As Pier 4 develops, Tishman Speyer makes another South Boston play [One Channel Center - $316.5M]”.
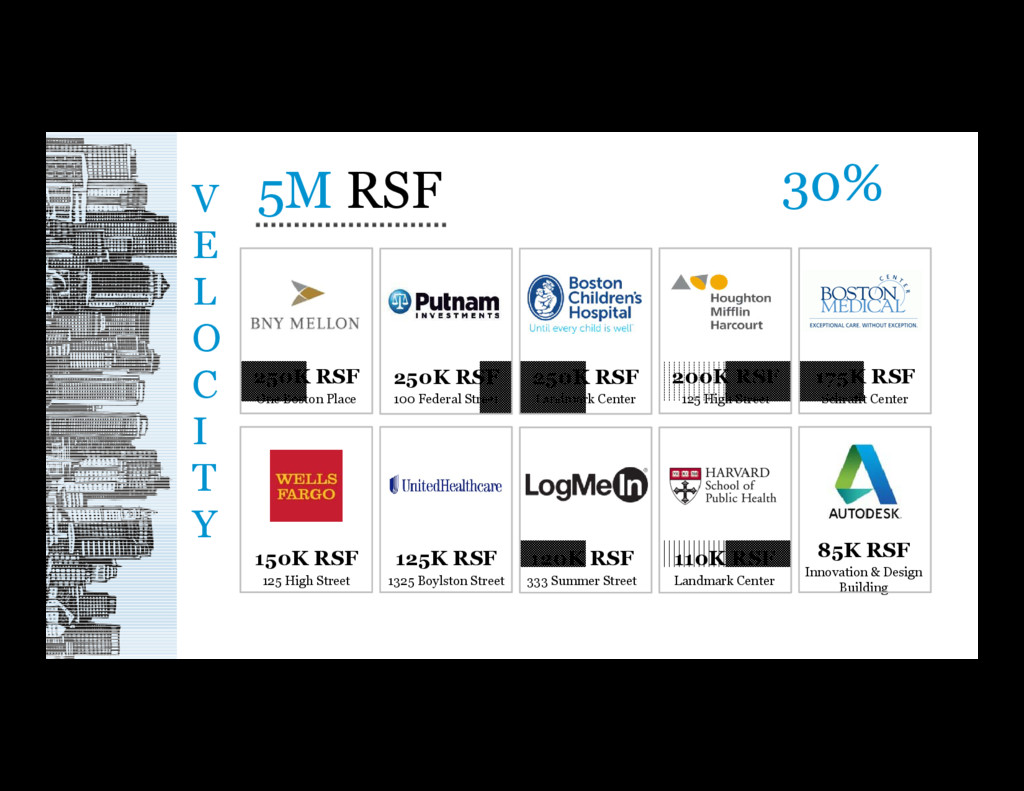
30% 125K RSF 1325 Boylston Street 120K RSF 333 Summer Street 110K RSF Landmark Center 85K RSF Innovation & Design Building 150K RSF 125 High Street 250K RSF One Boston Place 250K RSF 100 Federal Street 250K RSF Landmark Center 200K RSF 125 High Street 175K RSF Schrafft Center
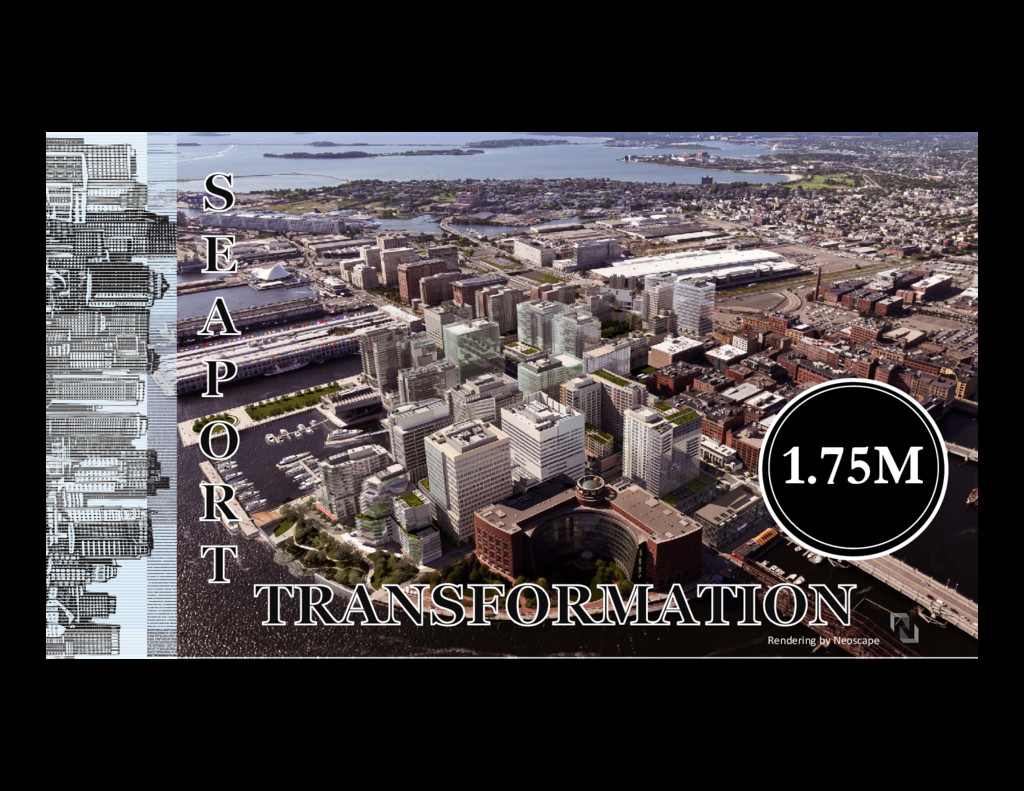
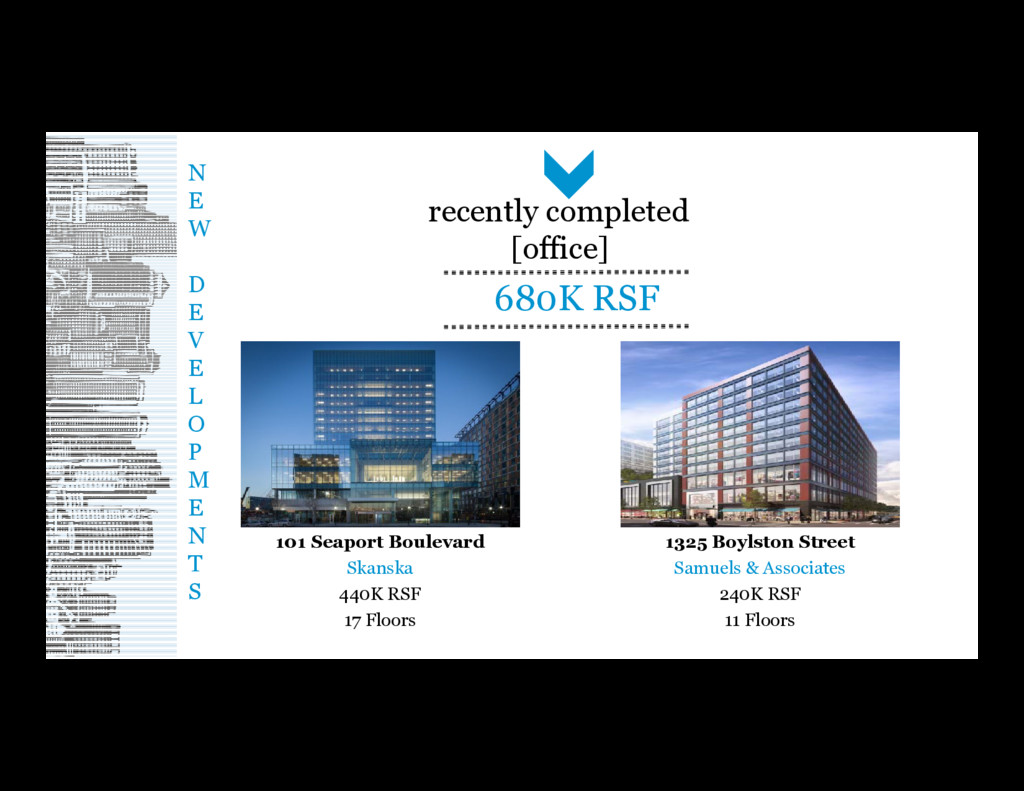
M E N T S 101 Seaport Boulevard Skanska 440K RSF 17 Floors 1325 Boylston Street Samuels & Associates 240K RSF 11 Floors 680K RSF recently completed [office]
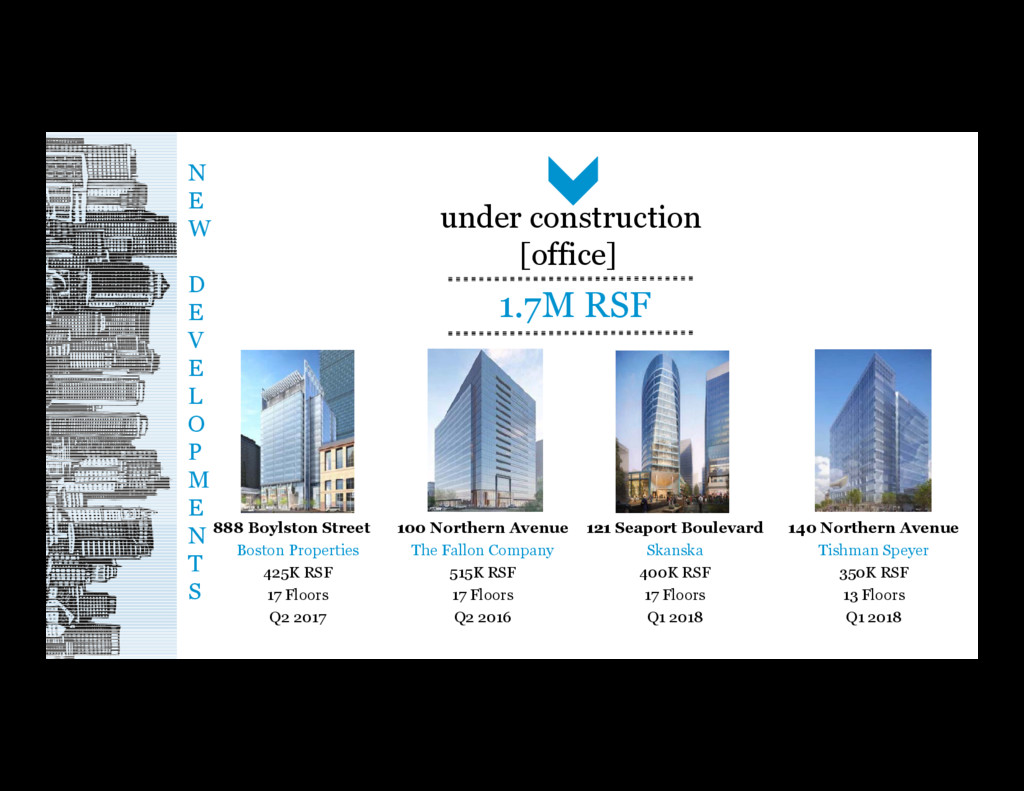
M E N T S 1.7M RSF under construction [office] 100 Northern Avenue The Fallon Company 515K RSF 17 Floors Q2 2016 888 Boylston Street Boston Properties 425K RSF 17 Floors Q2 2017 140 Northern Avenue Tishman Speyer 350K RSF 13 Floors Q1 2018 121 Seaport Boulevard Skanska 400K RSF 17 Floors Q1 2018
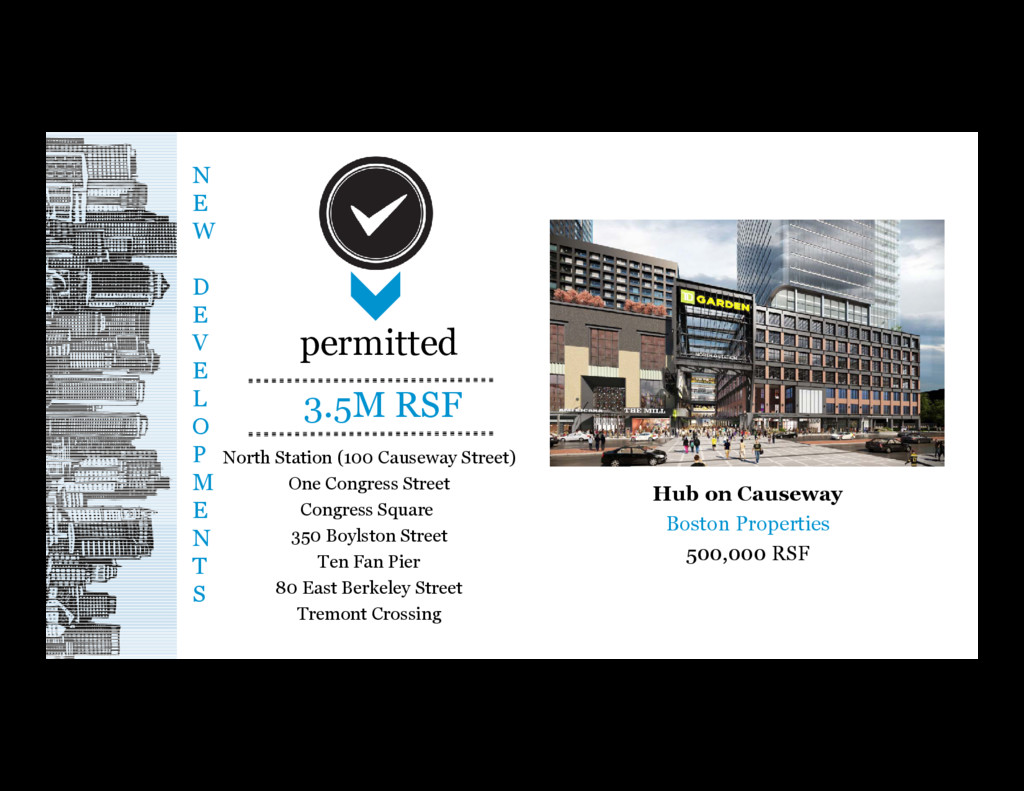
M E N T S 3.5M RSF permitted North Station (100 Causeway Street) One Congress Street Congress Square 350 Boylston Street Ten Fan Pier 80 East Berkeley Street Tremont Crossing Hub on Causeway Boston Properties 500,000 RSF
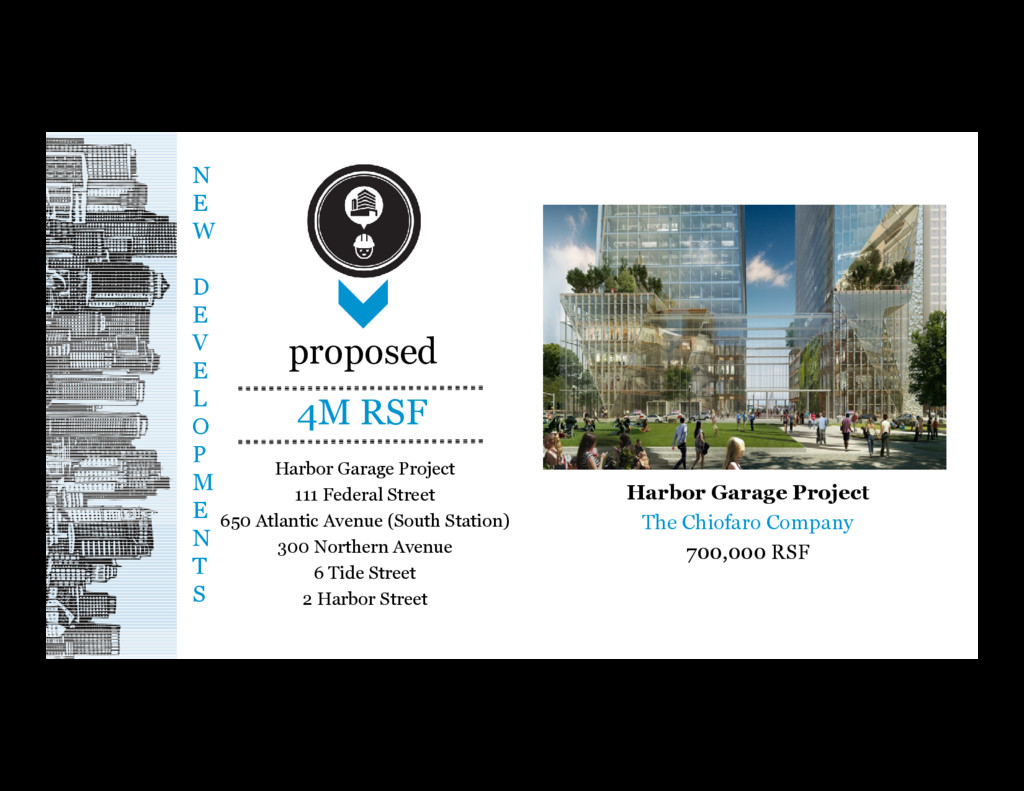
M E N T S 4M RSF proposed Harbor Garage Project 111 Federal Street 650 Atlantic Avenue (South Station) 300 Northern Avenue 6 Tide Street 2 Harbor Street Harbor Garage Project The Chiofaro Company 700,000 RSF
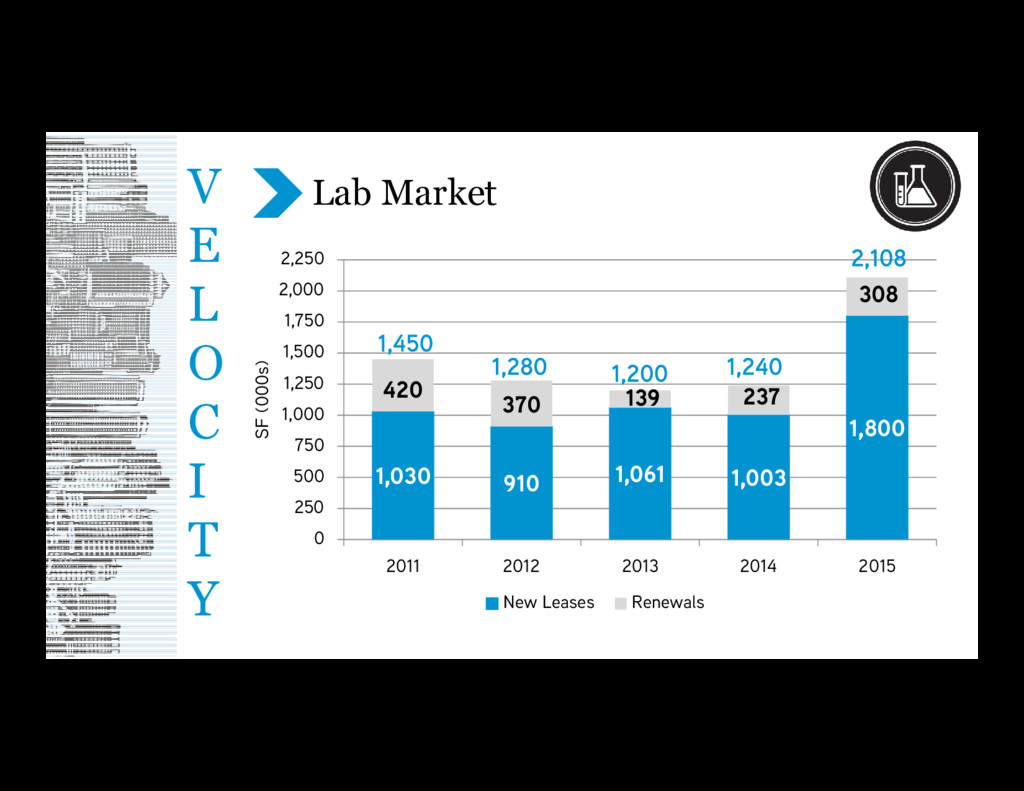
0 250 500 750 1,000 1,250 1,500 1,750 2,000 2,250 2011 2012 2013 2014 2015 SF (000s) New Leases Renewals 1,450 1,280 1,200 1,240 2,108 Lab Market V E L O C I T Y
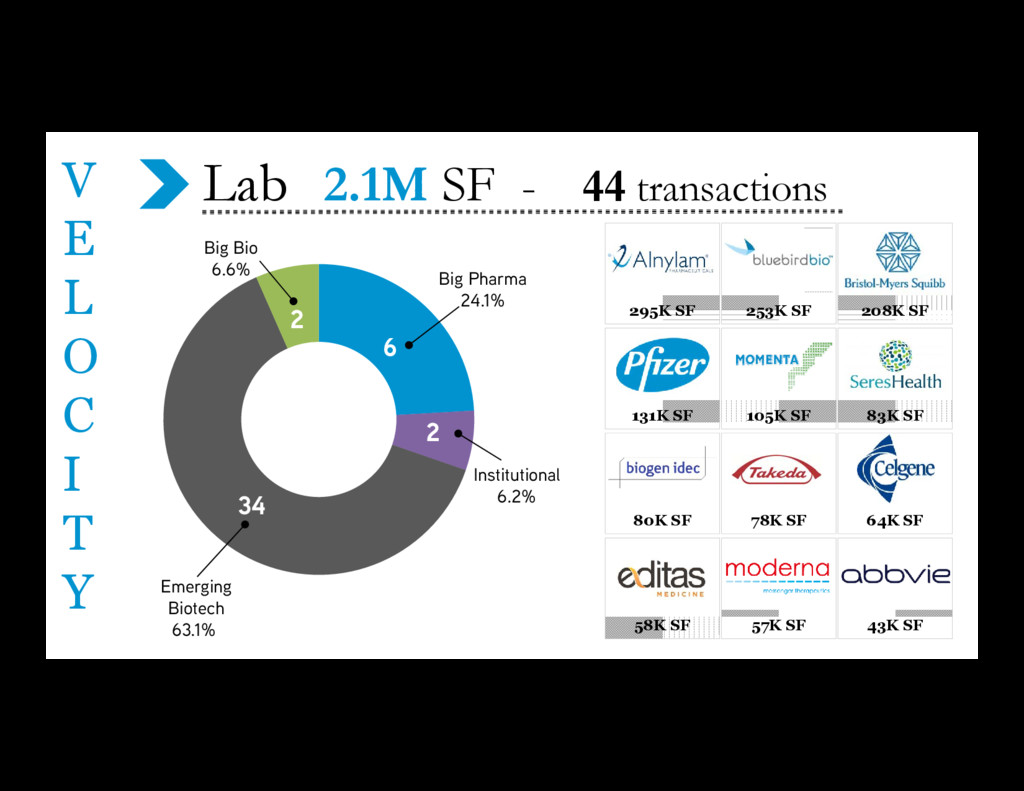
C I T Y 34 2 6 2 Emerging Biotech 63.1% Big Pharma 24.1% Institutional 6.2% Big Bio 6.6% 105K SF 78K SF 208K SF 253K SF 57K SF 64K SF 43K SF 83K SF 131K SF 80K SF 295K SF 58K SF
SF i n t h e M A R K E T 75K SF 30K SF 125K SF 126K SF 50K SF 65K SF 25K SF 40K SF 80K SF 35K SF 200K SF 60K SF Emerging Biotech 85.1% Institutional 2.9% Service Provider 12.0% Big Pharma: 0.0% Big Bio: 0.0% 16 1 1
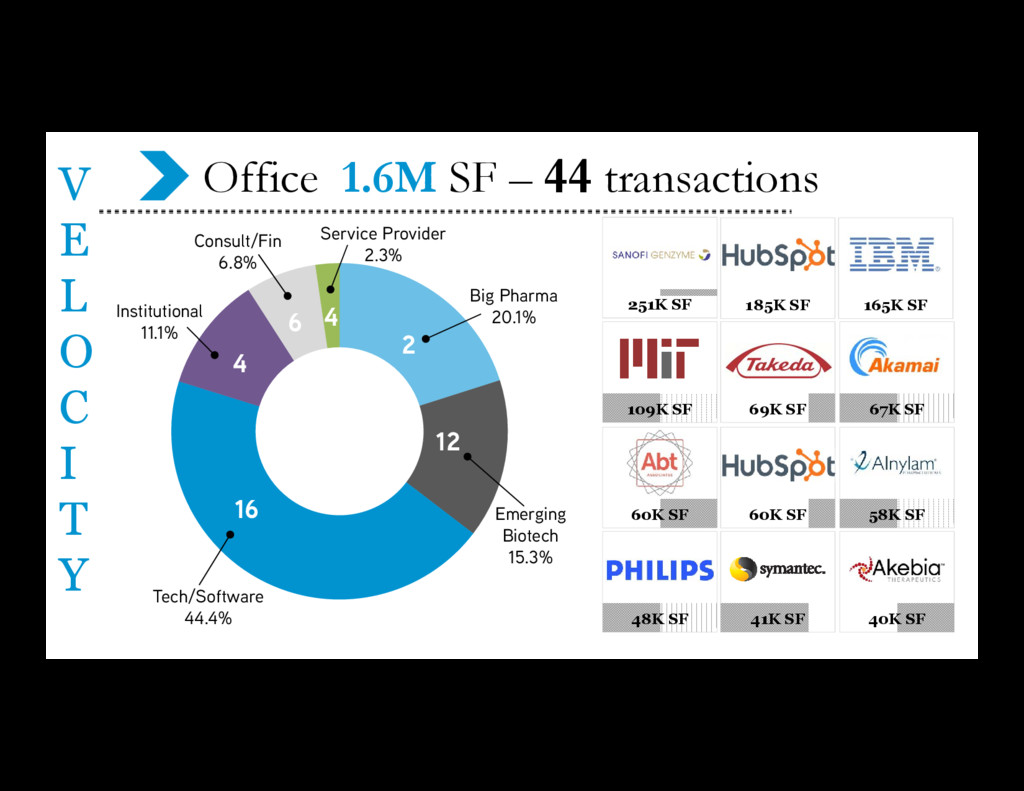
SF – 44 transactions 60K SF 41K SF 165K SF 185K SF 69K SF 67K SF 40K SF 58K SF 60K SF 48K SF 251K SF 109K SF Tech/Software 44.4% Big Pharma 20.1% Emerging Biotech 15.3% Institutional 11.1% Service Provider 2.3% Consult/Fin 6.8% 16 4 6 4 12 2
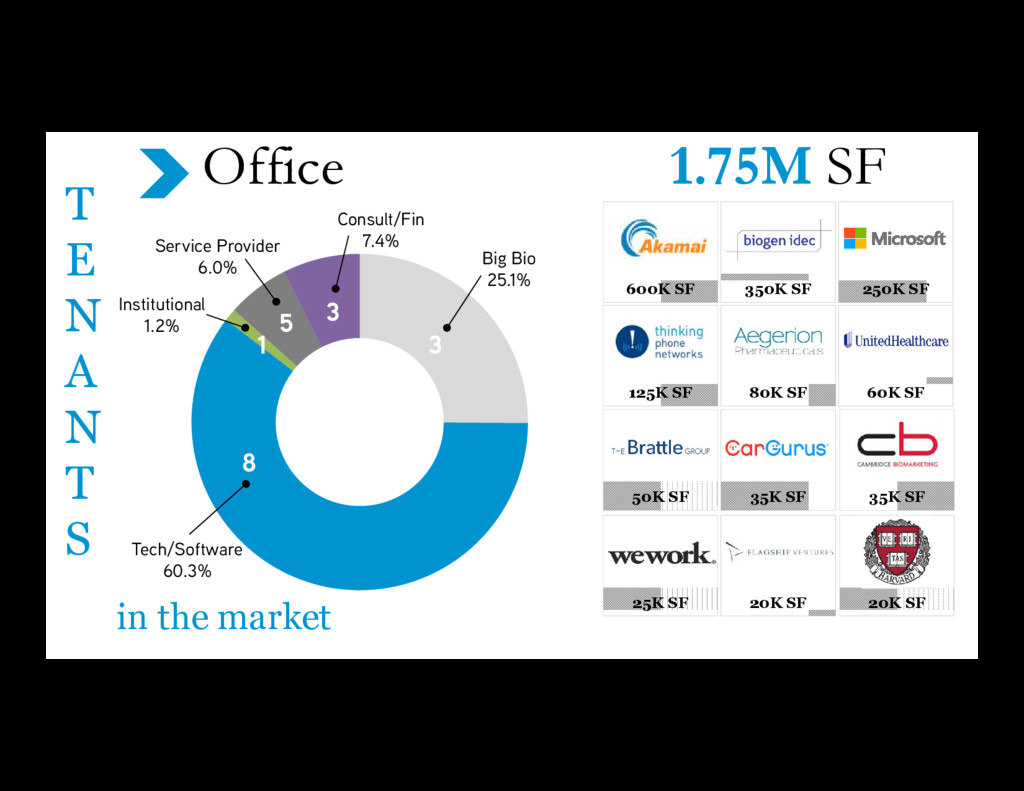
250K SF 35K SF 20K SF Tech/Software 60.3% Big Bio 25.1% Institutional 1.2% Service Provider 6.0% Consult/Fin 7.4% Office 1.75M SF 600K SF 25K SF 125K SF 50K SF 8 3 3 5 1 T E N A N A T S T E N A N T S in the market
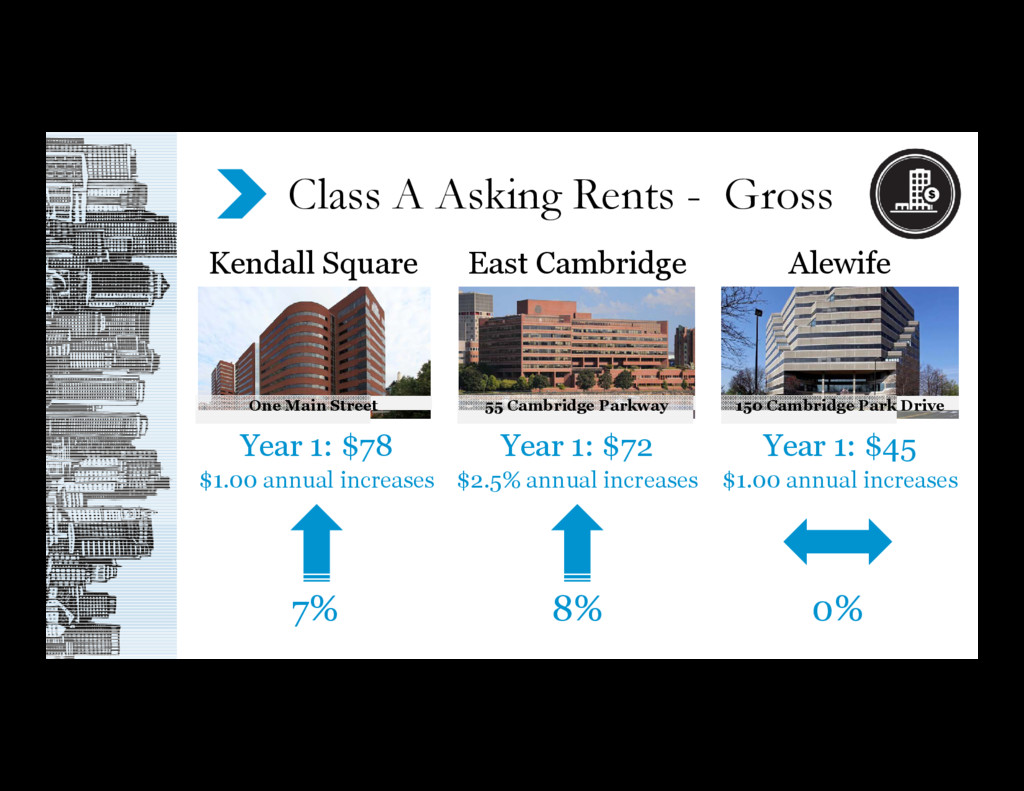
One Main Street 55 Cambridge Parkway Kendall Square Alewife Class A Asking Rents - Gross East Cambridge Year 1: $78 $1.00 annual increases Year 1: $72 $2.5% annual increases 7% 8% 0%
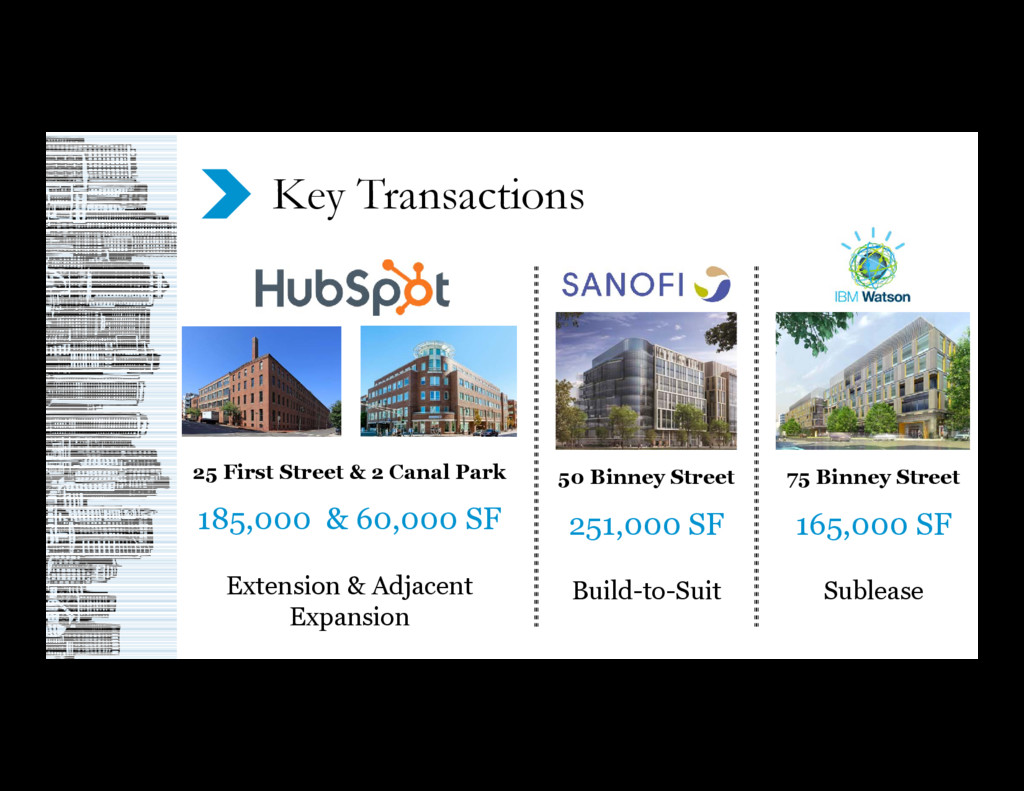
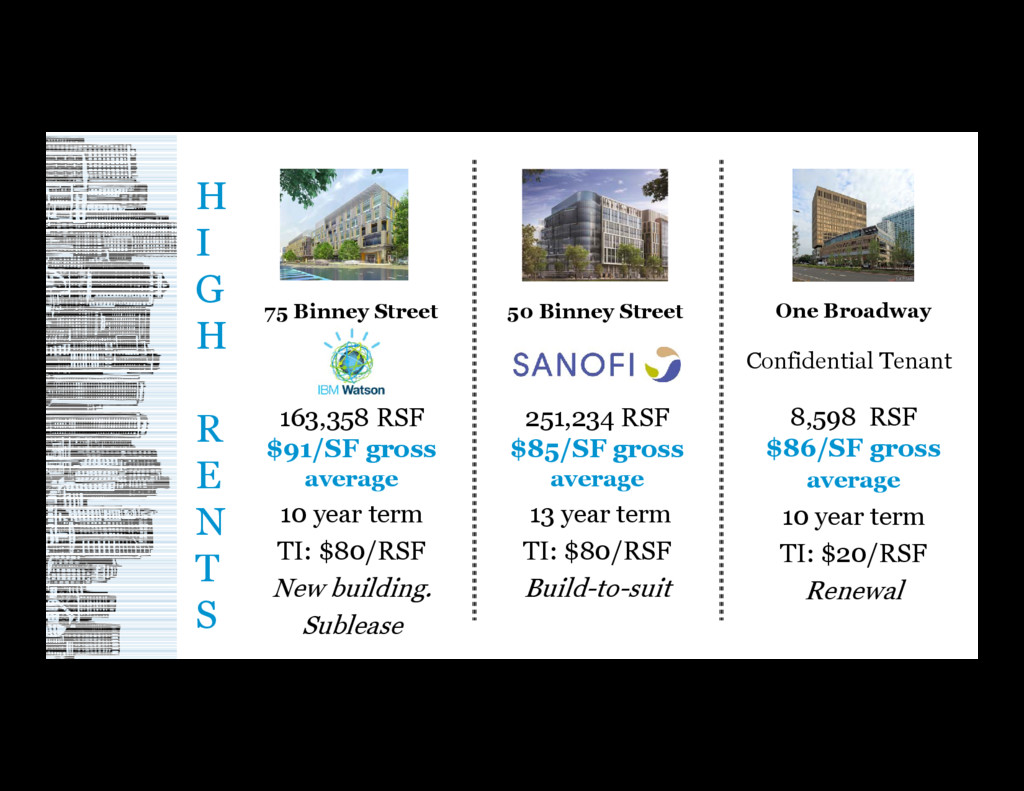
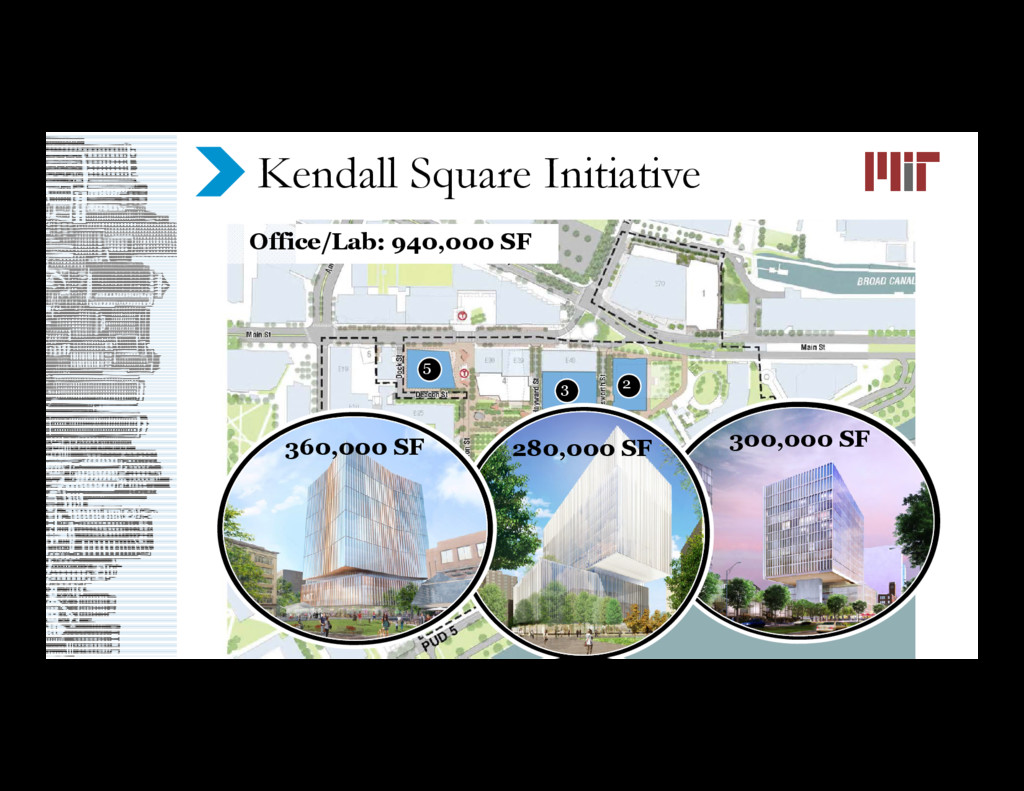
Renewal H I G H R E N T S One Broadway 251,234 RSF $85/SF gross average 13 year term TI: $80/RSF Build-to-suit 50 Binney Street 163,358 RSF $91/SF gross average 10 year term TI: $80/RSF New building. Sublease 75 Binney Street Confidential Tenant
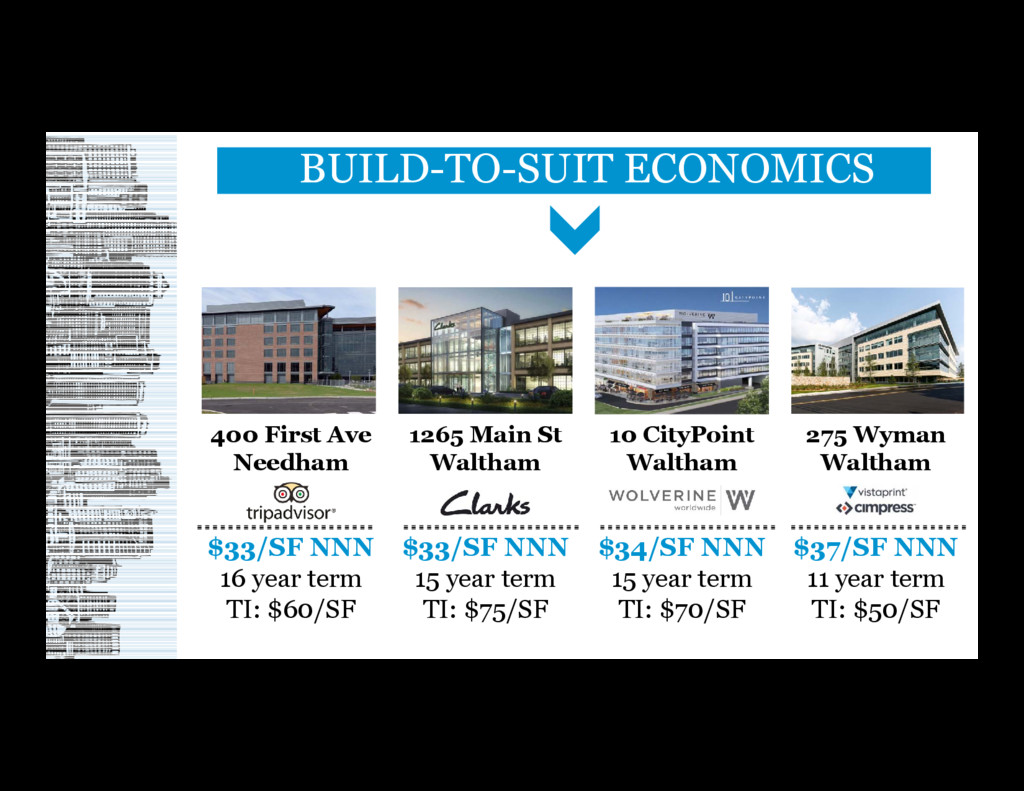
$60/SF 1265 Main St Waltham $33/SF NNN 15 year term TI: $75/SF 10 CityPoint Waltham $34/SF NNN 15 year term TI: $70/SF 275 Wyman Waltham $37/SF NNN 11 year term TI: $50/SF BUILD-TO-SUIT ECONOMICS
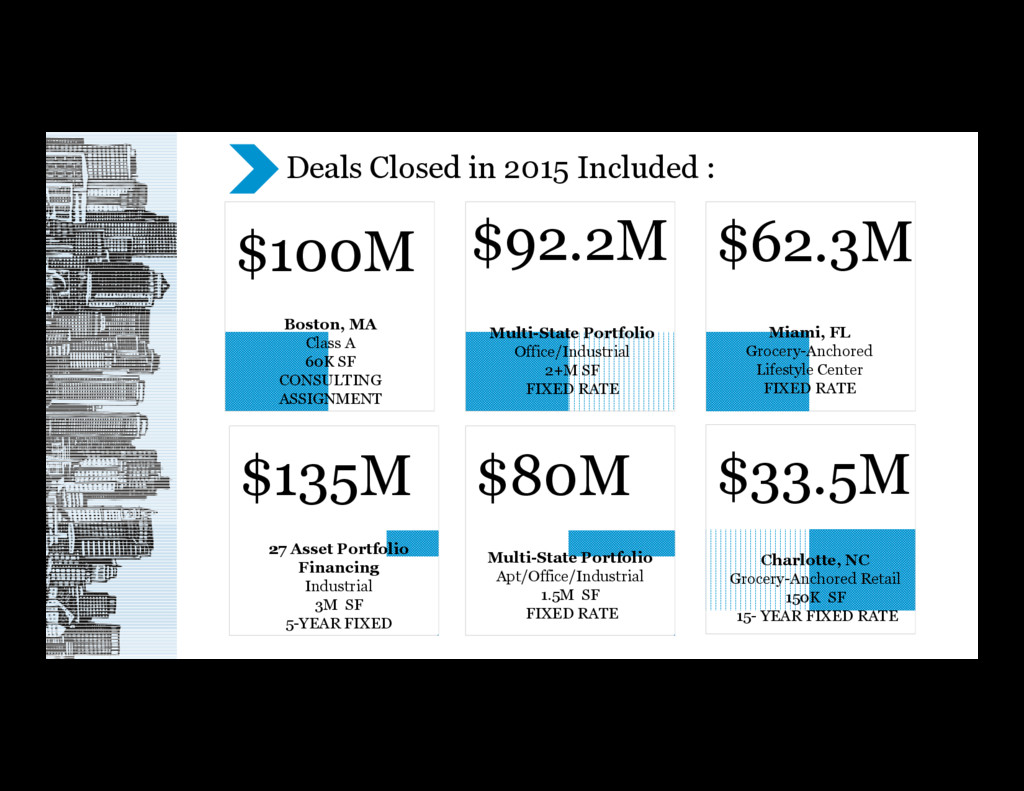
Boston, MA Class A 60K SF CONSULTING ASSIGNMENT $92.2M $62.3M Multi-State Portfolio Office/Industrial 2+M SF FIXED RATE Miami, FL Grocery-Anchored Lifestyle Center FIXED RATE $135M $80M $33.5M 27 Asset Portfolio Financing Industrial 3M SF 5-YEAR FIXED Multi-State Portfolio Apt/Office/Industrial 1.5M SF FIXED RATE Charlotte, NC Grocery-Anchored Retail 150K SF 15- YEAR FIXED RATE Deals Closed in 2015 Included :
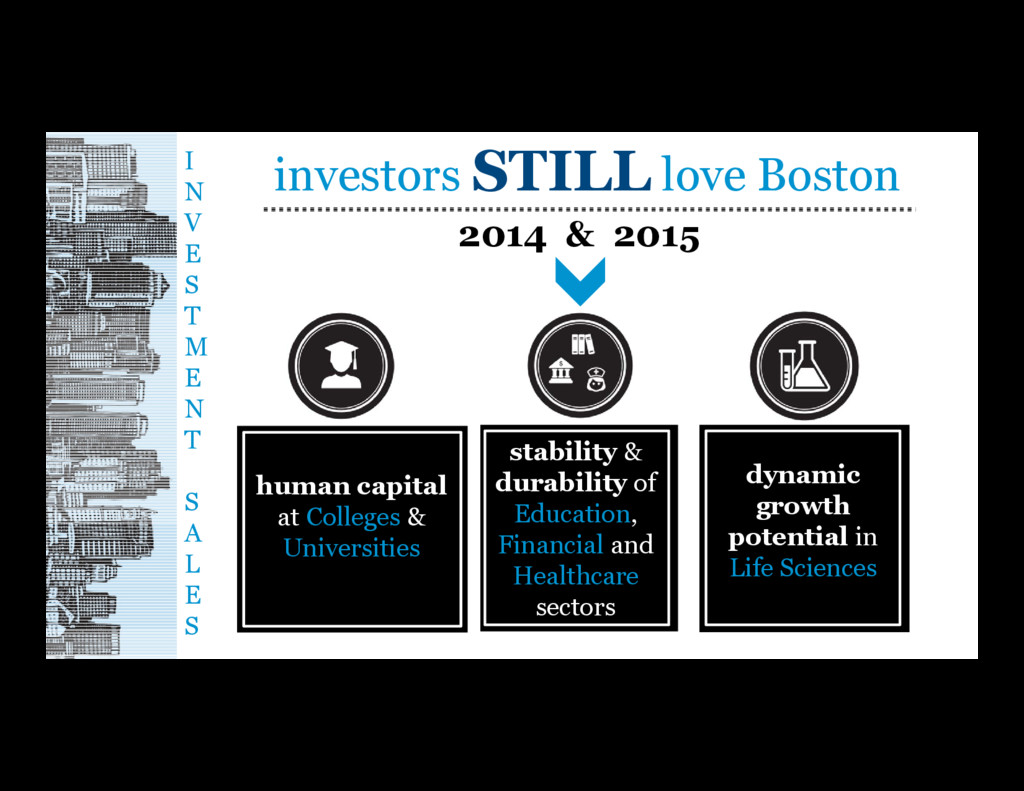
S A L E S human capital at Colleges & Universities stability & durability of Education, Financial and Healthcare sectors dynamic growth potential in Life Sciences 2014 & 2015 investors STILL love Boston
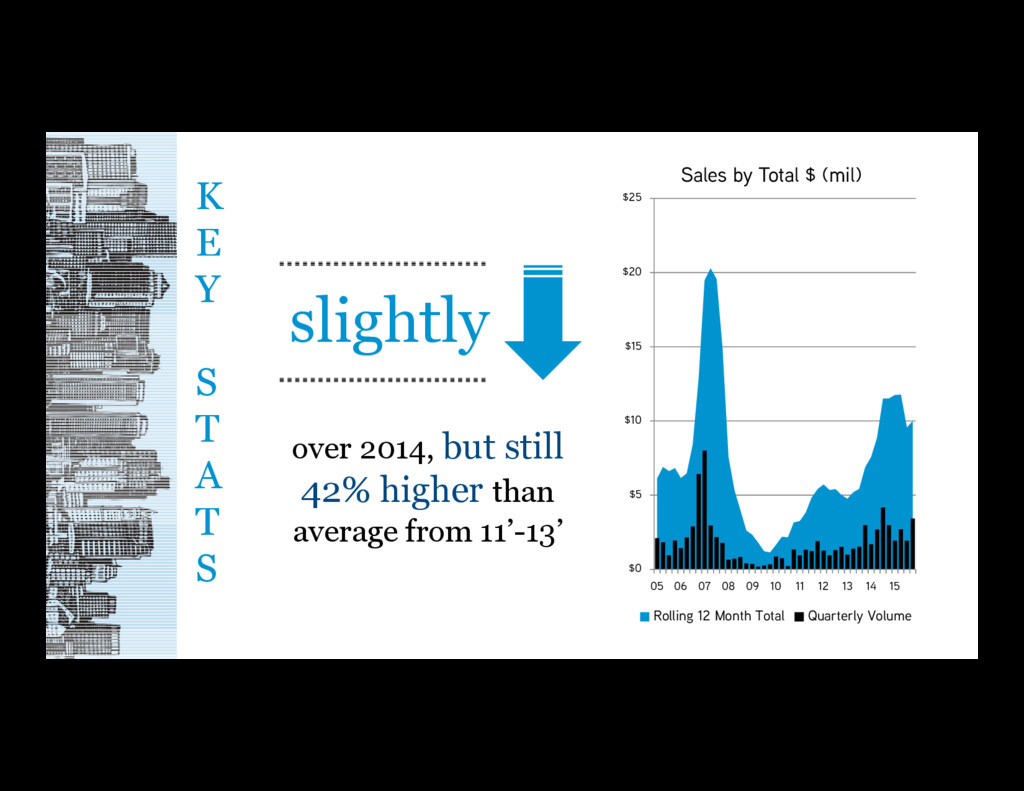
but still 42% higher than average from 11’-13’ slightly $0 $5 $10 $15 $20 $25 05 06 07 08 09 10 11 12 13 14 15 Sales by Total $ (mil) Rolling 12 Month Total Quarterly Volume
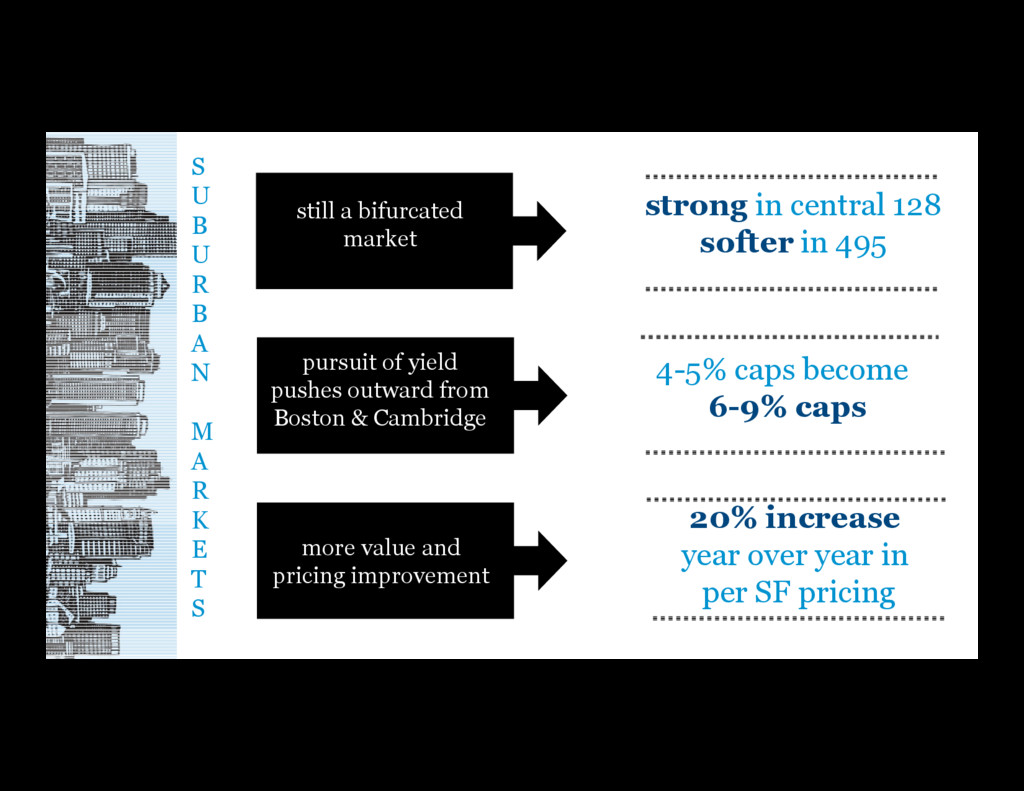
R K E T S pursuit of yield pushes outward from Boston & Cambridge 4-5% caps become 6-9% caps more value and pricing improvement 20% increase year over year in per SF pricing still a bifurcated market strong in central 128 softer in 495
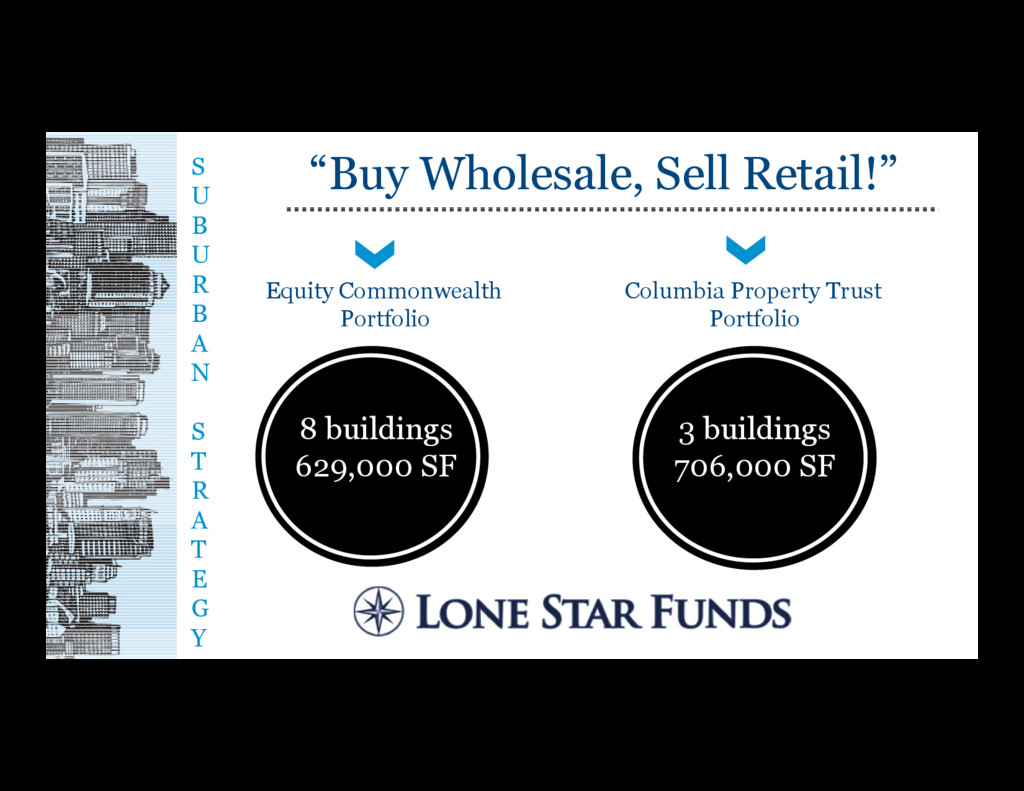
R A T E G Y “Buy Wholesale, Sell Retail!” Equity Commonwealth Portfolio $376 million 5.3 million SF Columbia Property Trust Portfolio $433 million 2.9 million SF 8 buildings 629,000 SF 3 buildings 706,000 SF
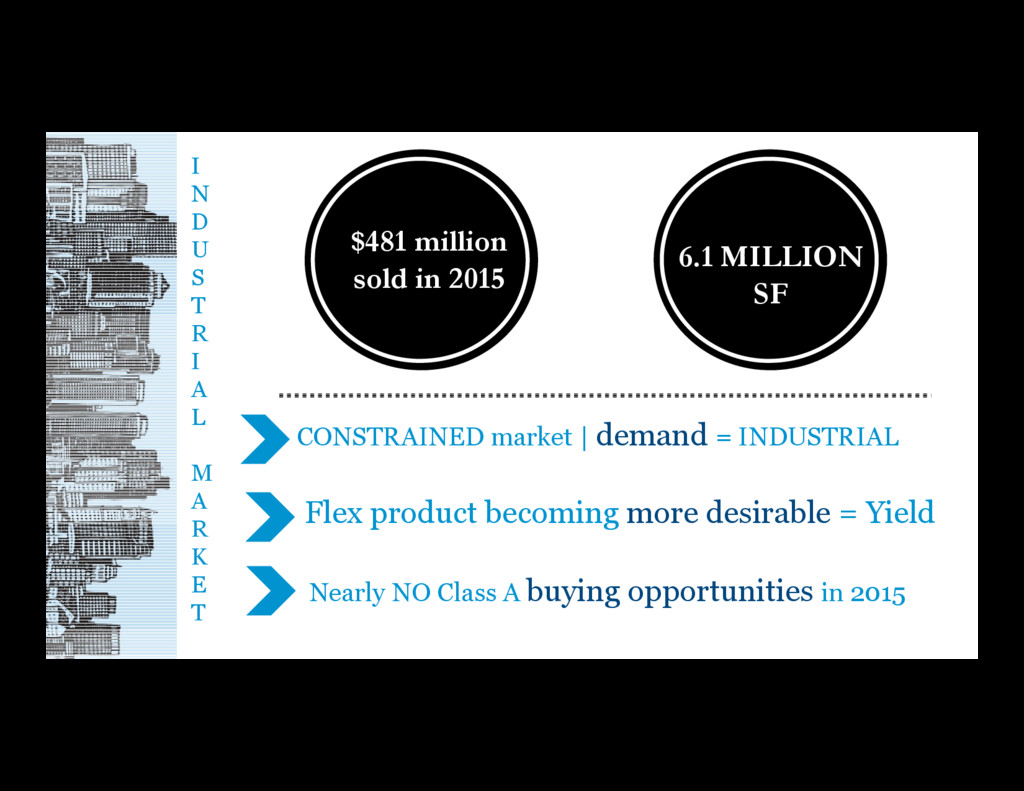
M A R K E T CONSTRAINED market | demand = INDUSTRIAL Flex product becoming more desirable = Yield 6.1 MILLION SF $481 million sold in 2015 Nearly NO Class A buying opportunities in 2015
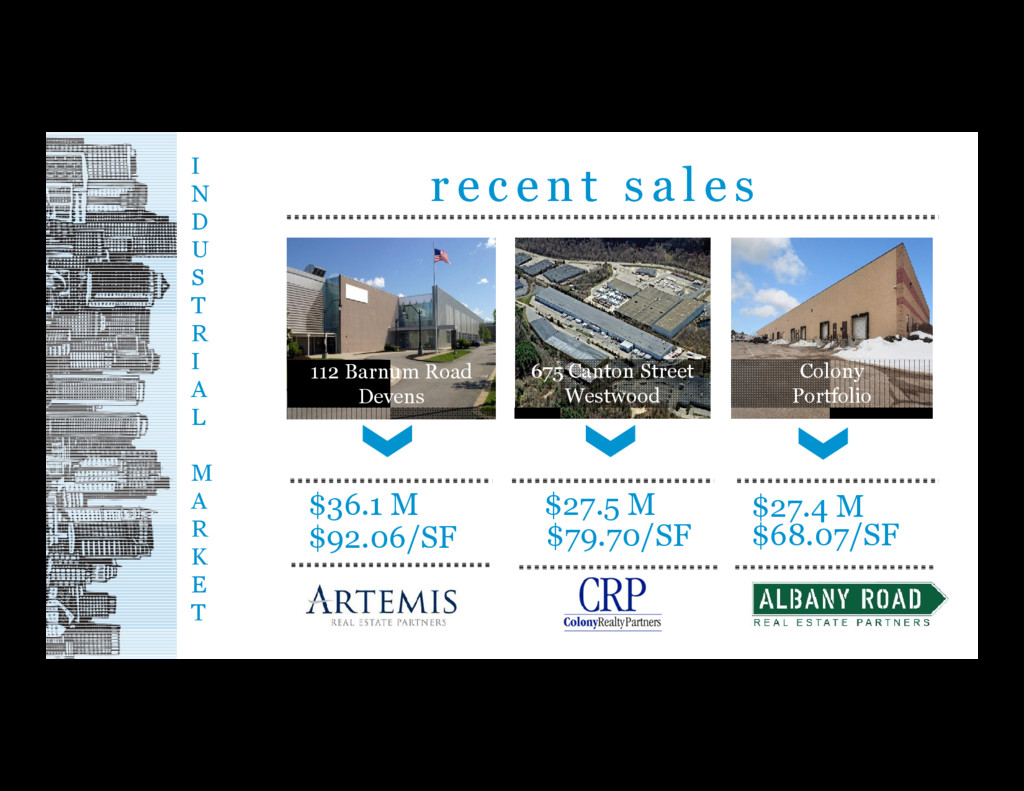
s 112 Barnum Road Devens 675 Canton Street Westwood Colony Portfolio I N D U S T R I A L M A R K E T $36.1 M $92.06/SF $27.5 M $79.70/SF $27.4 M $68.07/SF
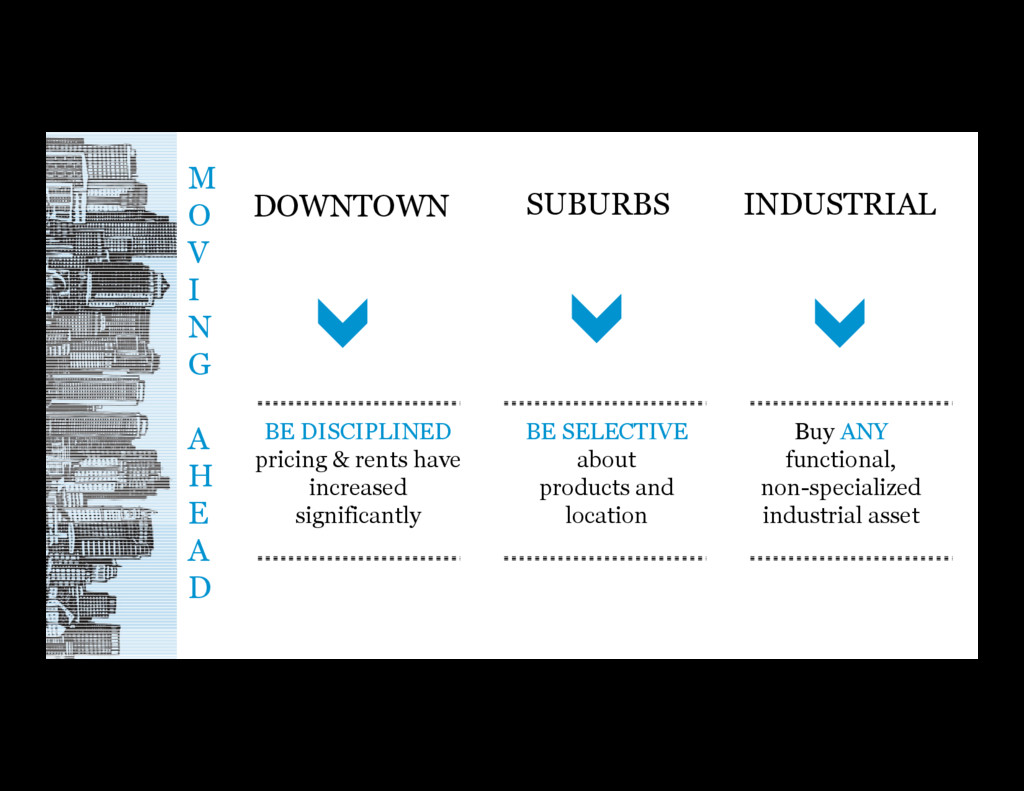
D DOWNTOWN SUBURBS INDUSTRIAL BE DISCIPLINED pricing & rents have increased significantly BE SELECTIVE about products and location Buy ANY functional, non-specialized industrial asset