Upgrade to Pro — share decks privately, control downloads, hide ads and more …

Diagnosing Cancer with Azure Machine Learning

Diagnosing Cancer with Azure Machine Learning

[Video of talk](https://www.youtube.com/watch?v=XPbiwxa2UfU)

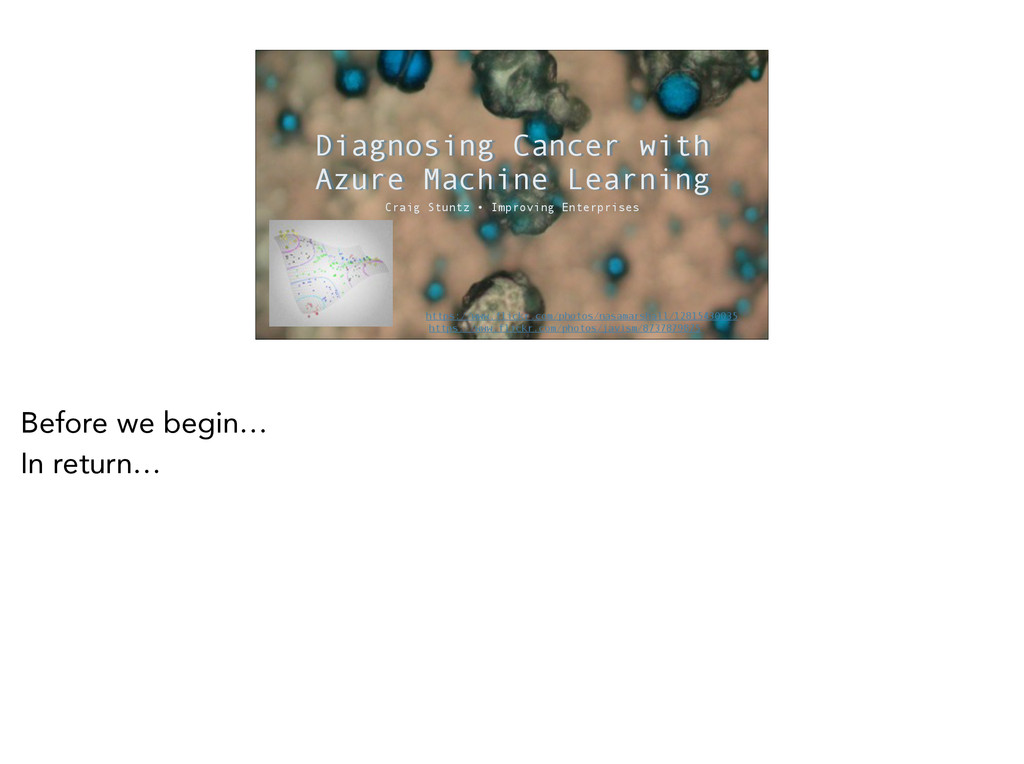
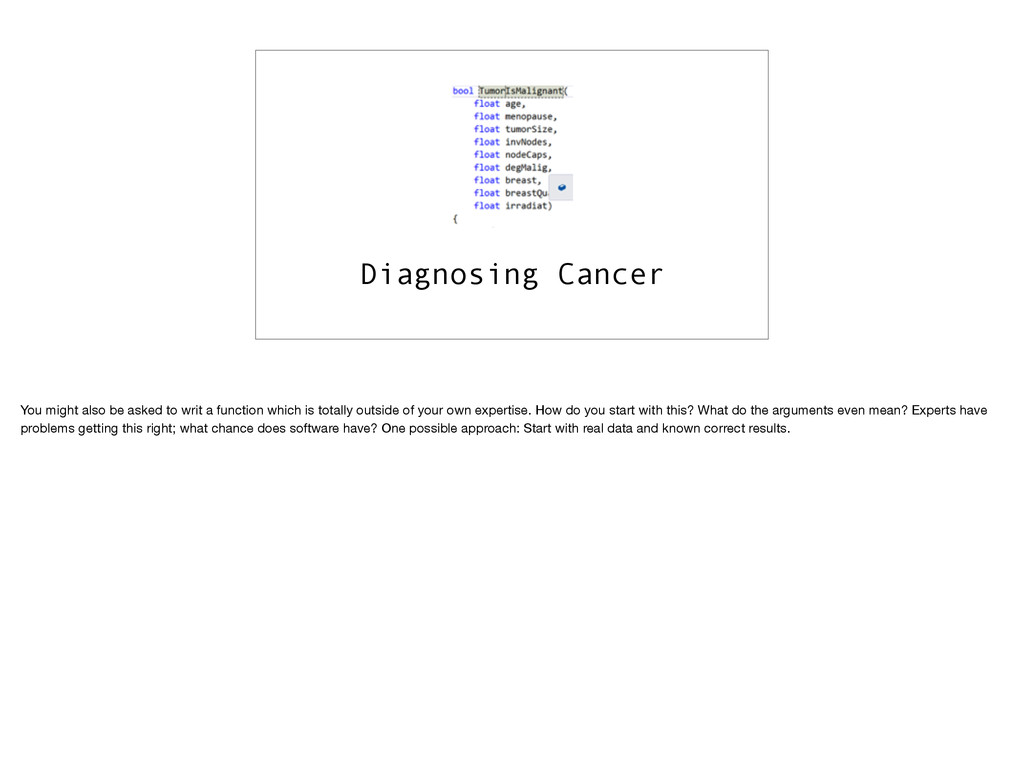
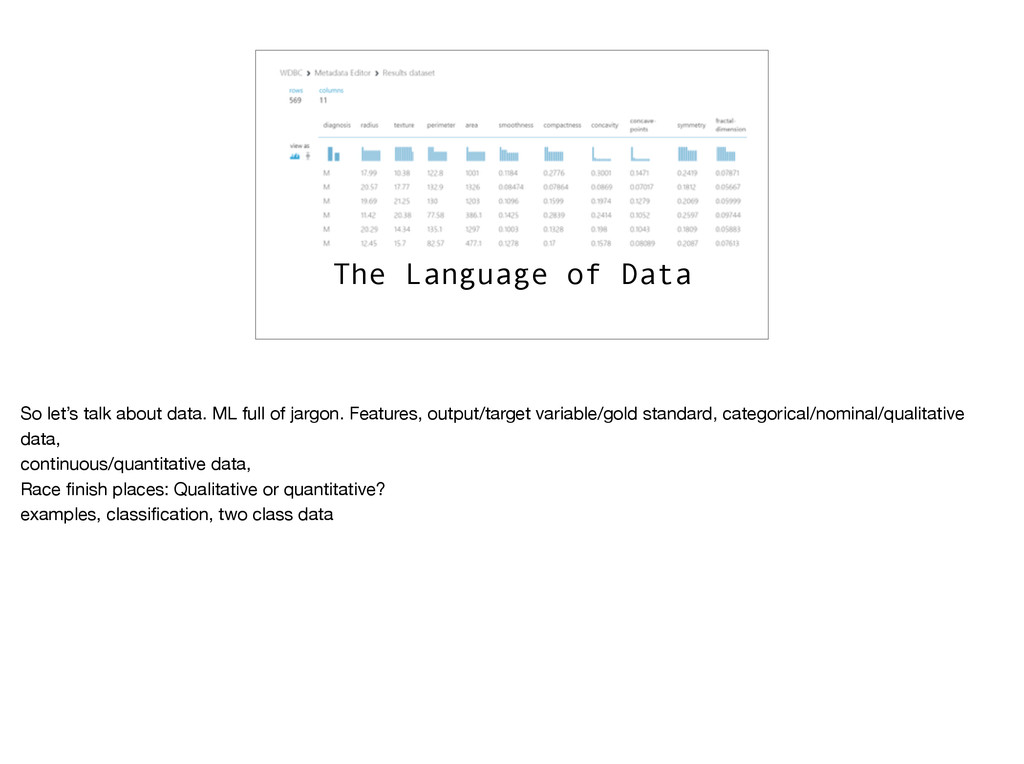
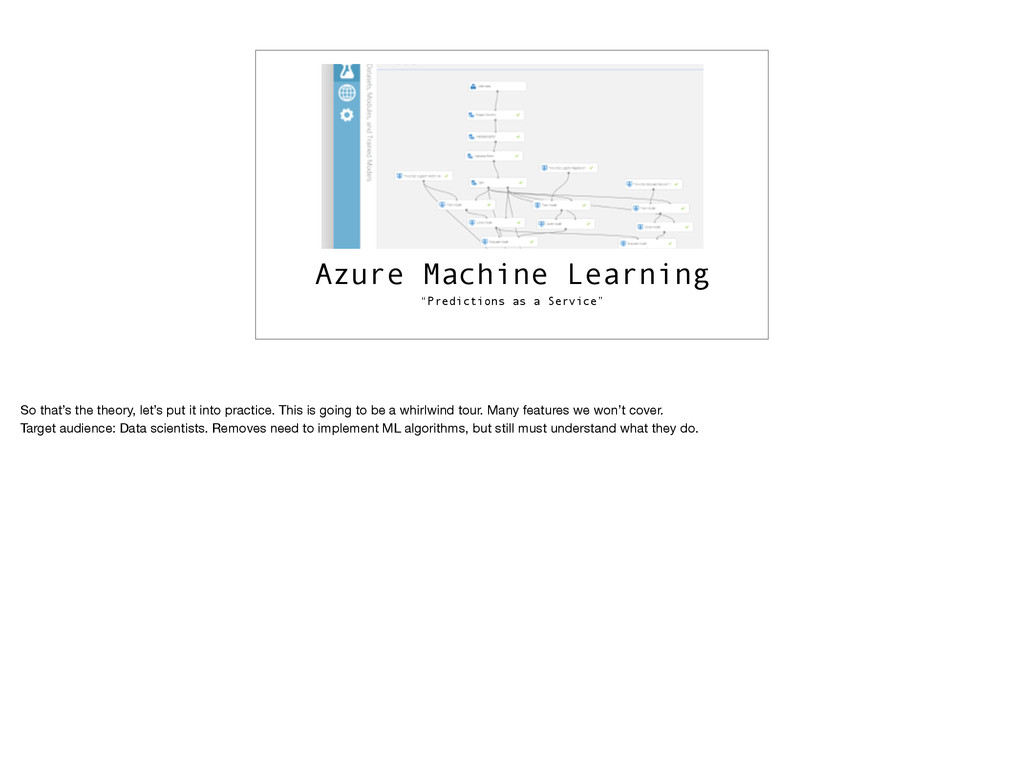
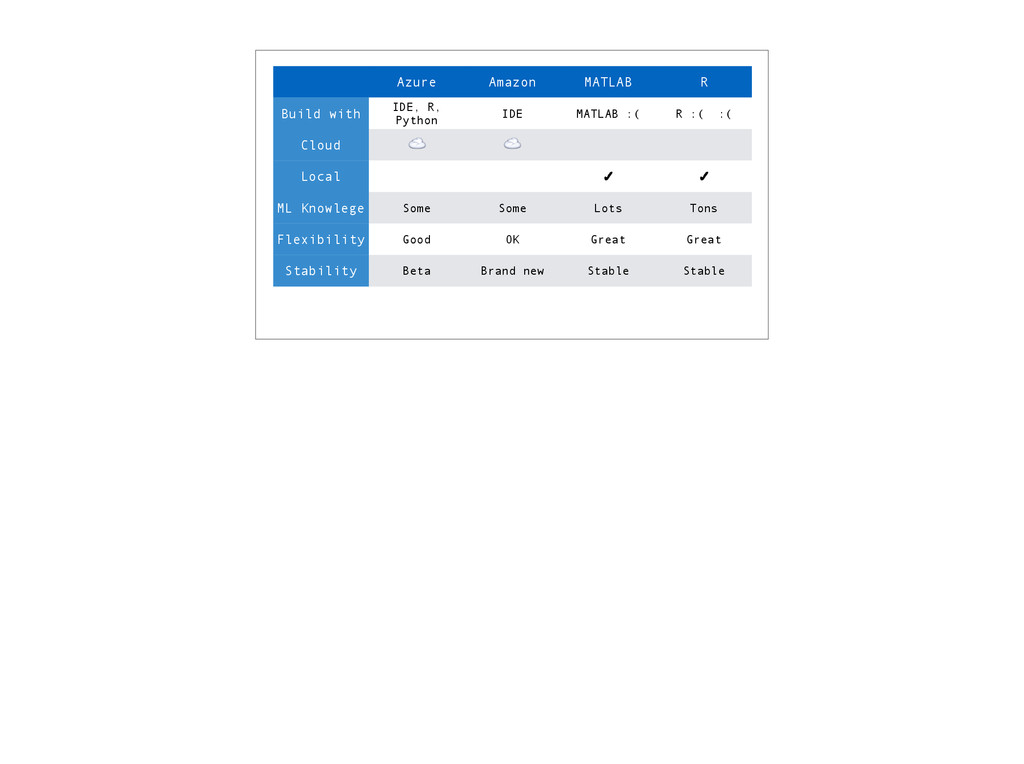
Azure Machine Learning provides an unusual mix of features designed to allow you to easily create "predictions as a service." There is integration with existing Azure data services, including HDInsight, a click and drag visual editor for creating machine learning experiments, and integration with the R language and libraries. The aim is to have a product which allows beginners to get started in machine learning while still delivering the features experts require. Does it deliver? We will build an experiment to predict cancer diagnoses based on observed characteristics of diagnostic imaging. We will also compare what we have built with other systems which attempt to solve the same class of problems.

Craig Stuntz

April 30, 2015
Tweet

More Decks by Craig Stuntz

Other Decks in Programming

Transcript

  1. Diagnosing Cancer with
    Azure Machine Learning
    Craig Stuntz • Improving Enterprises
    https://www.flickr.com/photos/nasamarshall/12815430035
    https://www.flickr.com/photos/javism/8737879875
    Before we begin…
    In return…

    View Slide

  2. Slides
    speakerdeck.com/craigstuntz
    This presentation is fairly heavily hyperlinked. Do download and read further if you see something interesting on a slide.

    I’m going to run the full hour. There will not be a separate question time at the end. Please interrupt for questions!

    View Slide

  3. Machine Learning Is…
    something you (yes, you!) can understand
    a solution to some hard (otherwise impossible?)
    problems
    easier on Azure
    Understand: Full of jargon, but concepts not so hard

    Easier: Write tests, solve hard problems (maybe impossible without ML?) with remarkably little code

    Azure: Nothing to install, algorithms ready to use, scales, predictions as a service

    Really important: Please call me out on jargon! Don’t need to raise your hand. “What’s that?” Practice now!

    View Slide

  4. ⚙ Settings
    Machine
    Learning
    Basics
    Azure
    Machine
    Learning
    Some of Both
    This presentation is user configurable. I want you to leave this presentation with new ideas for how to
    solve real problems. Azure makes it easier, but still presumes ML knowledge. What works for you?

    View Slide

  5. Real-World Machine Learning
    • Diagnose cancer
    • Spam filters
    • Shopping recommendations
    • Pricing
    • Credit fraud detection
    • Language translation
    • Identify cat videos on YouTube
    http://arxiv.org/pdf/1112.6209v5.pdf
    These are hard!

    “Impossible” problems are the killer app for machine learning.

    But we’re just getting started, so let’s talk about something simpler…

    View Slide

  6. Functions
    int f(x) { return x*x; }
    If I give you the function, it’s easy to produce the curve. What if I gave you the curve, asked for the function?

    A bit harder to do in reverse, but maybe you recognize the shape? Machine learning in a nutshell: Derive algorithms from data. “Running programs backwards.”

    If you look at this and notice it’s a parabola, then you just need to work out a few parameters to the equation, like location of the focus. In this case, the data is the curve,
    the model is the function for a parabola, and the model has parameters. ML has techniques for finding the parameters. ML models also have a cost function which
    measures difference between model and data.

    View Slide

  7. Spam Classification
    So let’s talk about some functions we might want to write.

    This one is for email classification. It’s not very good. Why?

    1) Doesn’t work, even for non-trivial implementation (people tried this kind of technique for years).

    2) This is short, real one huge/unmaintainable.

    3) Different for everyone. Some people like spam!

    View Slide

  8. Handwritten Character Recognition
    Some functions have lots of arguments. Each char has 400 pixels == 400 arguments. Rolling them into one “image” argument doesn’t make it any easier. You can’t
    actually write code like this by hand. (and have it work).

    View Slide

  9. Diagnosing Cancer
    You might also be asked to writ a function which is totally outside of your own expertise. How do you start with this? What do the arguments even mean? Experts have
    problems getting this right; what chance does software have? One possible approach: Start with real data and known correct results.

    View Slide

  10. Linear Regression
    http://commons.wikimedia.org/wiki/File:Linear_regression.svg
    Earlier I showed you points which landed on a tidy curve. Real data doesn’t always fit the curve.

    Red line is a model of real-world system.

    There is error. Where? Is it in the model (red line), the measurements (dots wrong), or is the real world just complicated? There is no clear answer without more
    information. “x” one arg vs. many.

    Talk about parameters, mention cost.

    View Slide

  11. Machine Learning vs. Statistics
    Machine
    Learning
    Statistics
    Tools
    Accuracy Insight
    Some of this sounds like statistics.

    Considerable overlap in tools, algorithms. Regression from statistics. Neural nets not.

    Fundamentally very different fields. Oversimplification: Statistics: Gatekeeper for sciences. ML: Get answers.

    Stats not supposed to just crank parameters until you get the results you want, even in election years.

    ML kind of formalizes this.

    View Slide

  12. Overfitting, Underfitting
    Which model is right?
    http://commons.wikimedia.org/wiki/File:Overfit.png
    Red line is terrible.

    Curved line passes through all points,

    but straight line is a better model — reflects data we haven’t seen yet. Much of ML is bias (red; model doesn’t reflect real data) vs. variance (curvy; predictions change
    too much with data points). Perfect models have neither bias nor variance. For imperfect models, it’s important to understand whether imperfection is due to bias or
    variance. Different fixes

    Reduce cost on training data and test data.

    View Slide

  13. Workflow
    Collect Data
    Prepare - Clean, Normalize, Reduce Dimensionality
    Analyze, Consider Goal, Choose Algorithm
    Train Model
    Evaluate Model
    Iterate Until Satisfactory
    Use System
    Prepare is one of the hardest, most boring, necessary.

    We’ll drill into other steps soon

    View Slide

  14. Collect Data
    https://xkcd.com/1260/
    You need “enough” data. Guess. Get more later if it will help your selected algorithm.

    View Slide

  15. The Unreasonable Effectiveness of Data
    http://static.googleusercontent.com/media/research.google.com/en/us/pubs/
    archive/35179.pdf
    Awesome article. Data vs. grammar: Data wins.

    Key idea: Don’t write algorithms when lots of data is better!

    View Slide

  16. The Language of Data
    So let’s talk about data. ML full of jargon. Features, output/target variable/gold standard, categorical/nominal/qualitative
    data,

    continuous/quantitative data,

    Race finish places: Qualitative or quantitative?

    examples, classification, two class data

    View Slide

  17. Classification Imbalance
    Dataset imbalanced. Can use oversampling, under sampling. Could influence choice of anomaly detection algorithm. Will discuss later. For some problems it’s better to
    have a false positive than a false negative, or vice versa.

    View Slide

  18. Data Sets
    • Training Set
    • [Cross] Validation Set
    • Test Set
    Training Validation Test
    For supervised learning, we often partition/sample data

    Training set: Adjust weights/parameters

    [Cross] Validation set: Minimize overfitting, choose algorithm.

    Test set: Test final system. Omitted in simple examples.

    View Slide

  19. Choose Algorithm
    Heart of the matter. Lots of choices in Azure ML! Didn’t even expand Classification node. You need to understand, but first step is understanding anomalies vs.
    classification vs. regression

    View Slide

  20. Classification
    a.k.a. Categorization
    http://commons.wikimedia.org/wiki/File:CART_tree_titanic_survivors.png
    We’ve discussed regression. Categorization is…

    This is a decision tree to predict Titanic survivors (two class). Decision tree is interesting because it gives you insight into the structure of your data. Many ML algorithms
    like NN really don’t.

    Regression and categorization are supervised learning. Pop quiz, what are the features here?

    (sibsp = # of siblings or spouses) #s under leaf: P(survival), %observations in leaf.

    View Slide

  21. Unsupervised Learning
    http://commons.wikimedia.org/wiki/File:KMeans-Gaussian-data.svg
    Everything so far presumed there were examples with known values.

    This is k-means clustering. “What can you tell me about X” instead of “Predict Y for X.”

    Supervised (regression, categorization) /unsupervised (clustering)/hybrid (anomoly, recommender)

    View Slide

  22. Anomaly Detection
    Often: Few negative examples, and negative examples look nothing like training negative examples. Positive examples don’t show what anomalies look like. Fraud
    example.

    View Slide

  23. Train Model
    Cost is function of prediction vs. output. Kind of arbitrary, choose what works. Want to optimize model parameters. Cost of overfit line: 0; cost of dashed line: ∞; cost of
    best fit: low.

    How to ensure we pick best fit over overfit? Test data set.

    Most ML training can be expressed as minimizing a cost function by tweaking model parameters.

    View Slide

  24. Evaluate Model
    https://xkcd.com/688/
    Different models require different evaluation. Regression vs.
    classification….

    View Slide

  25. Confusion Matrix
    Confusion Matrix. Useful for classification.

    Ideally we want everything on the diagonal.

    View Slide

  26. Evaluation
    Receiver Operating Characteristic. Accuracy ((TP+TN)/n), Recall (few false negatives TP/(TP+FN)), Precision (few false positives TP/(TP+FP)). Will discuss more on next
    slide. AUC useful but still need to look at curve. Also, some algorithms have different error characteristics FP vs. FN.

    View Slide

  27. Evaluation
    Classifier Accuracy Recall Precision F1 Score Biopsy For
    Always
    Positive
    0.4 1 0 0
    All
    Patients
    Always
    Negative
    0.6 0 1 0 Nobody
    Machine
    Learning
    Model
    0.963 0.926 0.980 0.952
    A Few
    Patients
    You can construct classifier which is perfect for recall or precision, but not both (unless model is perfect). One way to distinguish recall vs. precision is to
    consider degenerate cases. Real world problems want best mix of both, with a bias dictated by the problem itself.

    View Slide

  28. Azure Machine Learning
    “Predictions as a Service”
    So that’s the theory, let’s put it into practice. This is going to be a whirlwind tour. Many features we won’t cover.

    Target audience: Data scientists. Removes need to implement ML algorithms, but still must understand what they do.

    View Slide

  29. Azure Machine Learning
    • Experiment, create web services for predictions,
    then sell them.
    • Machine learning “IDE”
    • Algorithms from Xbox, Bing, and more
    • First class R support
    • Data from SQL Azure, Hive, web, published web
    service
    Features

    View Slide

  30. Demo!
    Now we’ll use Azure ML to build and run an experiment, and convert that
    into a published web service for predictions. No wifi, so…

    View Slide

  31. (Note to folks reading this on speakerdeck.com: In the real presentation the slides from here through the end of the presentation were animations. Speakerdeck doesn’t
    show those. Sorry! Ask me for an in-person demo.)


    You should have an existing Azure storage account. This takes time to create.

    First we need to create an Azure ML Workspace and then launch ML studio

    View Slide

  32. Create experiment. Tutorial templates really helpful when getting started, but we’ll use the blank template to start from scratch. Add data. We’ll use cancer data included
    with Azure ML, but you can also upload data or directly reference data on the web.

    We will split the data twice to produce three groups of data. 60% training, 20% cross validation, 20% test.

    View Slide

  33. What’s in this thing? We can choose Visualize to see a sample of the data. First column, Class is the result/output variable. 0 = benign, 1 = malignant. Remaining features
    in this dataset have been normalized to 1-10 values. Saves us some work. Can click on a column to see ranges of values for other columns. This is just a sample, but you
    can download data at any stage or analyze in Azure ML using R or Python.

    View Slide

  34. Now we can do machine learning. Zoom out for more room. Have to choose an algorithm. We need a two class algorithm, and I’ll start with a decision tree. We can just
    drop it into the workspace, but it’s untrained. Add Train model and connect algorithm and training data. Have to tell Train model what we’re trying to predict. Launch
    column selector, choose Class. We want to compare those predictions with known correct answers in cross validation data set, so add score model and connect to cross
    validation data. Add evaluate model to graph results. Haven’t used test data yet! Does it make sense what all these do? Stop me now! Important: Cross validation set not
    used for training, so not biased by training data.

    View Slide

  35. Run the experiment. This can take a while. The little clocks on the modules will all eventually turn into green checkboxes.

    View Slide

  36. How well did we do? Visualize Evaluate Model.

    The ROC looks fantastic. If we scroll down, we can look at the confusion matrix. AUC = .995

    View Slide

  37. If we’re satisfied with the experiment, we can convert it to a web service for training.

    This used to be much harder, but now you just click the “Prepare Web Service” button.

    View Slide

  38. We could change the name of the published web service arguments, but for now let’s just take the defaults and publish.

    Yes, I know that’s an API key up there. No, that experiment isn’t live anymore.

    This is a service for training model.

    View Slide

  39. Now we can create a scoring experiment for predictions.

    If I click back to the list of experiments, we now have two separate experiments for training and scoring.

    View Slide

  40. I’m going to run the scoring experiment…

    then publish it as a web service.

    Now we have web services for training and scoring / predictions we can call from Excel or any language.

    View Slide

  41. Gallery: Allows sharing experiments as demos.

    View Slide

  42. Other Azure ML Features
    • Execute arbitrary R or Python scripts
    • Integrate with SQL Azure, Hive
    • Parameter sweep, compare models
    • Multiple endpoints; throttle different customers
    Stuff I haven’t demoed.

    View Slide

  43. Still in Beta
    Even if they say it’s not anymore
    Even though it’s no longer a “Preview,” I hit bugs almost daily now.

    View Slide

  44. Pricing
    Pricing (*changes often!)
    Free tier Limited duration, nodes, API
    Studio experiment/hour $1
    Studio predictions Free
    API hour $2
    1000 API predictions $0.50
    Free tier: No Azure billing account required, max 1 hour experiment duration, single node, staging API only (no production). Standard tier: Need Azure account.

    View Slide

  45. Azure Amazon MATLAB R
    Build with IDE, R,
    Python
    IDE MATLAB :( R :( :(
    Cloud
    ☁ ☁
    Local ✓ ✓
    ML Knowlege Some Some Lots Tons
    Flexibility Good OK Great Great
    Stability Beta Brand new Stable Stable

    View Slide

  46. Where to Learn More
    • Microsoft Azure Essentials: Azure Machine Learning,
    free ebook by Jeff Barnes
    • Predictive Modeling with Azure ML Studio video
    • Machine Learning in Action, by Peter Harrington
    • Kaggle, especially a tutorial
    • Andrew Ng’s Machine Learning class, Stanford/Coursera
    • UC Irvine Machine Learning Dataset Repository

    View Slide

  47. CRAIG STUNTZ
    @CraigStuntz
    [email protected]
    http://blogs.teamb.com/craigstuntz
    http://www.meetup.com/Papers-We-Love-Columbus/
    If you want to talk further, come say hi at end of session or use one of these. I can give you an in-person demo in a
    building with internet service.

    View Slide