Upgrade to Pro — share decks privately, control downloads, hide ads and more …

Propagating context and tracing across your distributed process boundaries using OpenTelemetry

Propagating context and tracing across your distributed process boundaries using OpenTelemetry

Presented at API Days Australia LIVE on 16th Sep 2021 and Melbourne .NET meetup on 5th Oct 2021.

Video recording: https://youtu.be/5A3NIveTqOQ

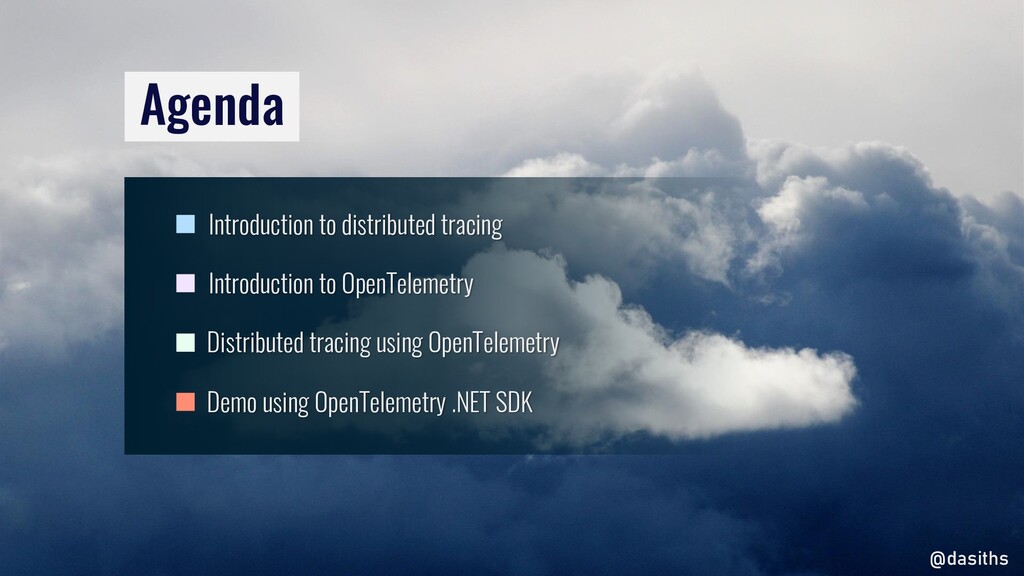
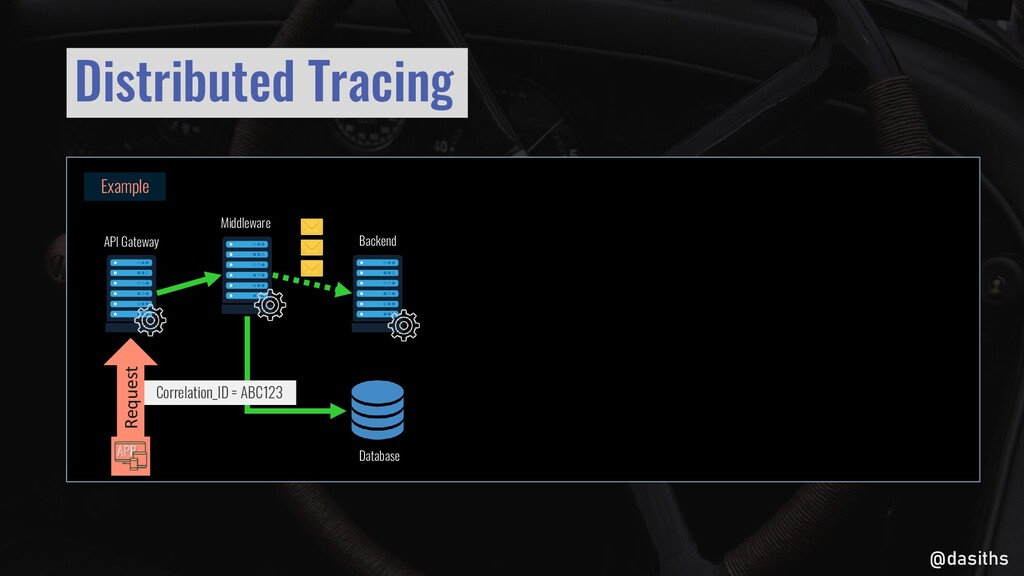
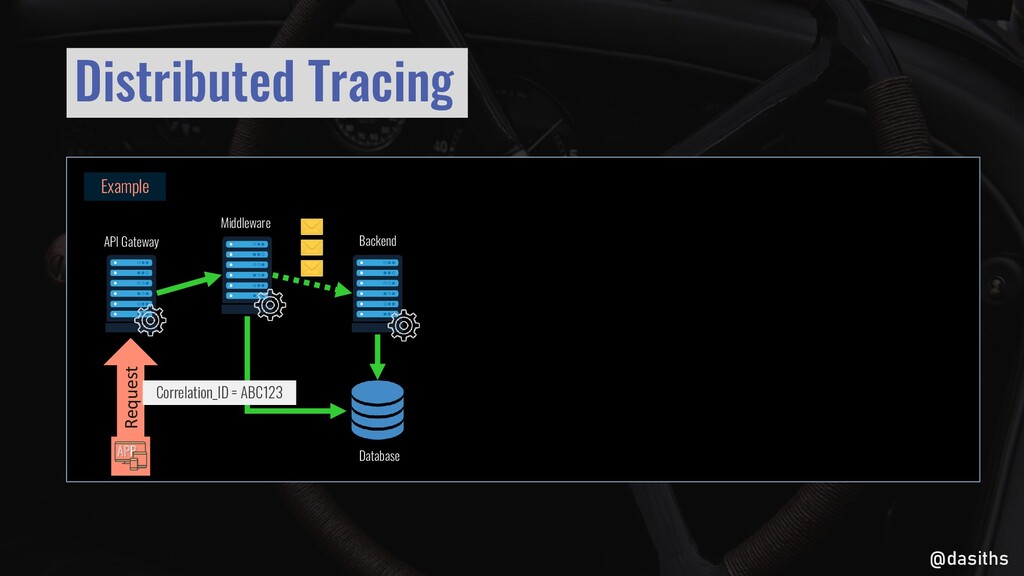
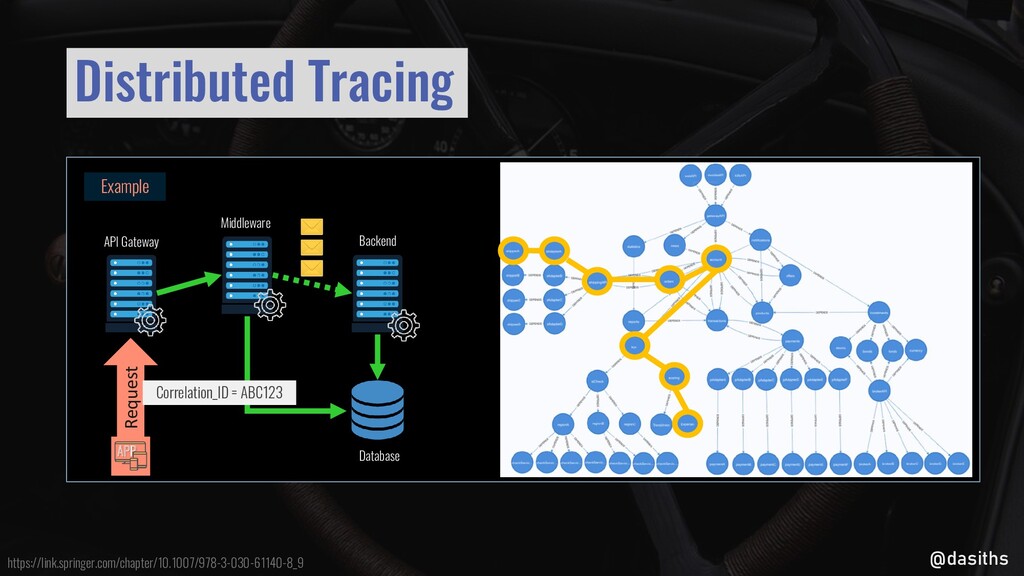
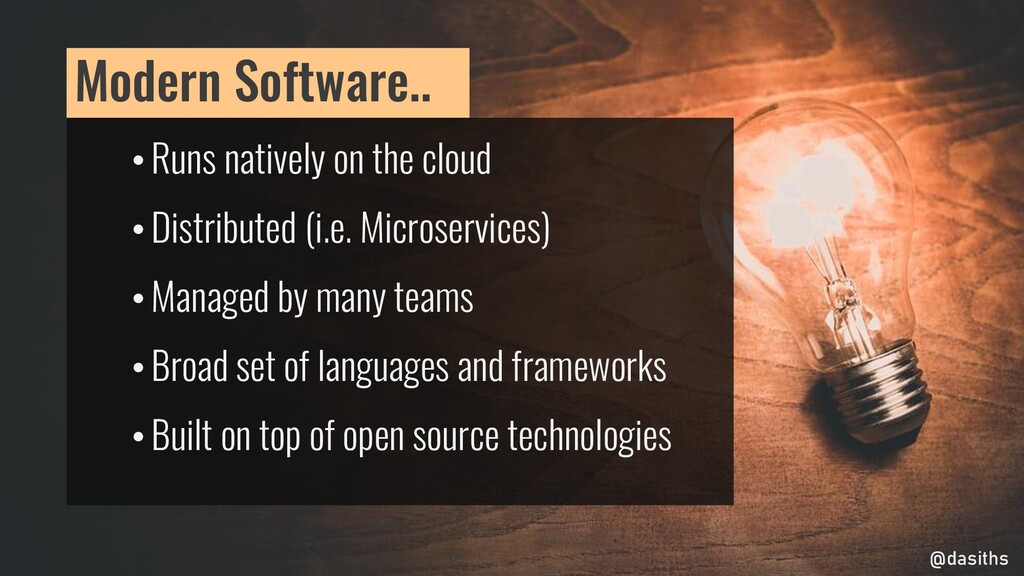
Everyone is building distributed systems these days. Some better than others. One thing the teams building and running distributed systems well have in common is they have very good observability of the components and services. Conversely, the teams that don't have good observability struggle when things go wrong in a distributed system because it's often terribly time consuming to put the pieces together to analyse the crime scene. The logs might sit in disparate log aggregation systems and even when in one place, leave you with having to do the hard work to correlate and visualize the system workflows yourself.

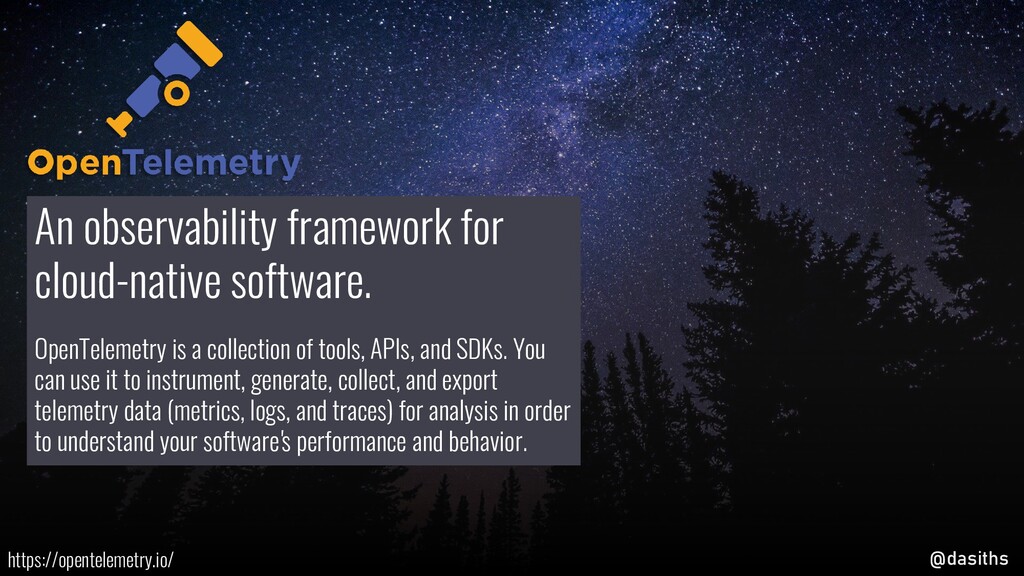
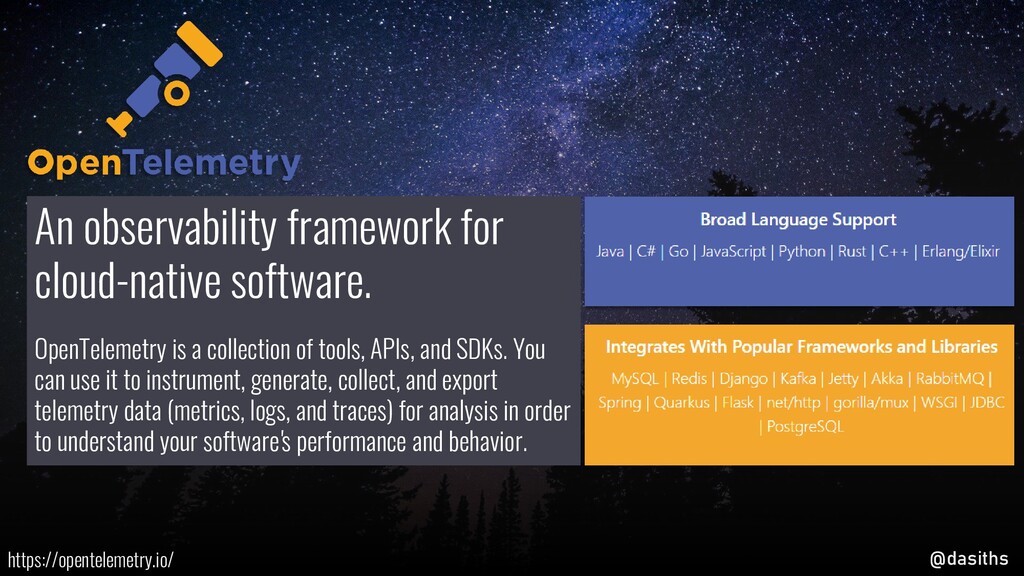
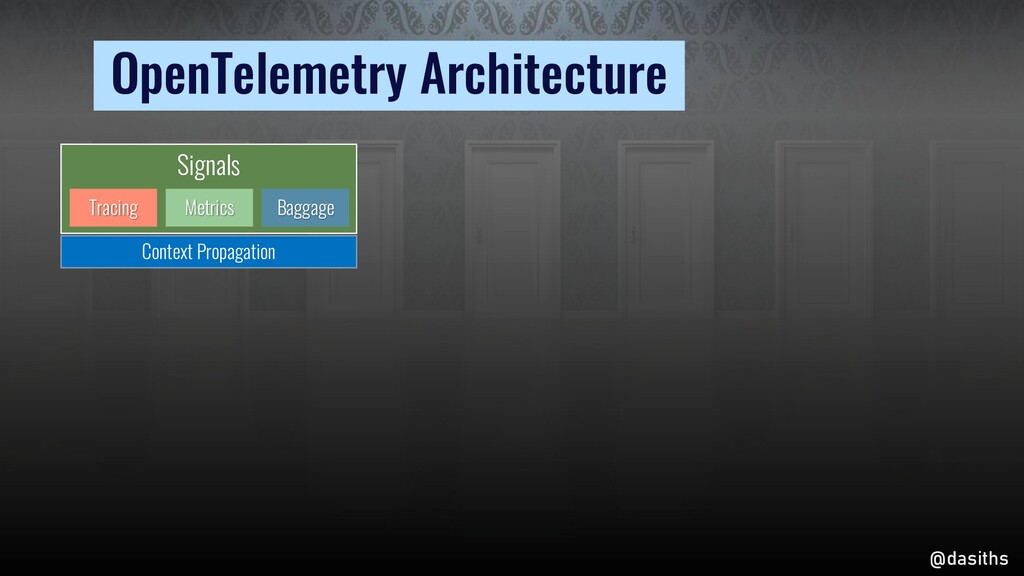
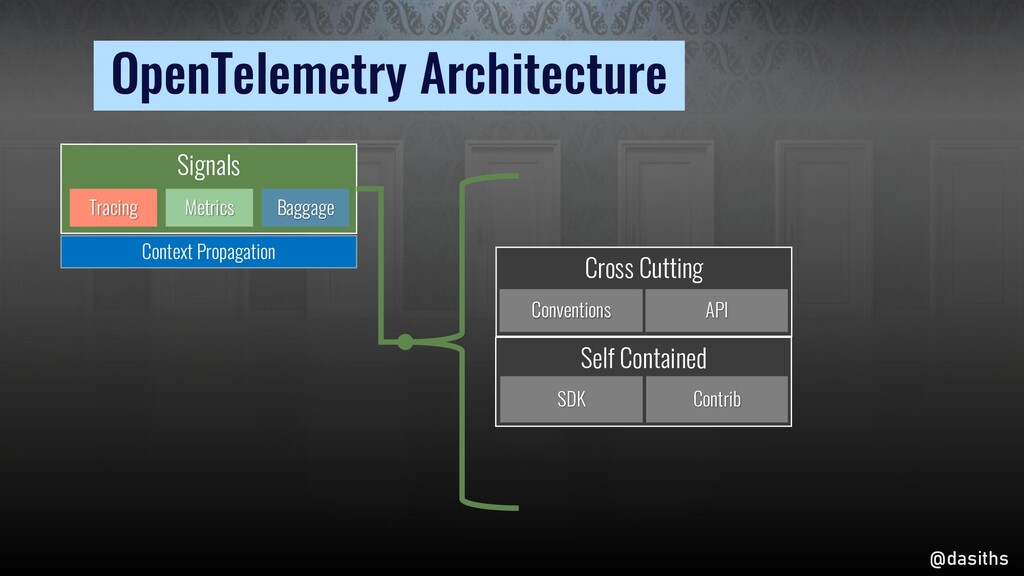
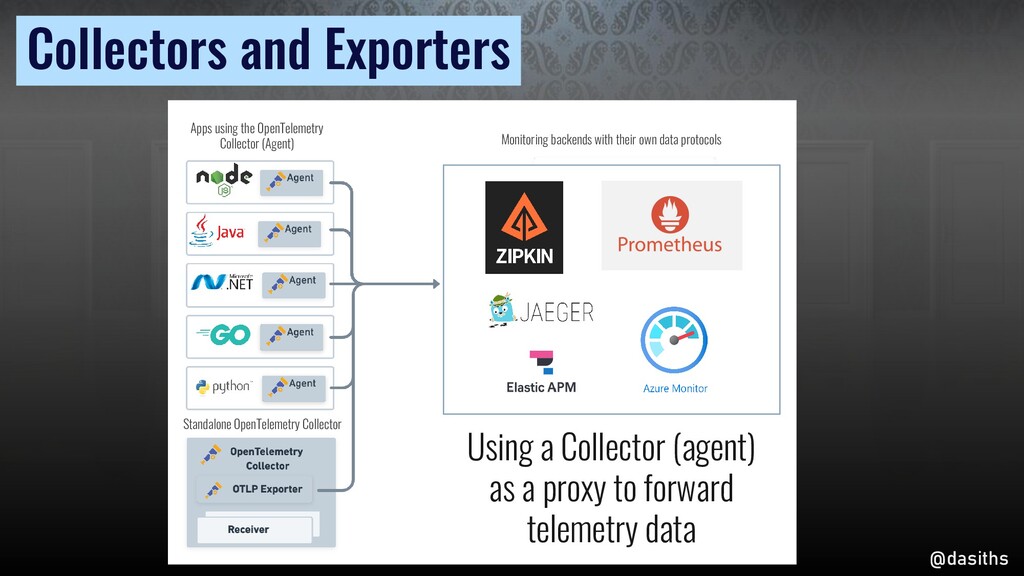
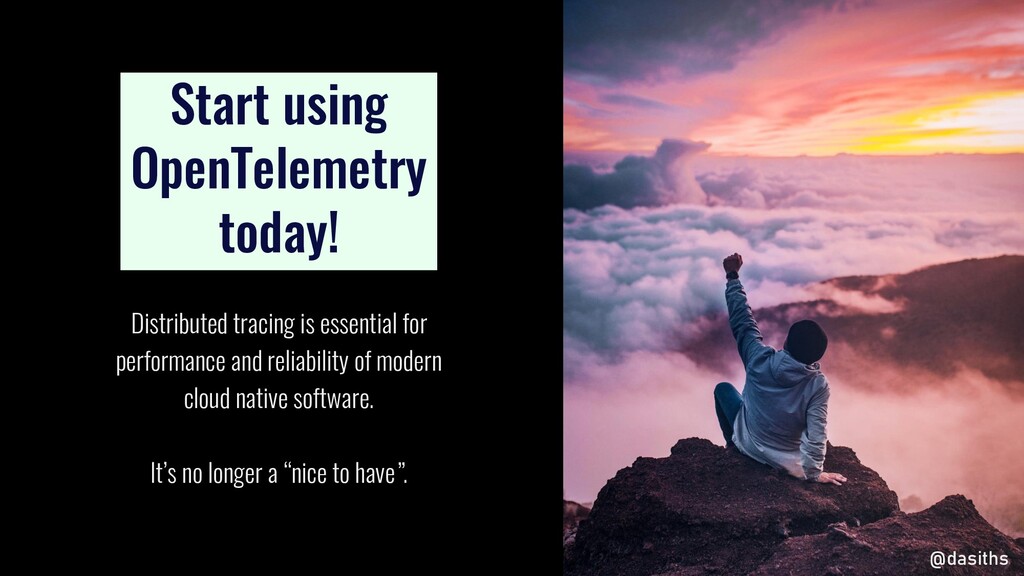
OpenTelemetry is an observability framework for cloud-native software which aims to solve some of these issues by having a common set of definitions of concepts around observability and exposing them to the tool of your choice.

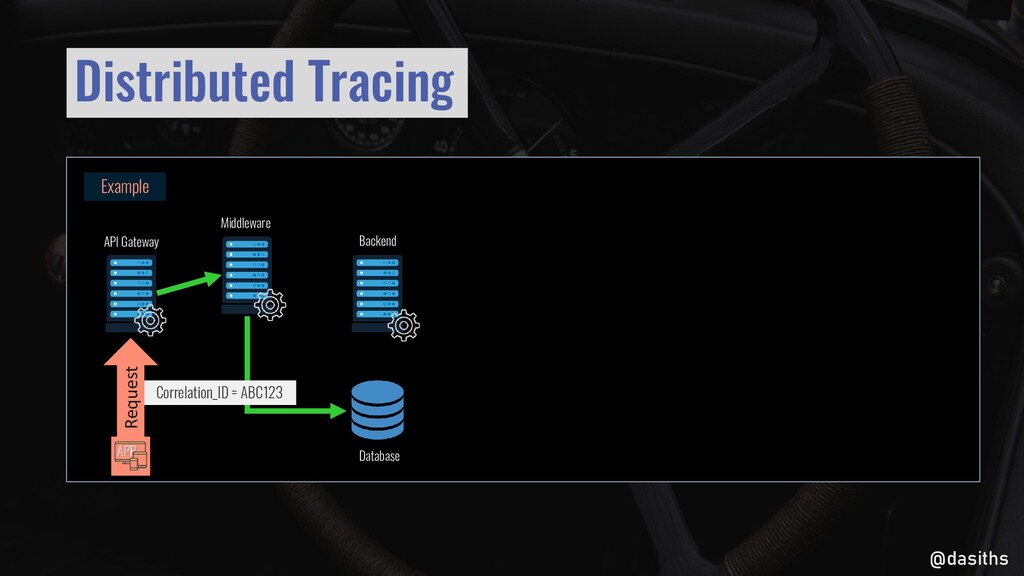
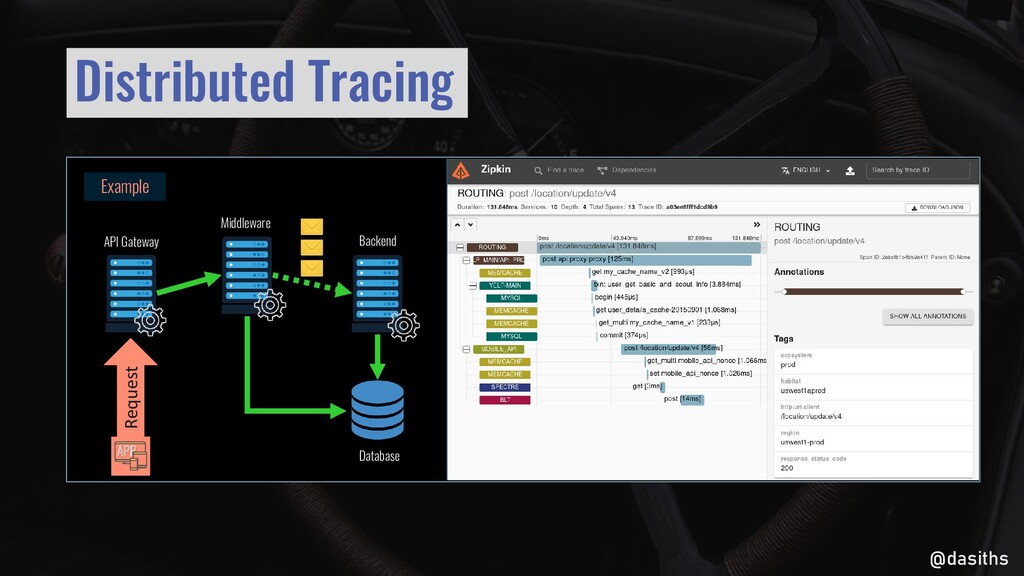
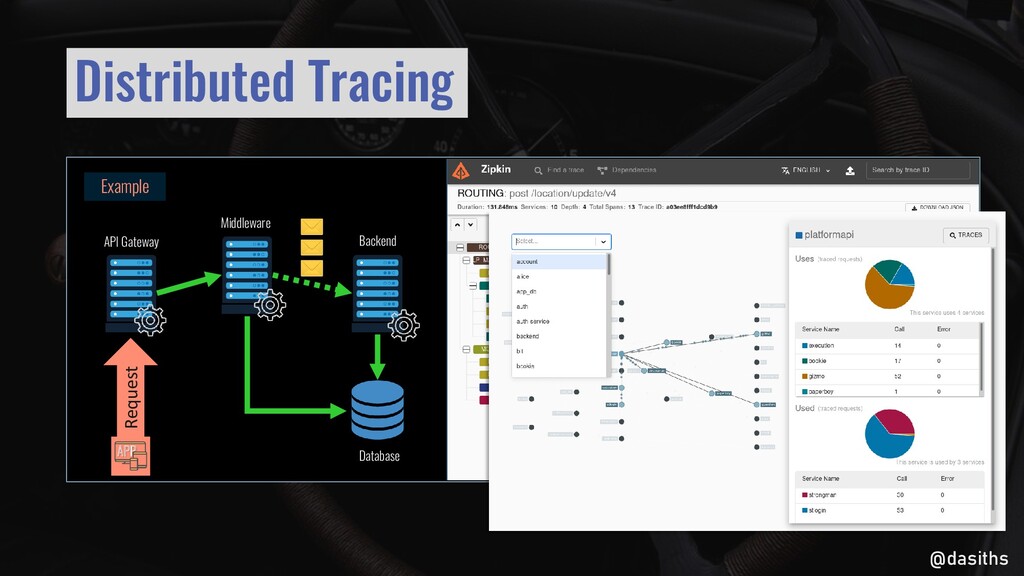
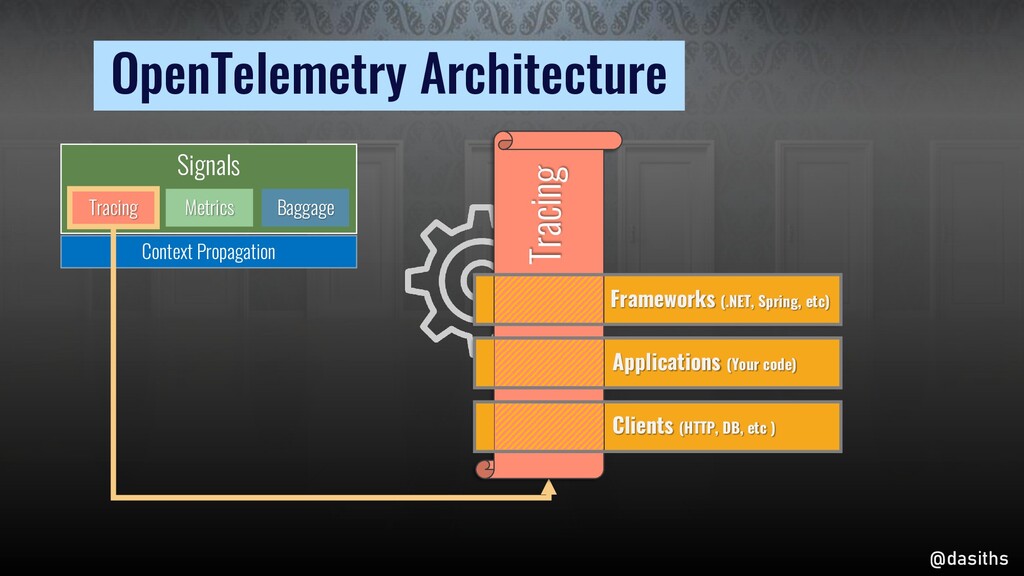
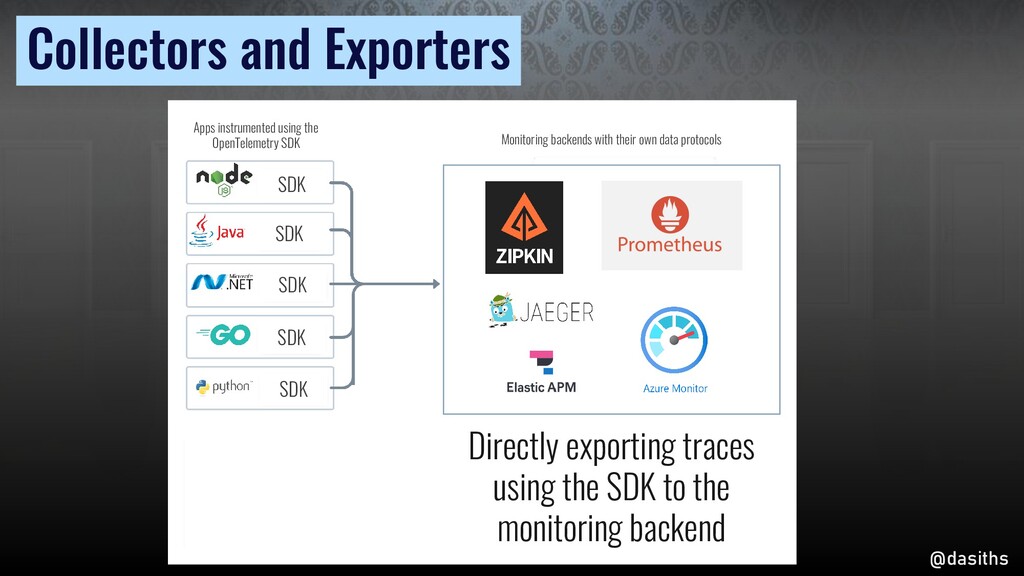
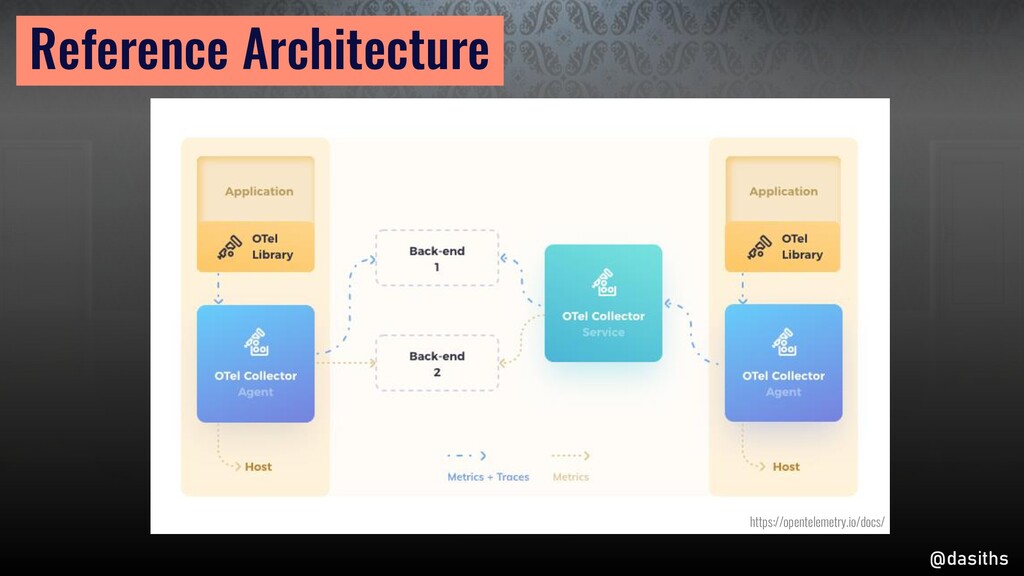
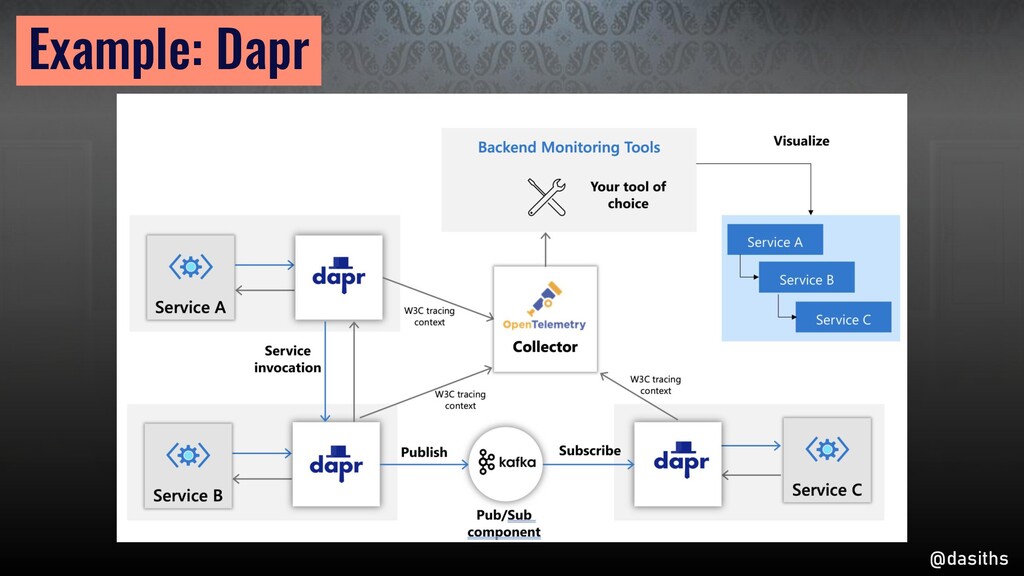
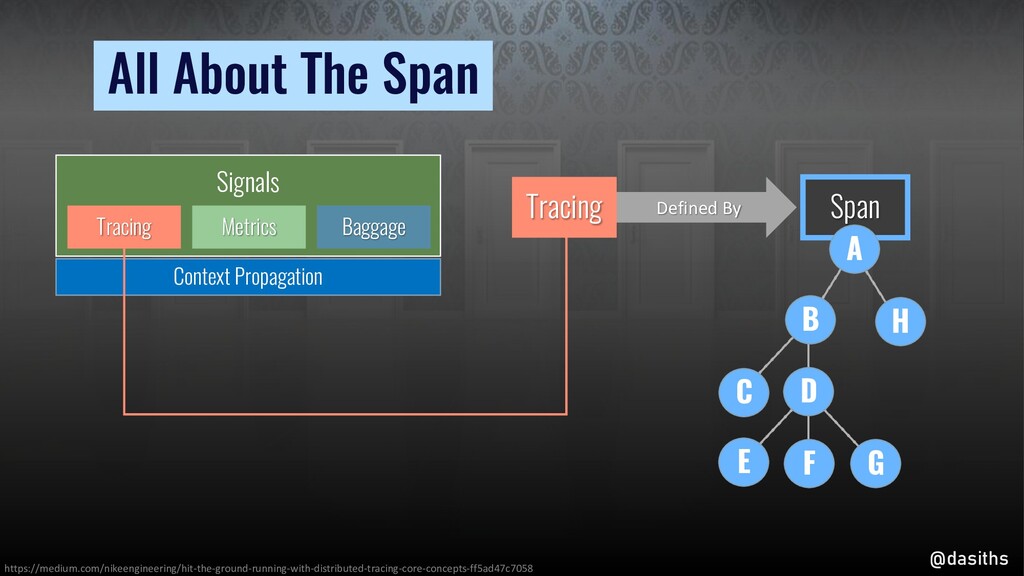
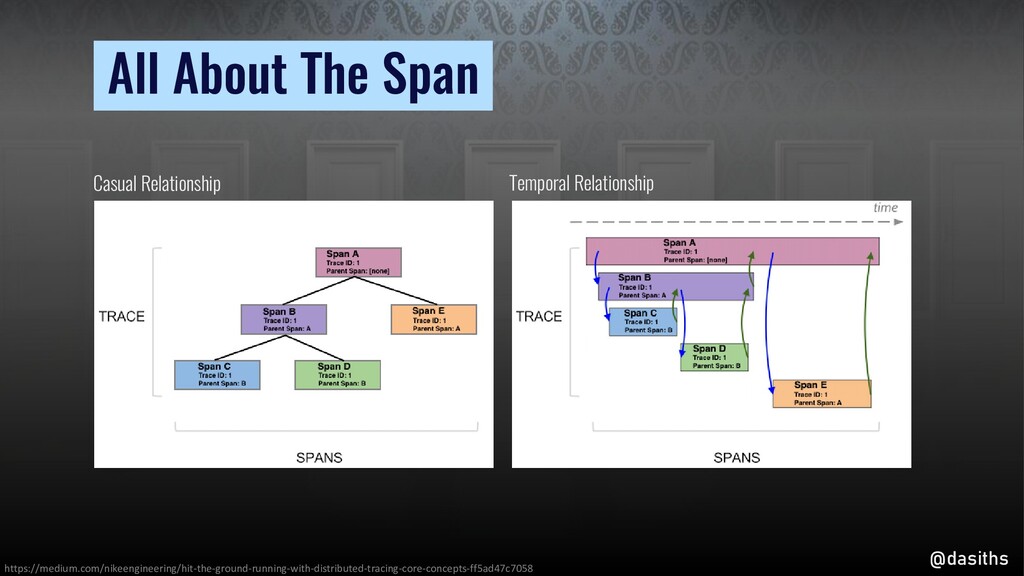
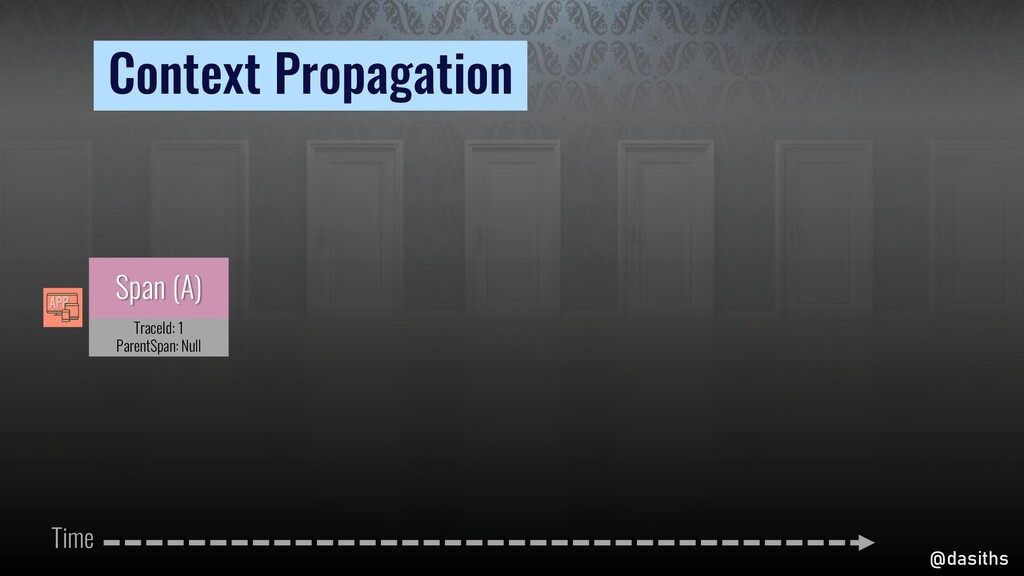
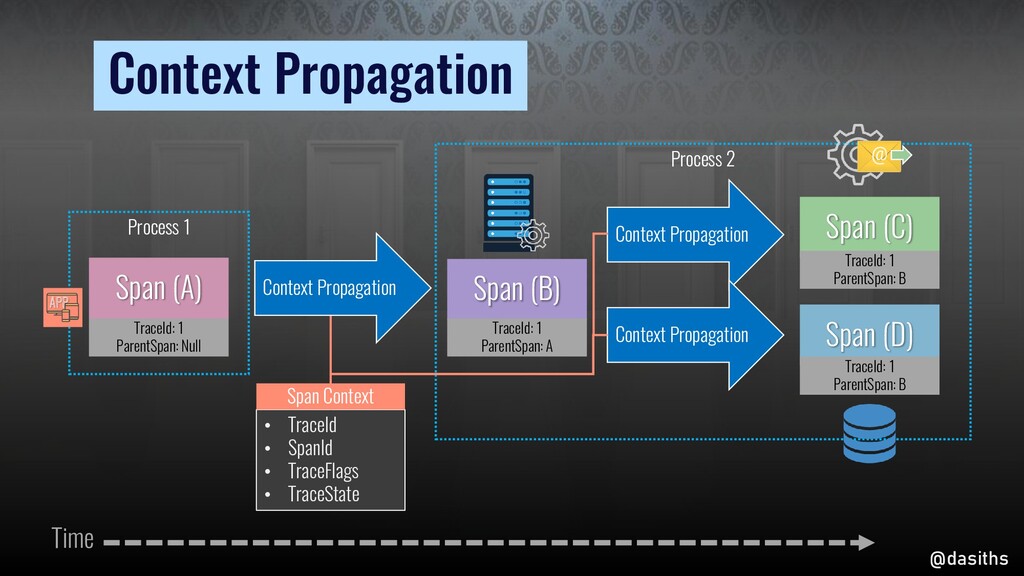
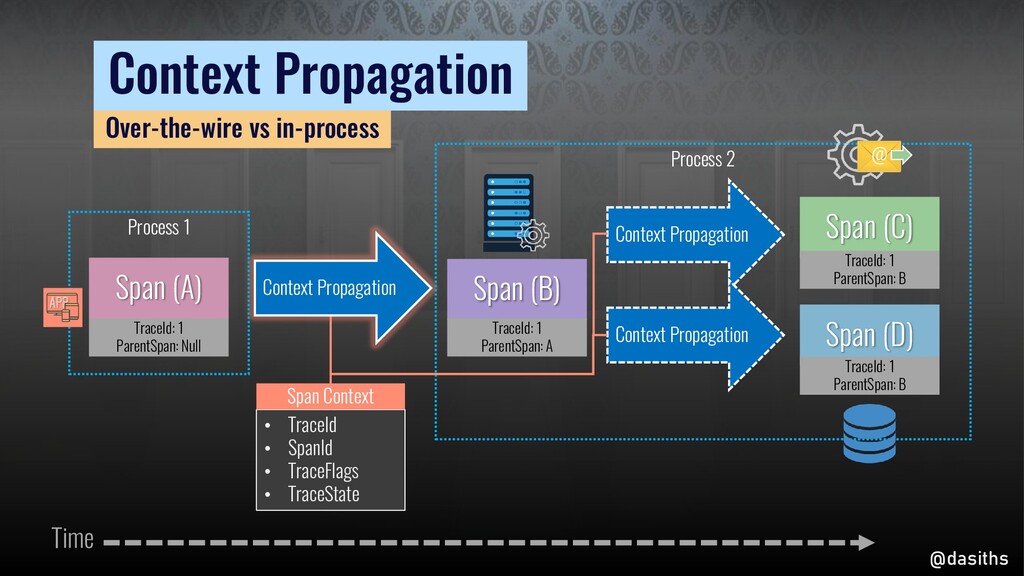
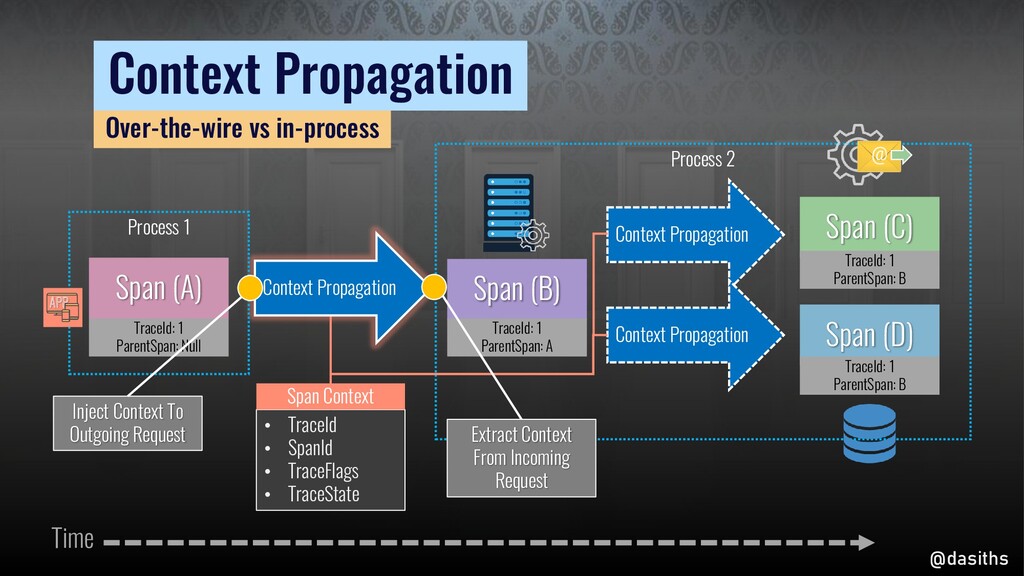
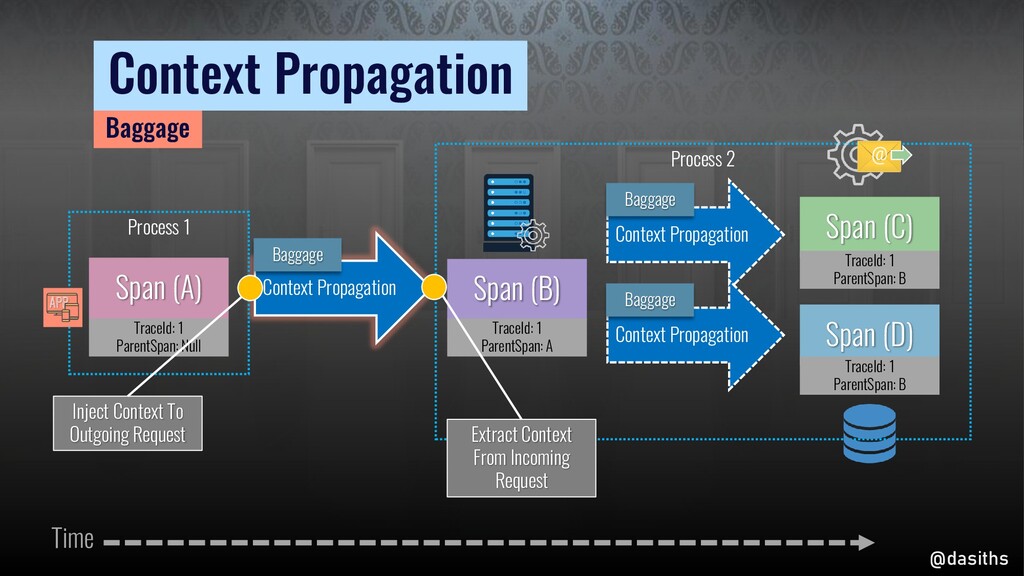
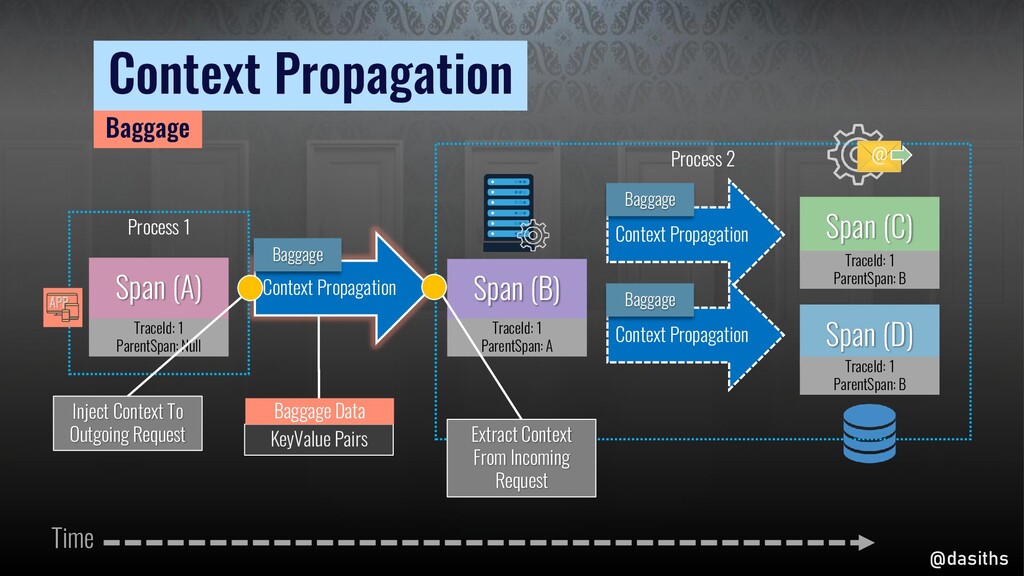
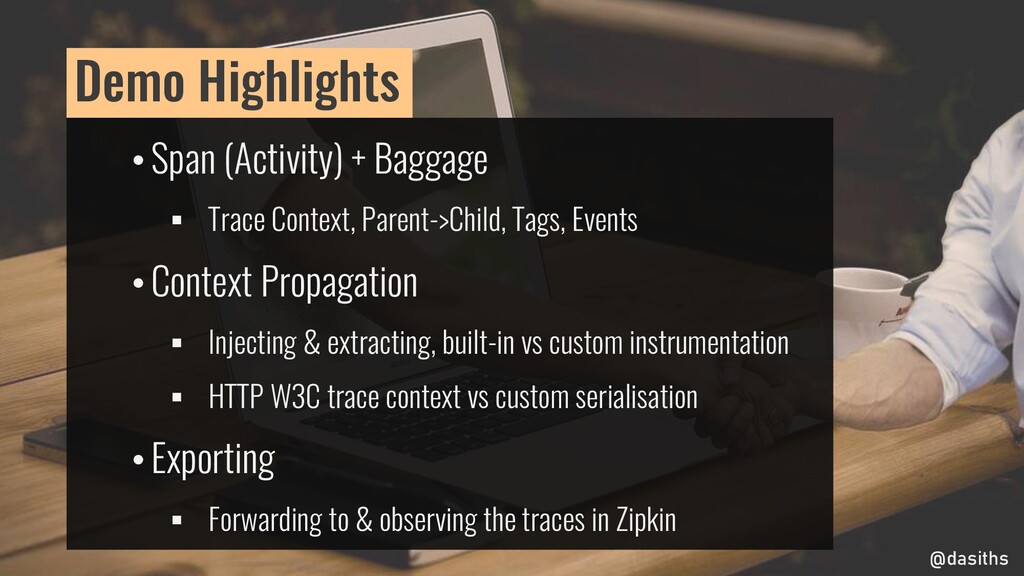
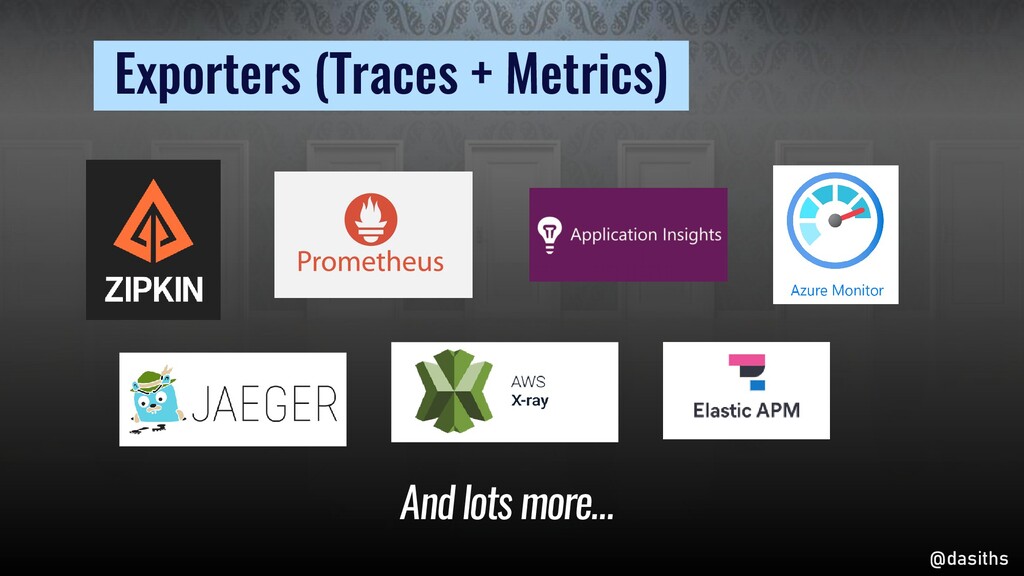
In this talk, I examine how to propagate your tracing context across process boundaries and visualize the flow of requests through your distributed services (Microservices/Serverless/Other) easily using tools like Zipkin and Jaeger. We will see how to use already instrumented libraries and also how to propagate the trace information yourself. At the end of this talk you will know how to easily trace and observe distributed components of the systems you build.

Dasith Wijesiriwardena

September 15, 2021
Tweet

More Decks by Dasith Wijesiriwardena

Other Decks in Programming

Transcript

  1. Tracing across your distributed process boundaries using 5th Oct 2021

    Dasith Wijesiriwardena @dasiths OpenTelemetry Melb .NET Meetup 15-16 Sep 2021
  2. I am here because I have a love hate relationship

    with distributed systems. HELLO! I AM Dasith @dasiths dasith.me
  3. Distributed tracing using OpenTelemetry Introduction to distributed tracing Agenda Demo

    using OpenTelemetry .NET SDK Introduction to OpenTelemetry @dasiths
  4. Distributed Tracing @dasiths Distributed tracing, also called distributed request tracing,

    is a method used to profile and monitor applications, especially those built using a microservices architecture. Distributed tracing helps pinpoint where failures occur and what causes poor performance. https://opentracing.io/docs/overview/what-is-tracing/
  5. @dasiths Example Distributed Tracing Middleware Backend Database Correlation_ID = ABC123

    Request API Gateway APP fields @timestamp, @message | filter @message like /some-unique-thing-for-the-request/ | sort @timestamp desc | limit 20
  6. @dasiths Example Distributed Tracing Middleware Backend Database Correlation_ID = ABC123

    Request API Gateway APP fields @timestamp, @message | filter @message like /some-unique-thing-for-the-request/ | sort @timestamp desc | limit 20
  7. • Runs natively on the cloud • Distributed (i.e. Microservices)

    • Managed by many teams •Broad set of languages and frameworks • Built on top of open source technologies Modern Software.. @dasiths
  8. @dasiths An observability framework for cloud-native software. OpenTelemetry is a

    collection of tools, APIs, and SDKs. You can use it to instrument, generate, collect, and export telemetry data (metrics, logs, and traces) for analysis in order to understand your software's performance and behavior. https://opentelemetry.io/
  9. @dasiths An observability framework for cloud-native software. OpenTelemetry is a

    collection of tools, APIs, and SDKs. You can use it to instrument, generate, collect, and export telemetry data (metrics, logs, and traces) for analysis in order to understand your software's performance and behavior. https://opentelemetry.io/
  10. OpenTelemetry Architecture @dasiths Signals Tracing Metrics Baggage Context Propagation Frameworks

    (.NET, Spring, etc) Applications (Your code) Clients (HTTP, DB, etc ) Tracing
  11. @dasiths Collectors and Exporters SDK SDK SDK SDK SDK Directly

    exporting traces using the SDK to the monitoring backend Apps instrumented using the OpenTelemetry SDK Monitoring backends with their own data protocols
  12. @dasiths Collectors and Exporters Using a Collector (agent) as a

    proxy to forward telemetry data Apps using the OpenTelemetry Collector (Agent) Monitoring backends with their own data protocols Standalone OpenTelemetry Collector
  13. @dasiths Context Propagation Span (A) Span (B) Time Context Propagation

    TraceId: 1 ParentSpan: Null TraceId: 1 ParentSpan: A APP
  14. @dasiths Context Propagation Context Propagation Span (C) Span (D) Context

    Propagation Span (A) Span (B) Time @ Context Propagation TraceId: 1 ParentSpan: Null TraceId: 1 ParentSpan: A TraceId: 1 ParentSpan: B TraceId: 1 ParentSpan: B APP
  15. @dasiths Context Propagation Context Propagation Span (C) Span (D) •

    TraceId • SpanId • TraceFlags • TraceState Context Propagation Span (A) Span (B) Span Context Time @ Context Propagation TraceId: 1 ParentSpan: Null TraceId: 1 ParentSpan: A TraceId: 1 ParentSpan: B TraceId: 1 ParentSpan: B APP
  16. @dasiths Context Propagation Context Propagation Span (C) Span (D) •

    TraceId • SpanId • TraceFlags • TraceState Context Propagation Span (A) Span (B) Span Context Time Process 2 Process 1 @ Context Propagation TraceId: 1 ParentSpan: Null TraceId: 1 ParentSpan: A TraceId: 1 ParentSpan: B TraceId: 1 ParentSpan: B APP
  17. Pr @dasiths Context Propagation Context Propagation Span (D) • TraceId

    • SpanId • TraceFlags • TraceState Context Propagation Span Context Span (C) Span (A) Span (B) Over-the-wire vs in-process Time Process 1 Process 2 @ Context Propagation TraceId: 1 ParentSpan: Null TraceId: 1 ParentSpan: A TraceId: 1 ParentSpan: B TraceId: 1 ParentSpan: B APP
  18. Pr @dasiths Context Propagation Context Propagation Span (D) • TraceId

    • SpanId • TraceFlags • TraceState Context Propagation Span Context Span (C) Span (A) Span (B) Inject Context To Outgoing Request Over-the-wire vs in-process Time Process 2 Process 1 @ Context Propagation TraceId: 1 ParentSpan: Null TraceId: 1 ParentSpan: A TraceId: 1 ParentSpan: B TraceId: 1 ParentSpan: B Extract Context From Incoming Request APP
  19. Pr @dasiths Context Propagation Context Propagation Span (D) Context Propagation

    Baggage Baggage Baggage Span (C) Span (A) Span (B) Baggage Time Process 1 Process 2 @ Context Propagation Inject Context To Outgoing Request Extract Context From Incoming Request TraceId: 1 ParentSpan: Null TraceId: 1 ParentSpan: A TraceId: 1 ParentSpan: B TraceId: 1 ParentSpan: B APP
  20. Pr @dasiths Context Propagation Context Propagation Span (D) Context Propagation

    Baggage Baggage Baggage Span (C) Span (A) Span (B) Time Process 1 Process 2 @ Inject Context To Outgoing Request Extract Context From Incoming Request KeyValue Pairs Baggage Data Baggage Context Propagation TraceId: 1 ParentSpan: Null TraceId: 1 ParentSpan: A TraceId: 1 ParentSpan: B TraceId: 1 ParentSpan: B APP
  21. • Span (Activity) + Baggage ▪ Trace Context, Parent->Child, Tags,

    Events • Context Propagation ▪ Injecting & extracting, built-in vs custom instrumentation ▪ HTTP W3C trace context vs custom serialisation • Exporting ▪ Forwarding to & observing the traces in Zipkin Demo Highlights @dasiths
  22. Start using OpenTelemetry today! Distributed tracing is essential for performance

    and reliability of modern cloud native software. It’s no longer a “nice to have”. @dasiths
  23. Presentation template designed by powerpointify.com Special thanks to all people

    who made and shared these awesome resources for free: CREDITS Photographs by unsplash.com Free Fonts used: https://www.fontsquirrel.com/fonts/oswald @dasiths