Upgrade to Pro — share decks privately, control downloads, hide ads and more …

DEMANDing Times

DEMANDing Times

Paper presented at the DEMAND Conference, 13th April 2016: Lancaster, UK

Abstract:

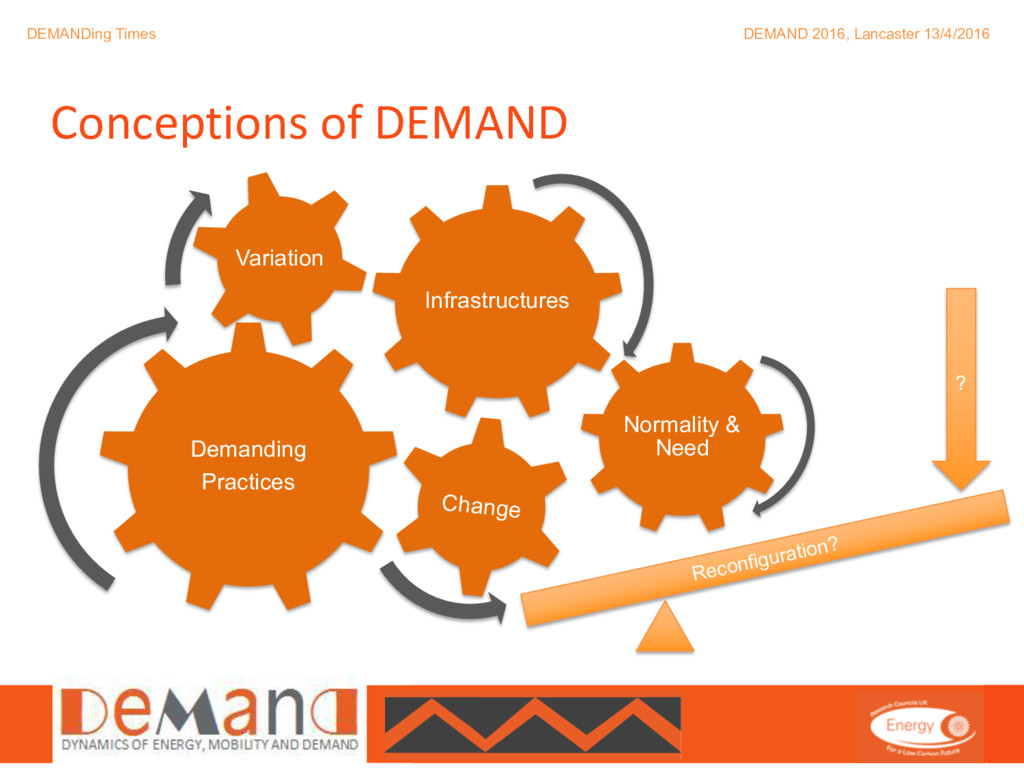
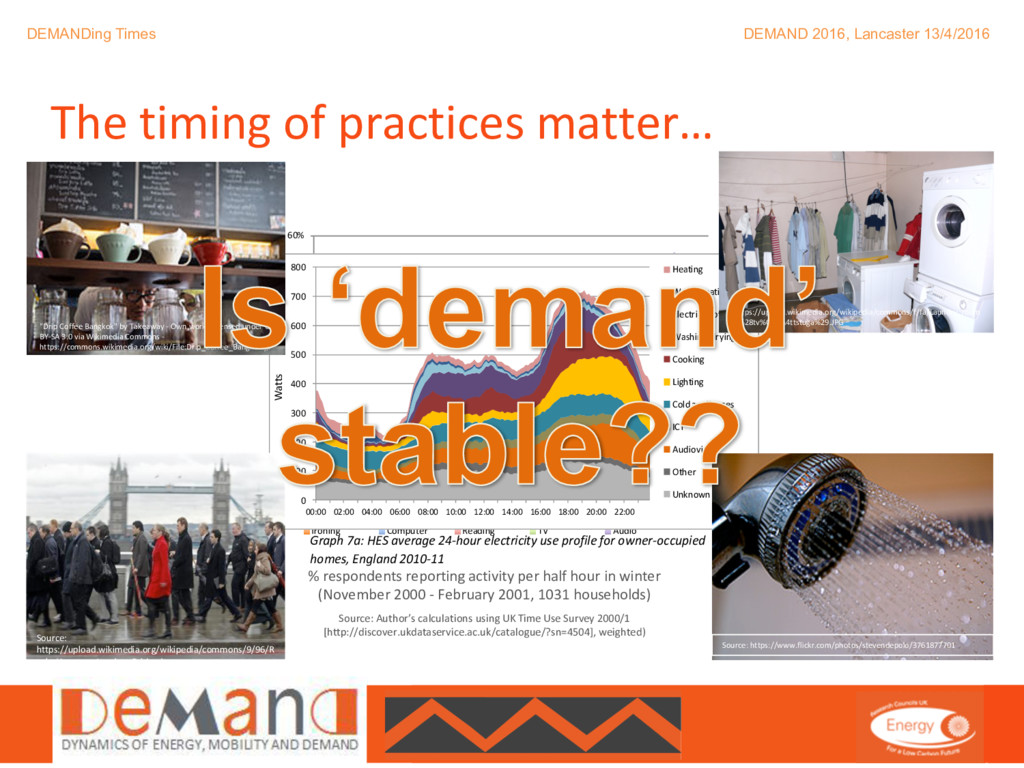
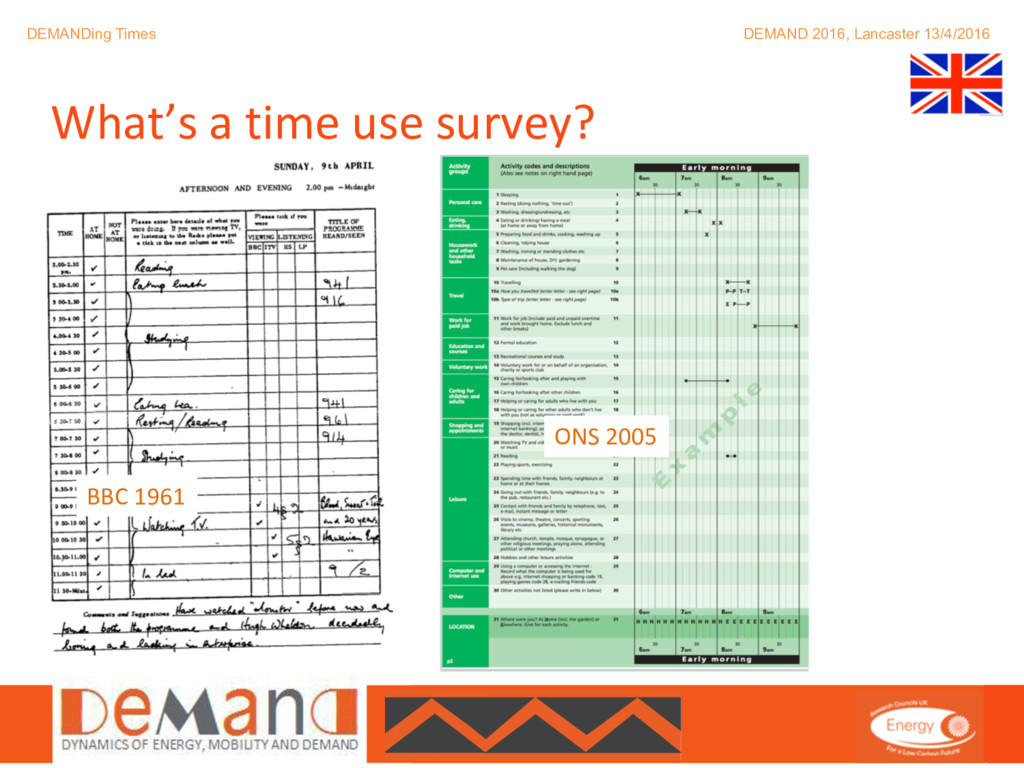
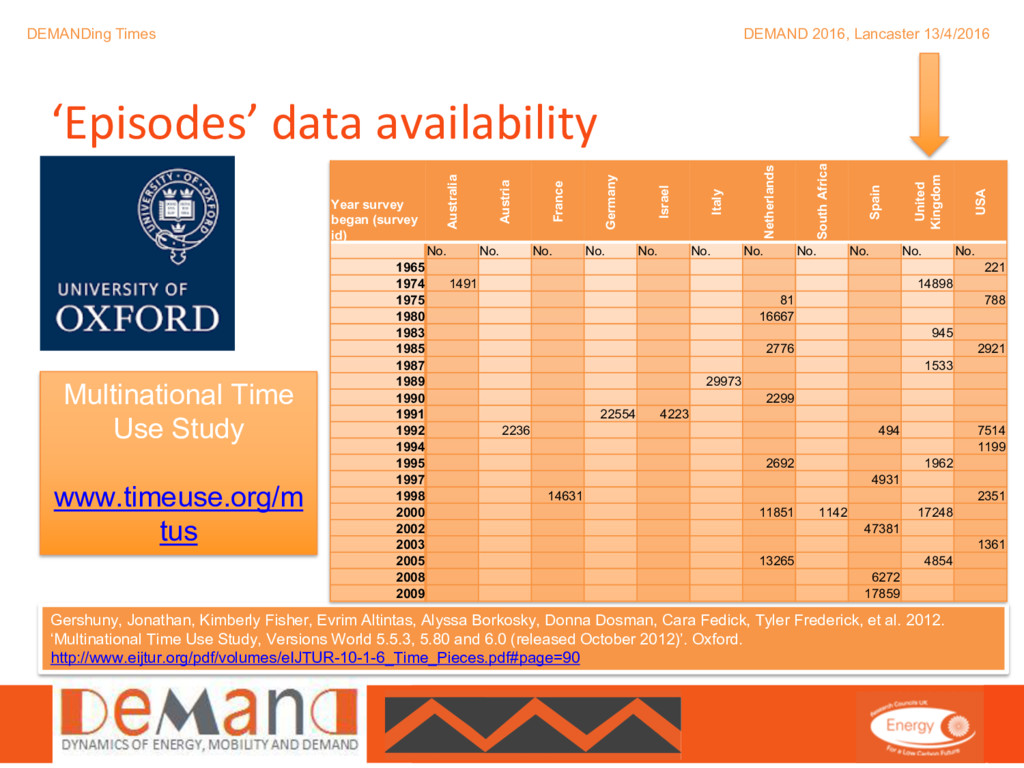
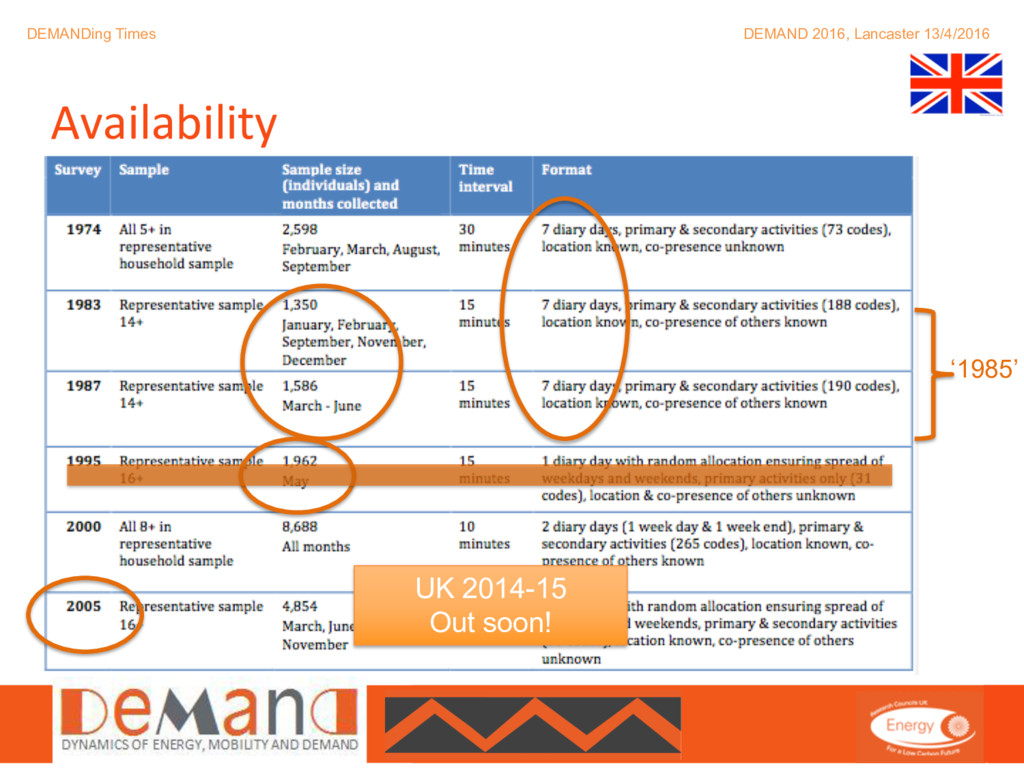
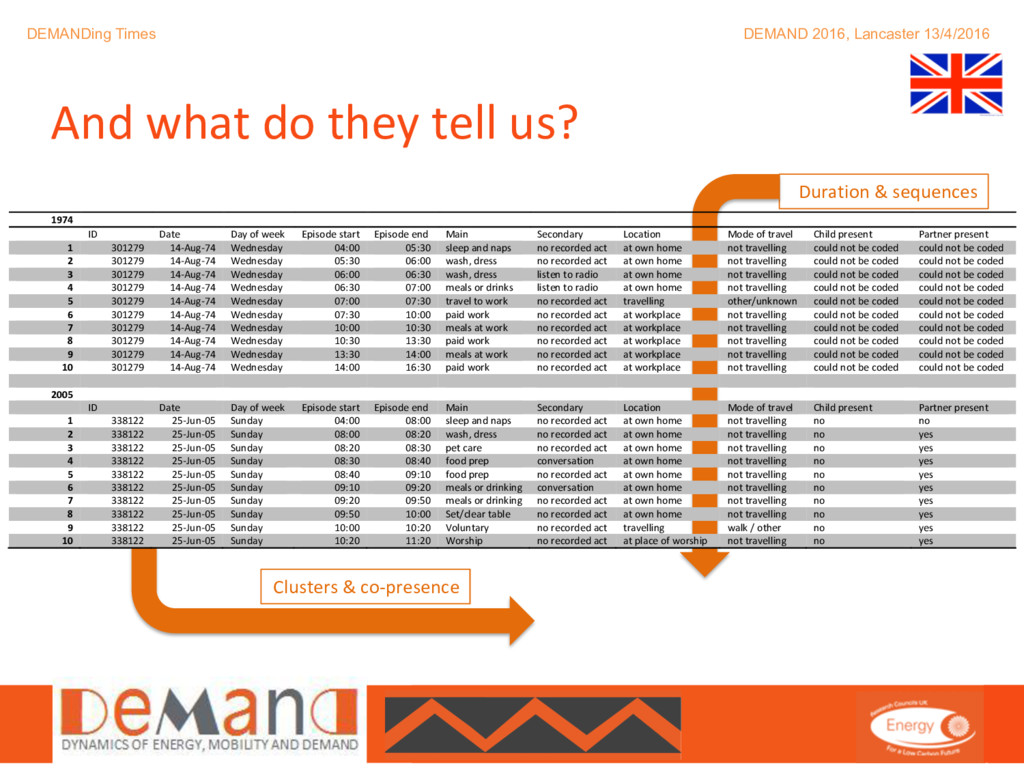
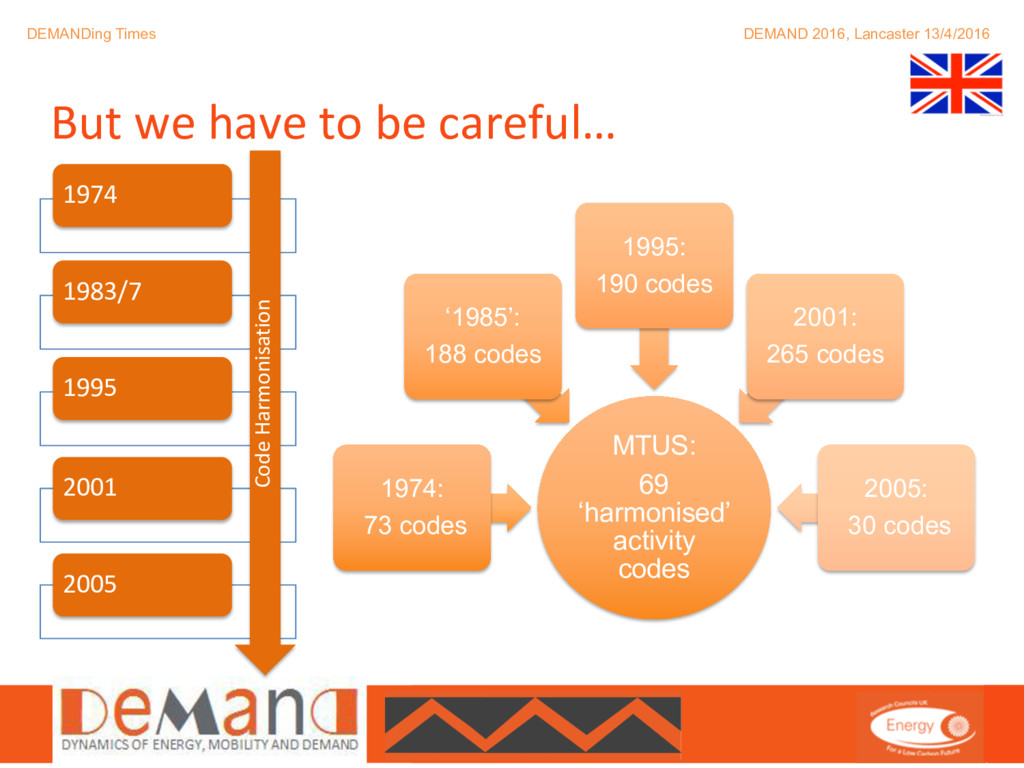
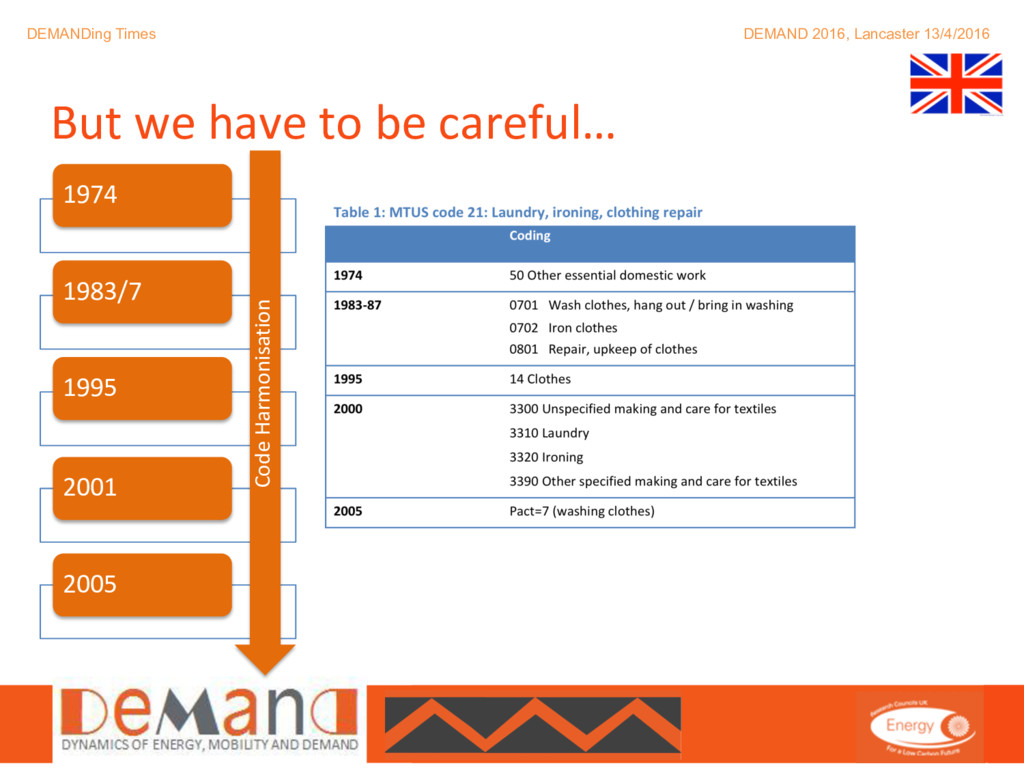
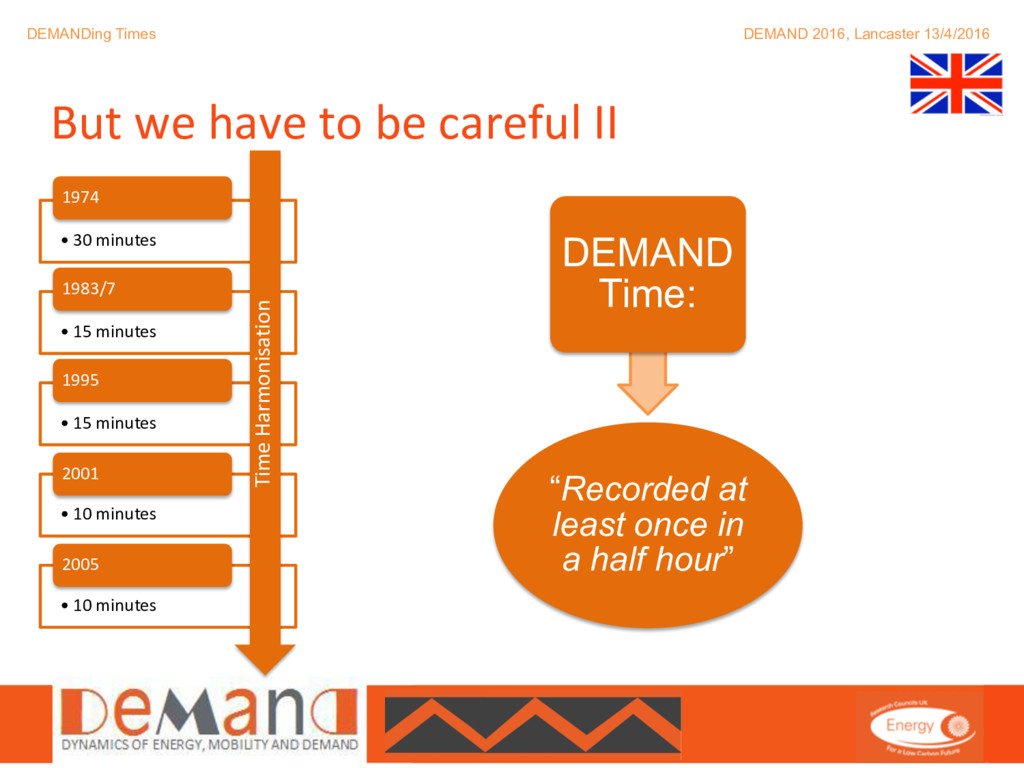
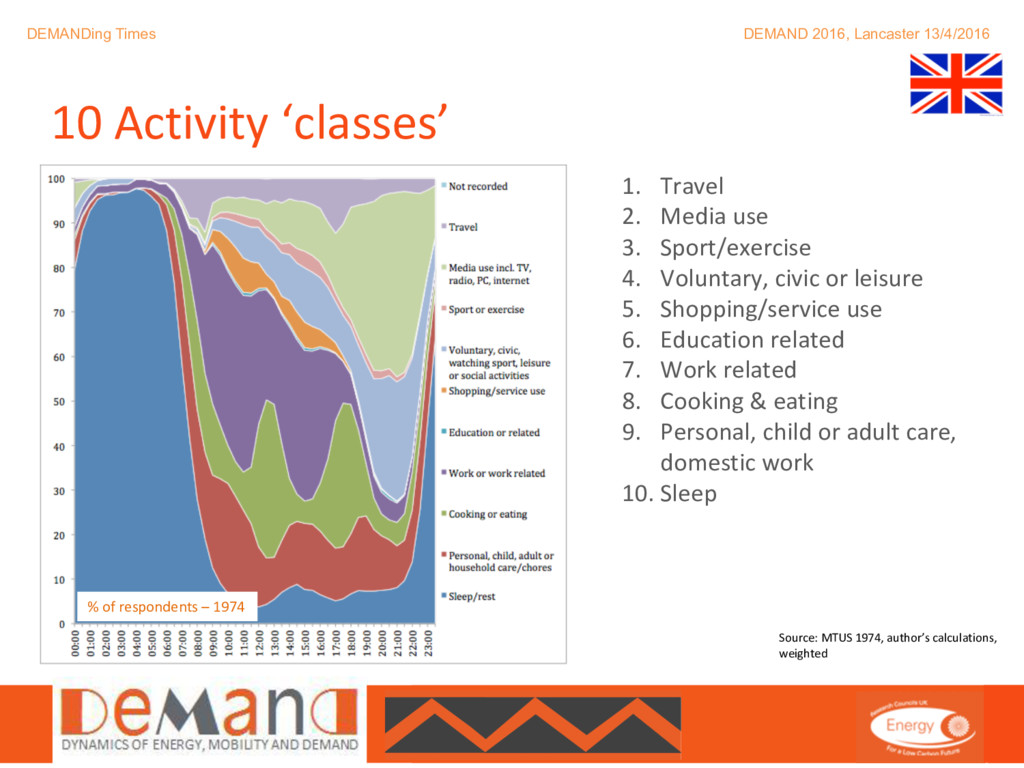
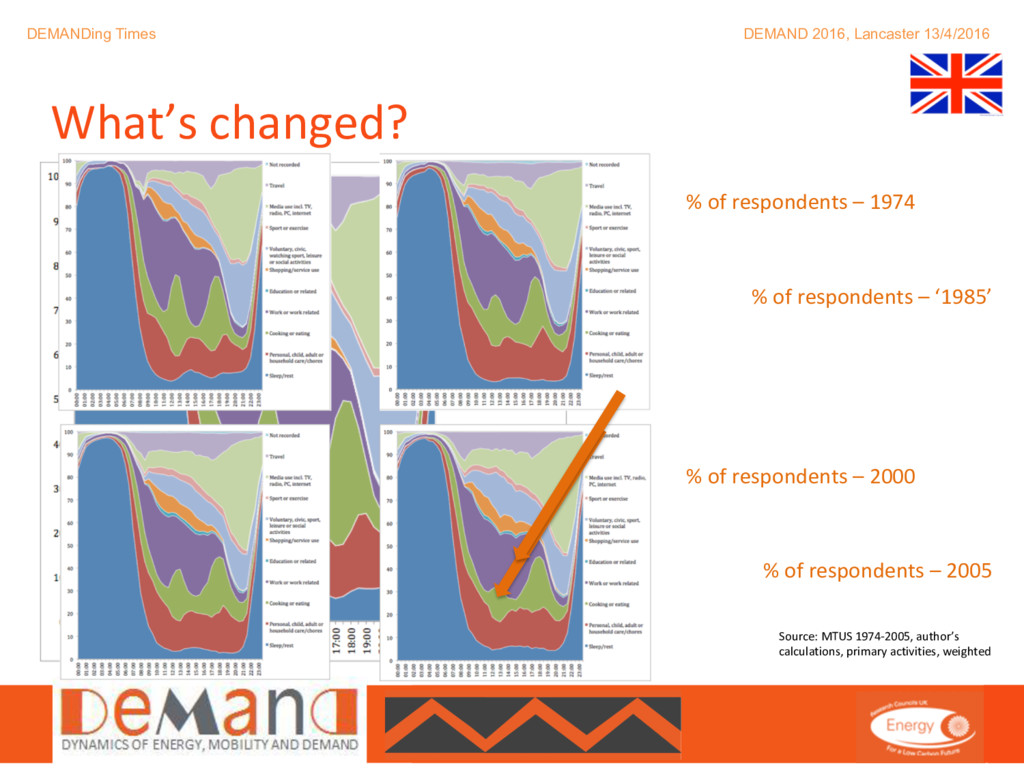
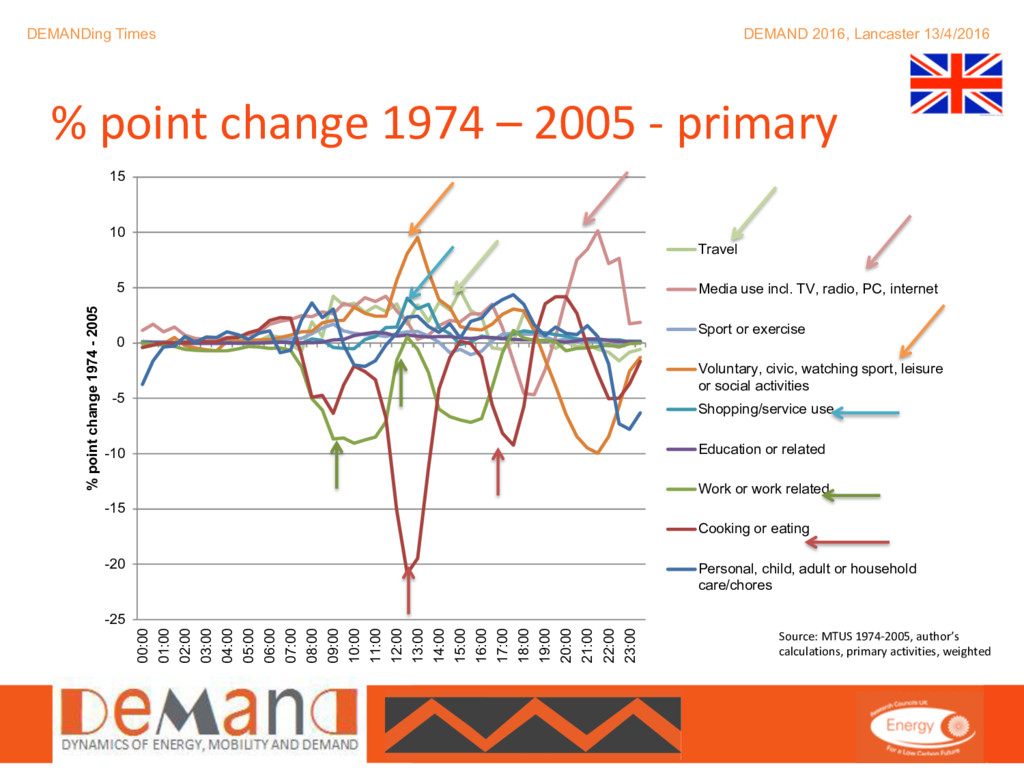
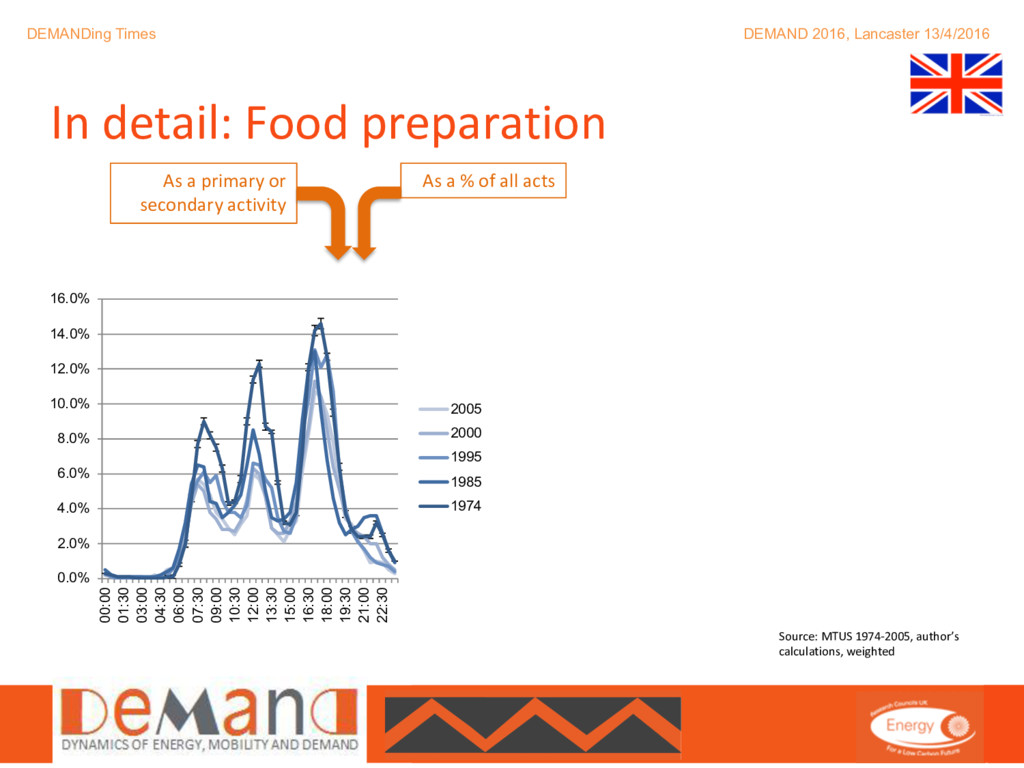
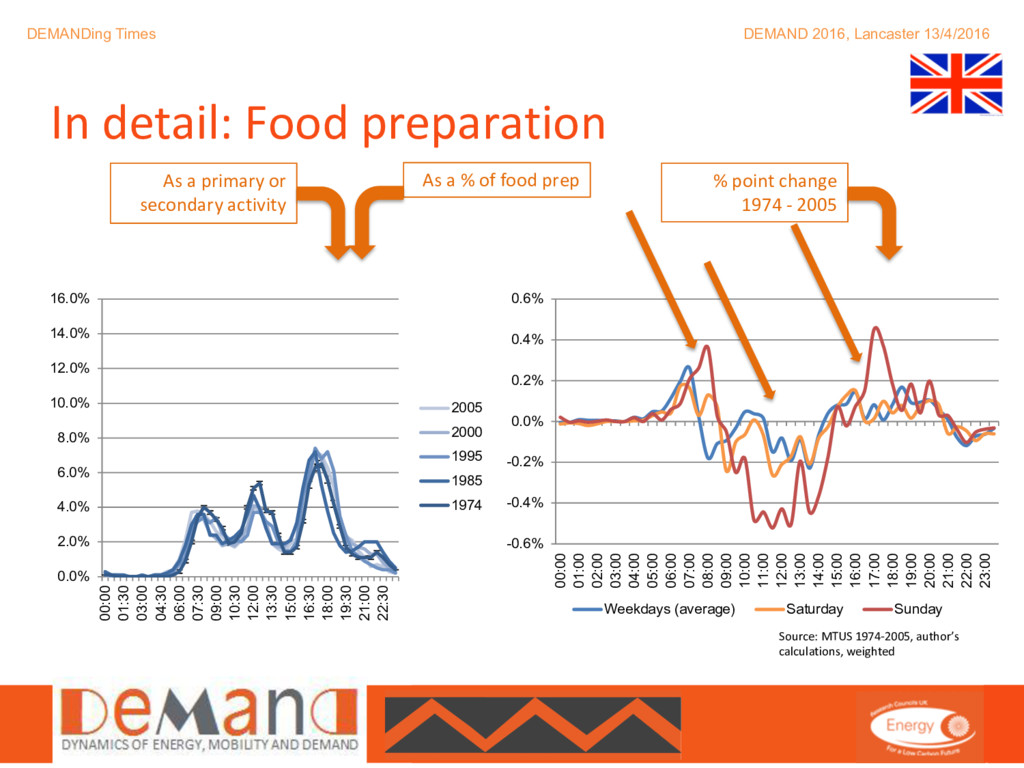
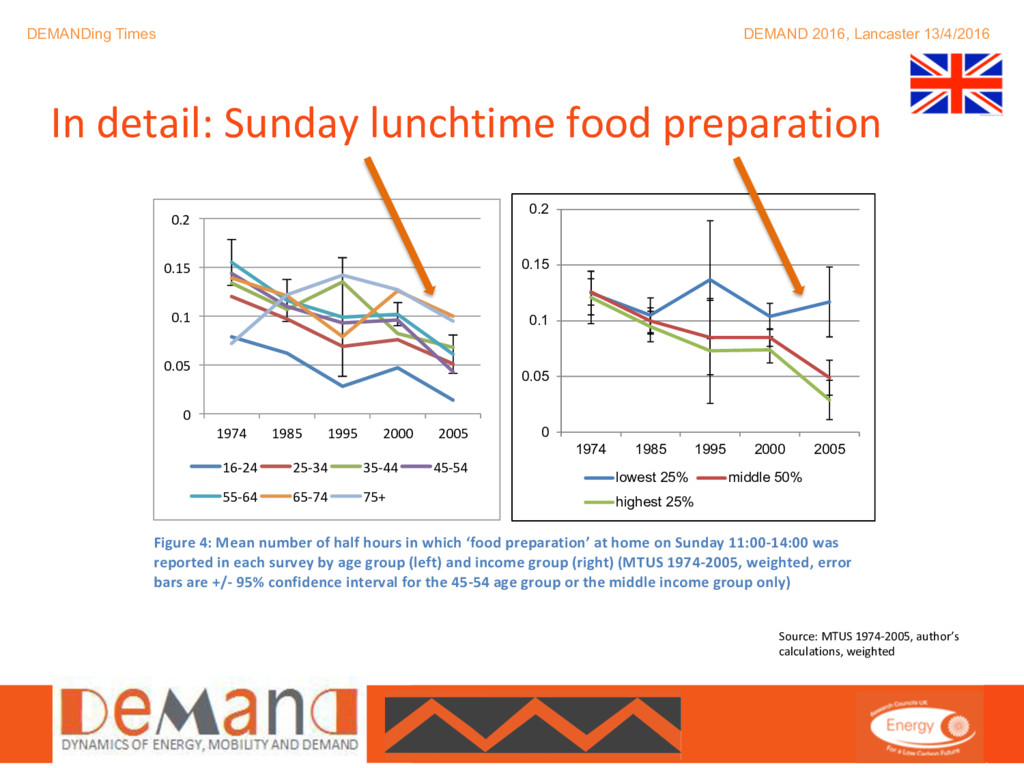
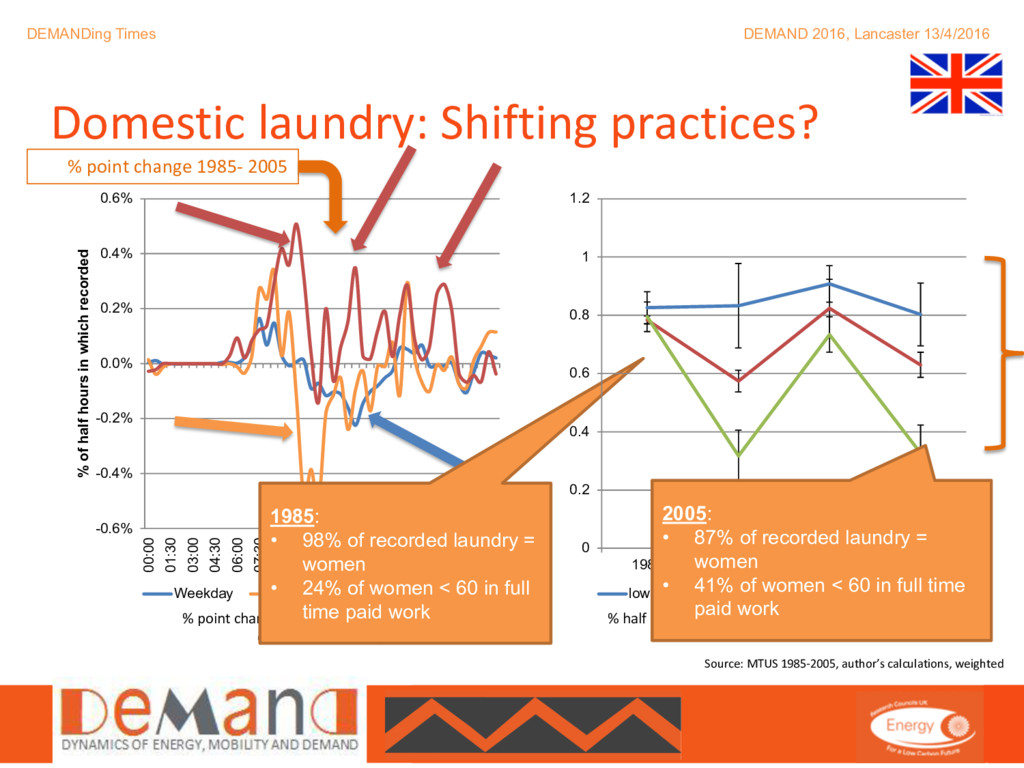
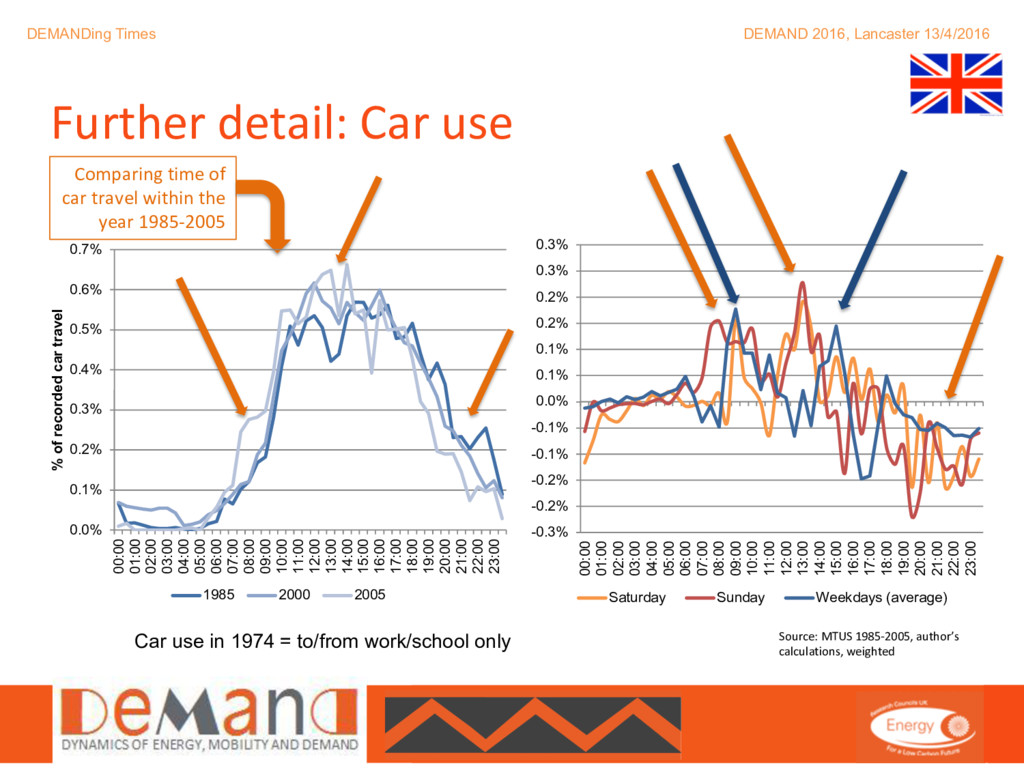
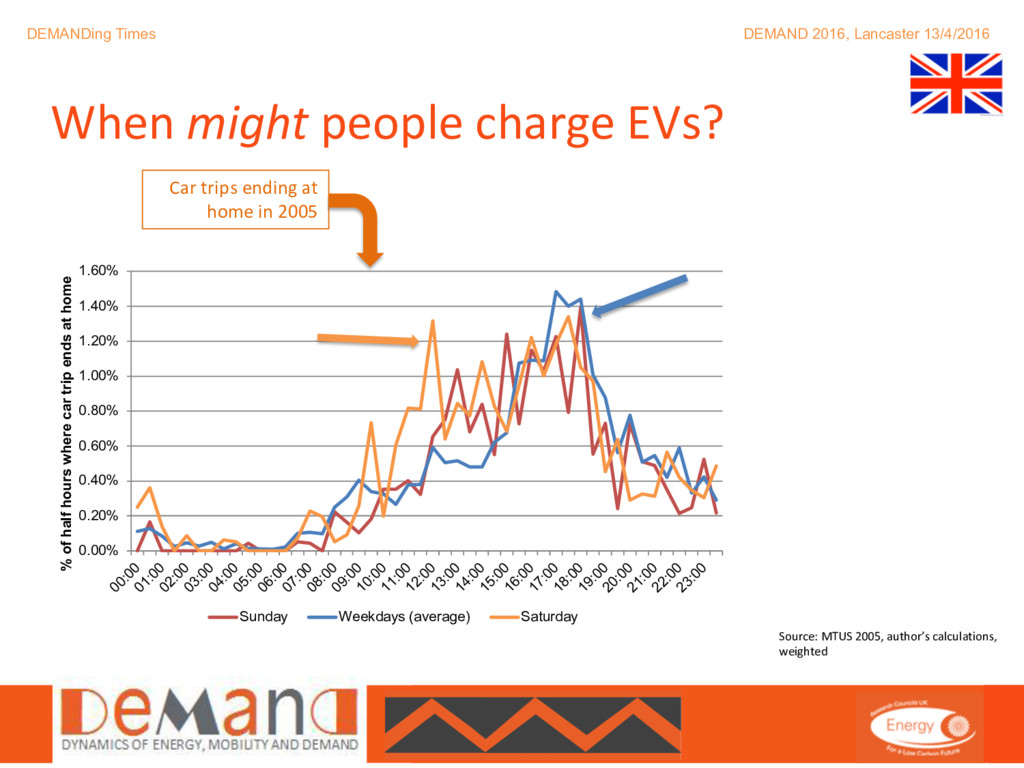
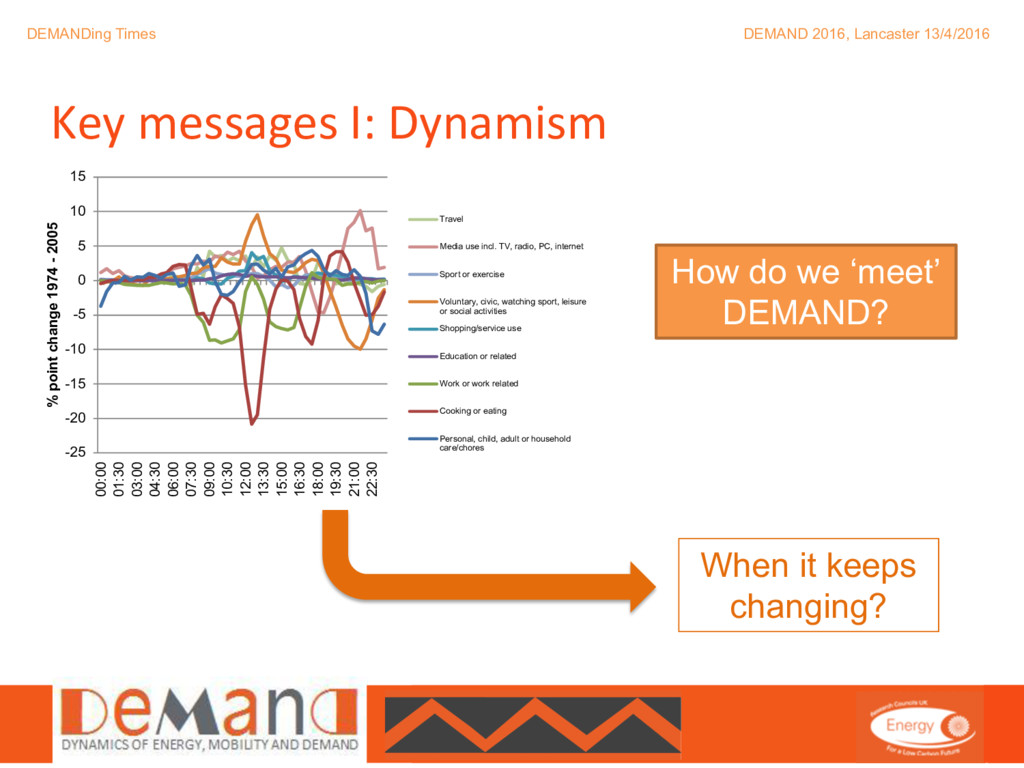
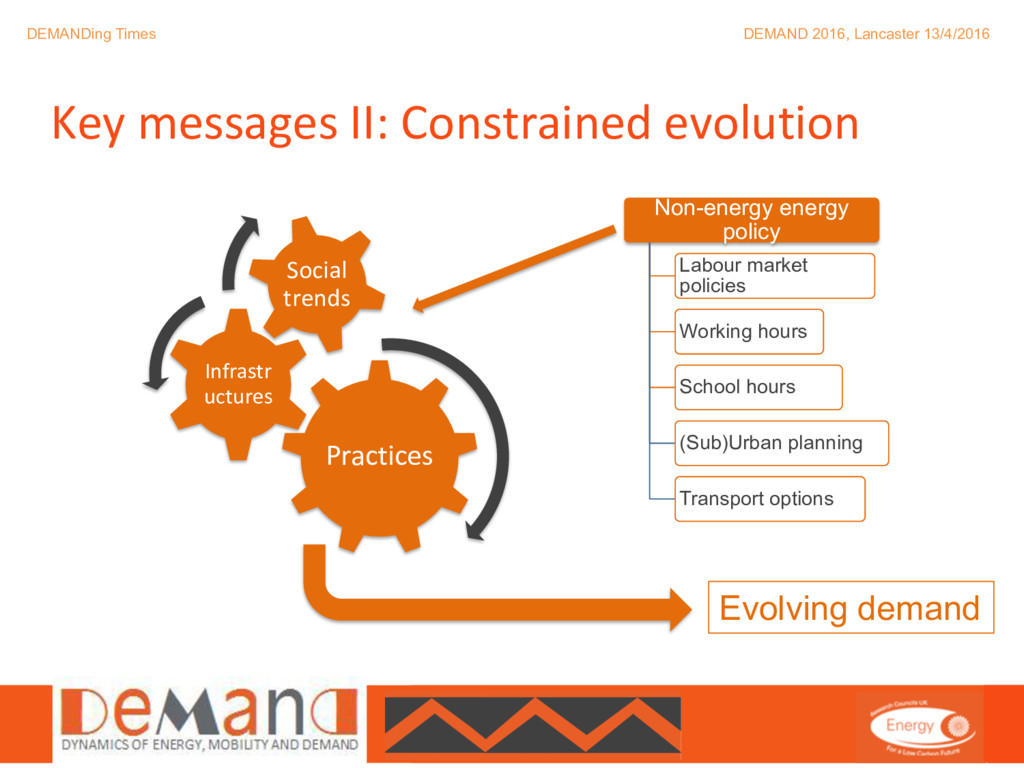
"This paper starts from the premise that energy demand emerges from the performance of interwoven social practices and that examining the changing temporal distribution of these performances may generate new insights into the way demand for energy has and will change in the United Kingdom (Shove and Walker 2014). The paper will outline the national time-use survey datasets from the 1960s to the present that have been made available by the Multinational Time Use Study (Gershuny et al. 2012) and will describe the harmonisation process that has been used by the MTUS team to attempt to support both cross-national and temporal comparative analysis. The paper will then uses this harmonised data to present analysis of the changing distribution of a range of 'Activity Classes'. These harmonised 'classes' enable analysis of overall trends in the timing of (proxies for) 'groupings' of social practices over the last 30 years in the UK. By decomposing these classes into their constituent 'time use activities' the paper will then present analysis of trends in the timing of specific energy demanding practices (or their proxies), and indeed of practices that have come to demand energy. In so doing the paper will highlight the evolving configuration of energy demanding practices across a range of social dimensions in direct contrast to the apparent UK policy presumption of static (and immutable) demand. The paper will present largely descriptive analysis of the changing nature of laundry, of cooking and eating and of car use and will highlight how changing configurations of, especially, labour market constraints and participation are revealed. The paper will then outline an example of the way in which time-use diary data can be used to explore potential near future scenarios by adapting the analysis of car use to the need to anticipate additional power network loading as a result of electric vehicle charging at the population level. The paper will conclude by summarising the way in which time-use data can be used to highlight the significance of 'non-energy energy' policies and it's potential value in tracking the evolution of energy demand practices."

Full paper: http://www.demand.ac.uk/demand-conference-2016-papers/#time

Ben Anderson

April 13, 2016
Tweet

More Decks by Ben Anderson

Other Decks in Science

Transcript

  1. @DEMAND_CENTRE DEMANDing Times DEMAND 2016, Lancaster 13/4/2016 Ben Anderson @dataknut

    Energy & Climate Change Division Faculty of Environment & Engineering University of Southampton DEMANDing Times
  2. @DEMAND_CENTRE DEMANDing Times DEMAND 2016, Lancaster 13/4/2016 1. Conceptions of

    DEMAND 2. Researching DEMAND using time use data 3. Activity classes: overall trends 4. Selected Activities: detailed trends 5. Concluding thoughts Today’s menu
  3. @DEMAND_CENTRE DEMANDing Times DEMAND 2016, Lancaster 13/4/2016 1. Conceptions of

    DEMAND 2. Researching DEMAND using time use data 3. Activity classes: overall trends 4. Selected Activities: detailed trends 5. Concluding thoughts Today’s menu
  4. @DEMAND_CENTRE DEMANDing Times DEMAND 2016, Lancaster 13/4/2016 Conceptions of DEMAND

    Demanding Practices Change Variation Normality & Need Reconfiguration? ? Infrastructures
  5. @DEMAND_CENTRE DEMANDing Times DEMAND 2016, Lancaster 13/4/2016 The timing of

    practices matter… % respondents reporting activity per half hour in winter (November 2000 - February 2001, 1031 households) Source: Author’s calculations using UK Time Use Survey 2000/1 [http://discover.ukdataservice.ac.uk/catalogue/?sn=4504], weighted) 0% 10% 20% 30% 40% 50% 60% 00:00 01:00 02:00 03:00 04:00 05:00 06:00 07:00 08:00 09:00 10:00 11:00 12:00 13:00 14:00 15:00 16:00 17:00 18:00 19:00 20:00 21:00 22:00 23:00 % respondents Wash/dress self Cooking Dish washing Cleaning Laundry Ironing Computer Reading TV Audio UK Housing Energy Fact File Graph 7a: HES average 24-hour electricity use profile for owner-occupied homes, England 2010-11 Gas consumption The amount of gas consumed in the UK varies dramatically between households. The top 10% of households consume at least four times as much gas as the bottom 10%.60 Modelling  to  predict  households’  energy   consumption – based on the property, household income and tenure – has so far been able to explain less than 40% of this variation. Gas use varies enormously from household to household, and the variation has more to do with behaviour than how dwellings are built. 0 100 200 300 400 500 600 700 800 00:00 02:00 04:00 06:00 08:00 10:00 12:00 14:00 16:00 18:00 20:00 22:00 Heating Water heating Electric showers Washing/drying Cooking Lighting Cold appliances ICT Audiovisual Other Unknown Watts Source: https://www.flickr.com/photos/stevendepolo/3761877701 Source: https://upload.wikimedia.org/wikipedia/commons/9/96/R ush_Hour_on_London_Bridge.jpg "Drip Coffee Bangkok" by Takeaway - Own work. Licensed under CC BY-SA 3.0 via Wikimedia Commons - https://commons.wikimedia.org/wiki/File:Drip_Coffee_Bangkok.jp g https://upload.wikimedia.org/wikipedia/commons/f/fa/Laundry_room _%28tv%C3%A4ttstuga%29.JPG
  6. @DEMAND_CENTRE DEMANDing Times DEMAND 2016, Lancaster 13/4/2016 1. Conceptions of

    DEMAND 2. Researching DEMAND using time use data 3. Activity classes: overall trends 4. Selected Activities: detailed trends 5. Concluding thoughts Today’s menu
  7. @DEMAND_CENTRE DEMANDing Times DEMAND 2016, Lancaster 13/4/2016 ‘Episodes’ data availability

    Multinational Time Use Study www.timeuse.org/m tus Gershuny, Jonathan, Kimberly Fisher, Evrim Altintas, Alyssa Borkosky, Donna Dosman, Cara Fedick, Tyler Frederick, et al. 2012. ‘Multinational Time Use Study, Versions World 5.5.3, 5.80 and 6.0 (released October 2012)’. Oxford. http://www.eijtur.org/pdf/volumes/eIJTUR-10-1-6_Time_Pieces.pdf#page=90 Year survey began (survey id) Australia Austria France Germany Israel Italy Netherlands South Africa Spain United Kingdom USA No. No. No. No. No. No. No. No. No. No. No. 1965 221 1974 1491 14898 1975 81 788 1980 16667 1983 945 1985 2776 2921 1987 1533 1989 29973 1990 2299 1991 22554 4223 1992 2236 494 7514 1994 1199 1995 2692 1962 1997 4931 1998 14631 2351 2000 11851 1142 17248 2002 47381 2003 1361 2005 13265 4854 2008 6272 2009 17859
  8. @DEMAND_CENTRE DEMANDing Times DEMAND 2016, Lancaster 13/4/2016 And what do

    they tell us? Duration & sequences Clusters & co-presence Anderson, B (2016) DEMANDing Times, Paper prepared for DEMAND Centre Conference, Lancaster, 13-15 April 2016 Table 2: Example time-use data (MTUS, 1974 and 2000 samples) 1974 ID Date Day of week Episode start Episode end Main Secondary Location Mode of travel Child present Partner present 1 301279 14-Aug-74 Wednesday 04:00 05:30 sleep and naps no recorded act at own home not travelling could not be coded could not be coded 2 301279 14-Aug-74 Wednesday 05:30 06:00 wash, dress no recorded act at own home not travelling could not be coded could not be coded 3 301279 14-Aug-74 Wednesday 06:00 06:30 wash, dress listen to radio at own home not travelling could not be coded could not be coded 4 301279 14-Aug-74 Wednesday 06:30 07:00 meals or drinks listen to radio at own home not travelling could not be coded could not be coded 5 301279 14-Aug-74 Wednesday 07:00 07:30 travel to work no recorded act travelling other/unknown could not be coded could not be coded 6 301279 14-Aug-74 Wednesday 07:30 10:00 paid work no recorded act at workplace not travelling could not be coded could not be coded 7 301279 14-Aug-74 Wednesday 10:00 10:30 meals at work no recorded act at workplace not travelling could not be coded could not be coded 8 301279 14-Aug-74 Wednesday 10:30 13:30 paid work no recorded act at workplace not travelling could not be coded could not be coded 9 301279 14-Aug-74 Wednesday 13:30 14:00 meals at work no recorded act at workplace not travelling could not be coded could not be coded 10 301279 14-Aug-74 Wednesday 14:00 16:30 paid work no recorded act at workplace not travelling could not be coded could not be coded 2005 ID Date Day of week Episode start Episode end Main Secondary Location Mode of travel Child present Partner present 1 338122 25-Jun-05 Sunday 04:00 08:00 sleep and naps no recorded act at own home not travelling no no 2 338122 25-Jun-05 Sunday 08:00 08:20 wash, dress no recorded act at own home not travelling no yes 3 338122 25-Jun-05 Sunday 08:20 08:30 pet care no recorded act at own home not travelling no yes 4 338122 25-Jun-05 Sunday 08:30 08:40 food prep conversation at own home not travelling no yes 5 338122 25-Jun-05 Sunday 08:40 09:10 food prep no recorded act at own home not travelling no yes 6 338122 25-Jun-05 Sunday 09:10 09:20 meals or drinking conversation at own home not travelling no yes 7 338122 25-Jun-05 Sunday 09:20 09:50 meals or drinking no recorded act at own home not travelling no yes 8 338122 25-Jun-05 Sunday 09:50 10:00 Set/clear table no recorded act at own home not travelling no yes 9 338122 25-Jun-05 Sunday 10:00 10:20 Voluntary no recorded act travelling walk / other no yes 10 338122 25-Jun-05 Sunday 10:20 11:20 Worship no recorded act at place of worship not travelling no yes
  9. @DEMAND_CENTRE DEMANDing Times DEMAND 2016, Lancaster 13/4/2016 But we have

    to be careful… 1974 1983/7 1995 2001 2005 Code Harmonisation MTUS: 69 ‘harmonised’ activity codes 1974: 73 codes ‘1985’: 188 codes 1995: 190 codes 2001: 265 codes 2005: 30 codes
  10. @DEMAND_CENTRE DEMANDing Times DEMAND 2016, Lancaster 13/4/2016 But we have

    to be careful… 1974 1983/7 1995 2001 2005 Code Harmonisation
  11. @DEMAND_CENTRE DEMANDing Times DEMAND 2016, Lancaster 13/4/2016 But we have

    to be careful II • 30 minutes 1974 • 15 minutes 1983/7 • 15 minutes 1995 • 10 minutes 2001 • 10 minutes 2005 Time Harmonisation “Recorded at least once in a half hour” DEMAND Time:
  12. @DEMAND_CENTRE DEMANDing Times DEMAND 2016, Lancaster 13/4/2016 1. Conceptions of

    DEMAND 2. Researching DEMAND using time use data 3. Activity classes: overall trends 4. Selected Activities: detailed trends 5. Concluding thoughts Today’s menu
  13. @DEMAND_CENTRE DEMANDing Times DEMAND 2016, Lancaster 13/4/2016 10 Activity ‘classes’

    1. Travel 2. Media use 3. Sport/exercise 4. Voluntary, civic or leisure 5. Shopping/service use 6. Education related 7. Work related 8. Cooking & eating 9. Personal, child or adult care, domestic work 10. Sleep % of respondents – 1974 Source: MTUS 1974, author’s calculations, weighted
  14. @DEMAND_CENTRE DEMANDing Times DEMAND 2016, Lancaster 13/4/2016 What’s changed? %

    of respondents – 1974 % of respondents – ‘1985’ % of respondents – 2000 % of respondents – 2005 Source: MTUS 1974-2005, author’s calculations, primary activities, weighted
  15. @DEMAND_CENTRE DEMANDing Times DEMAND 2016, Lancaster 13/4/2016 % point change

    1974 – 2005 - primary -25 -20 -15 -10 -5 0 5 10 15 00:00 01:00 02:00 03:00 04:00 05:00 06:00 07:00 08:00 09:00 10:00 11:00 12:00 13:00 14:00 15:00 16:00 17:00 18:00 19:00 20:00 21:00 22:00 23:00 % point change 1974 - 2005 Travel Media use incl. TV, radio, PC, internet Sport or exercise Voluntary, civic, watching sport, leisure or social activities Shopping/service use Education or related Work or work related Cooking or eating Personal, child, adult or household care/chores Source: MTUS 1974-2005, author’s calculations, primary activities, weighted
  16. @DEMAND_CENTRE DEMANDing Times DEMAND 2016, Lancaster 13/4/2016 1. Conceptions of

    DEMAND 2. Researching DEMAND using time use data 3. Activity classes: overall trends 4. Selected Activities: detailed trends 5. Concluding thoughts Today’s menu
  17. @DEMAND_CENTRE DEMANDing Times DEMAND 2016, Lancaster 13/4/2016 0.0% 2.0% 4.0%

    6.0% 8.0% 10.0% 12.0% 14.0% 16.0% 00:00 01:30 03:00 04:30 06:00 07:30 09:00 10:30 12:00 13:30 15:00 16:30 18:00 19:30 21:00 22:30 2005 2000 1995 1985 1974 In detail: Food preparation Source: MTUS 1974-2005, author’s calculations, weighted As a primary or secondary activity As a % of all acts
  18. @DEMAND_CENTRE DEMANDing Times DEMAND 2016, Lancaster 13/4/2016 0.0% 2.0% 4.0%

    6.0% 8.0% 10.0% 12.0% 14.0% 16.0% 00:00 01:30 03:00 04:30 06:00 07:30 09:00 10:30 12:00 13:30 15:00 16:30 18:00 19:30 21:00 22:30 2005 2000 1995 1985 1974 In detail: Food preparation Source: MTUS 1974-2005, author’s calculations, weighted As a primary or secondary activity As a % of food prep -0.6% -0.4% -0.2% 0.0% 0.2% 0.4% 0.6% 00:00 01:00 02:00 03:00 04:00 05:00 06:00 07:00 08:00 09:00 10:00 11:00 12:00 13:00 14:00 15:00 16:00 17:00 18:00 19:00 20:00 21:00 22:00 23:00 Weekdays (average) Saturday Sunday % point change 1974 - 2005
  19. @DEMAND_CENTRE DEMANDing Times DEMAND 2016, Lancaster 13/4/2016 In detail: Sunday

    lunchtime food preparation Source: MTUS 1974-2005, author’s calculations, weighted Page 10 of 17 (MTUS 1974-2005, weighted) Further analysis focusing on ‘Sunday lunch’ (food preparation 11:00 – 14:00 on a Sunday) suggests that preparing ‘Sunday lunch’ has declined for most age groups and especially for those aged under 64 (Figure 4). Preparing Sunday lunch has also markedly declined for the middle and highest income groups but less so for the lowest income group who are also more likely to be over retirement age. This does not imply, of course, that less eating is done on Sunday – just that some of it, particularly for higher income groups, may now be done outside the home or later in the day (c.f. Figure 3 and also (Cheng et al. 2007)). Figure 4: Mean number of half hours in which ‘food preparation’ at home on Sunday 11:00-14:00 was reported in each survey by age group (left) and income group (right) (MTUS 1974-2005, weighted, error bars are +/- 95% confidence interval for the 45-54 age group or the middle income group only) 0 0.05 0.1 0.15 0.2 1974 1985 1995 2000 2005 16-24 25-34 35-44 45-54 55-64 65-74 75+ 0 0.05 0.1 0.15 0.2 1974 1985 1995 2000 2005 lowest 25% middle 50% highest 25% 0 0.05 0.1 0.15 0.2 1974 1985 1995 2000 2005 lowest 25% middle 50% highest 25%
  20. @DEMAND_CENTRE DEMANDing Times DEMAND 2016, Lancaster 13/4/2016 -0.6% -0.4% -0.2%

    0.0% 0.2% 0.4% 0.6% 00:00 01:30 03:00 04:30 06:00 07:30 09:00 10:30 12:00 13:30 15:00 16:30 18:00 19:30 21:00 22:30 % of half hours in which recorded Weekday Saturday Sunday Domestic laundry: Shifting practices? % point change laundry 1985 – 2005 in relative distribution within year Source: MTUS 1985-2005, author’s calculations, weighted 1985: • 98% of recorded laundry = women • 24% of women < 60 in full time paid work % point change 1985- 2005 % half hours where laundry reported by income group 1985- 2005 0 0.2 0.4 0.6 0.8 1 1.2 1985 1995 2000 2005 lowest 25% middle 50% highest 25% 2005: • 87% of recorded laundry = women • 41% of women < 60 in full time paid work
  21. @DEMAND_CENTRE DEMANDing Times DEMAND 2016, Lancaster 13/4/2016 Further detail: Car

    use Source: MTUS 1985-2005, author’s calculations, weighted Comparing time of car travel within the year 1985-2005 0.0% 0.1% 0.2% 0.3% 0.4% 0.5% 0.6% 0.7% 00:00 01:00 02:00 03:00 04:00 05:00 06:00 07:00 08:00 09:00 10:00 11:00 12:00 13:00 14:00 15:00 16:00 17:00 18:00 19:00 20:00 21:00 22:00 23:00 % of recorded car travel 1985 2000 2005 Car use in 1974 = to/from work/school only -0.3% -0.2% -0.2% -0.1% -0.1% 0.0% 0.1% 0.1% 0.2% 0.2% 0.3% 0.3% 00:00 01:00 02:00 03:00 04:00 05:00 06:00 07:00 08:00 09:00 10:00 11:00 12:00 13:00 14:00 15:00 16:00 17:00 18:00 19:00 20:00 21:00 22:00 23:00 Saturday Sunday Weekdays (average)
  22. @DEMAND_CENTRE DEMANDing Times DEMAND 2016, Lancaster 13/4/2016 Car trips ending

    at home in 2005 When might people charge EVs? Source: MTUS 2005, author’s calculations, weighted 0.00% 0.20% 0.40% 0.60% 0.80% 1.00% 1.20% 1.40% 1.60% 00:00 01:00 02:00 03:00 04:00 05:00 06:00 07:00 08:00 09:00 10:00 11:00 12:00 13:00 14:00 15:00 16:00 17:00 18:00 19:00 20:00 21:00 22:00 23:00 % of half hours where car trip ends at home Sunday Weekdays (average) Saturday
  23. @DEMAND_CENTRE DEMANDing Times DEMAND 2016, Lancaster 13/4/2016 1. Conceptions of

    DEMAND 2. Researching DEMAND using time use data 3. Activity classes: overall trends 4. Selected Activities: detailed trends 5. Concluding thoughts Today’s menu
  24. @DEMAND_CENTRE DEMANDing Times DEMAND 2016, Lancaster 13/4/2016 Key messages I:

    Dynamism How do we ‘meet’ DEMAND? -25 -20 -15 -10 -5 0 5 10 15 00:00 01:30 03:00 04:30 06:00 07:30 09:00 10:30 12:00 13:30 15:00 16:30 18:00 19:30 21:00 22:30 % point change 1974 - 2005 Travel Media use incl. TV, radio, PC, internet Sport or exercise Voluntary, civic, watching sport, leisure or social activities Shopping/service use Education or related Work or work related Cooking or eating Personal, child, adult or household care/chores When it keeps changing?
  25. @DEMAND_CENTRE DEMANDing Times DEMAND 2016, Lancaster 13/4/2016 Key messages II:

    Constrained evolution Practices Infrastr uctures Social trends Evolving demand Non-energy energy policy Labour market policies Working hours School hours (Sub)Urban planning Transport options