domestic electricity consumption and how could data linkage help? Ben Anderson - [email protected] (@dataknut) Engineering & Environment (Energy & Climate Change) Gabi Durrant, Vivian So School of Social Sciences
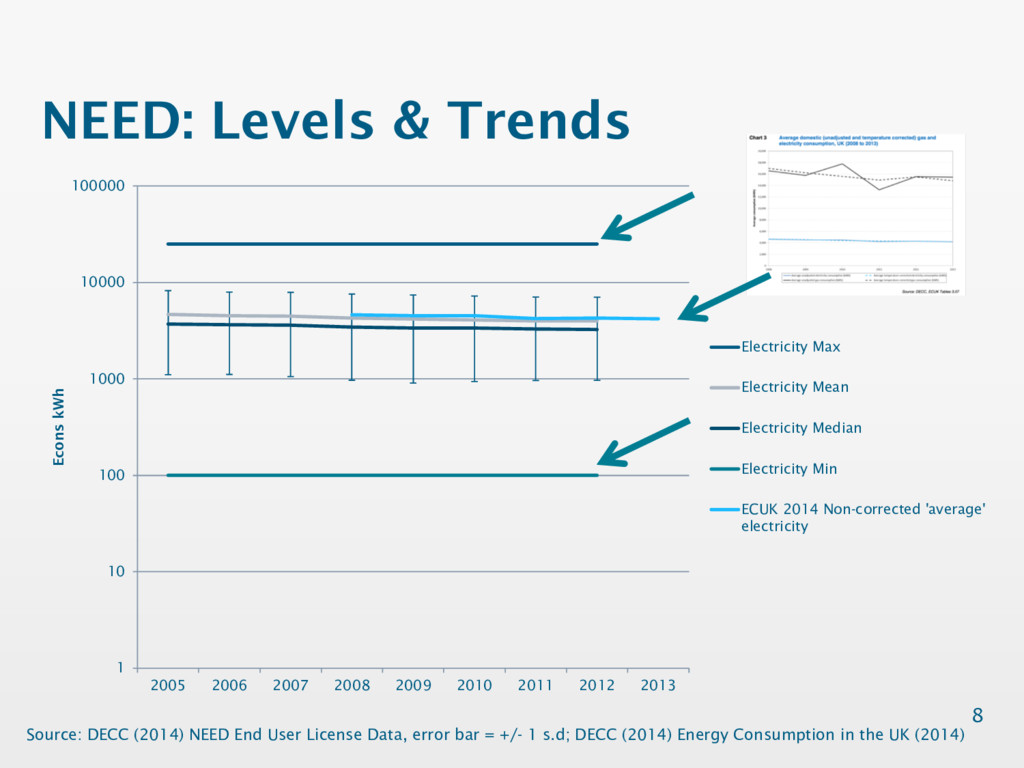
2009 2010 2011 2012 2013 Econs kWh Electricity Max Electricity Mean Electricity Median Electricity Min ECUK 2014 Non-corrected 'average' electricity NEED: Levels & Trends 8 Source: DECC (2014) NEED End User License Data, error bar = +/- 1 s.d; DECC (2014) Energy Consumption in the UK (2014)
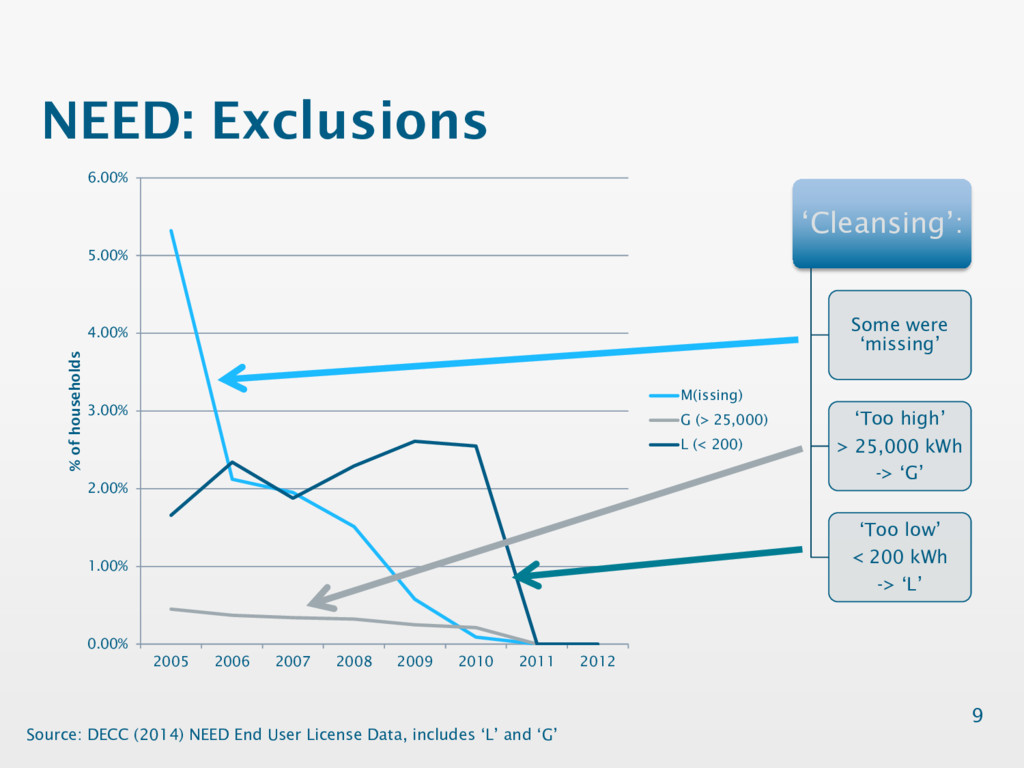
2008 2009 2010 2011 2012 % of households M(issing) G (> 25,000) L (< 200) NEED: Exclusions 9 Source: DECC (2014) NEED End User License Data, includes ‘L’ and ‘G’ ‘Cleansing’: Some were ‘missing’ ‘Too high’ > 25,000 kWh -> ‘G’ ‘Too low’ < 200 kWh -> ‘L’
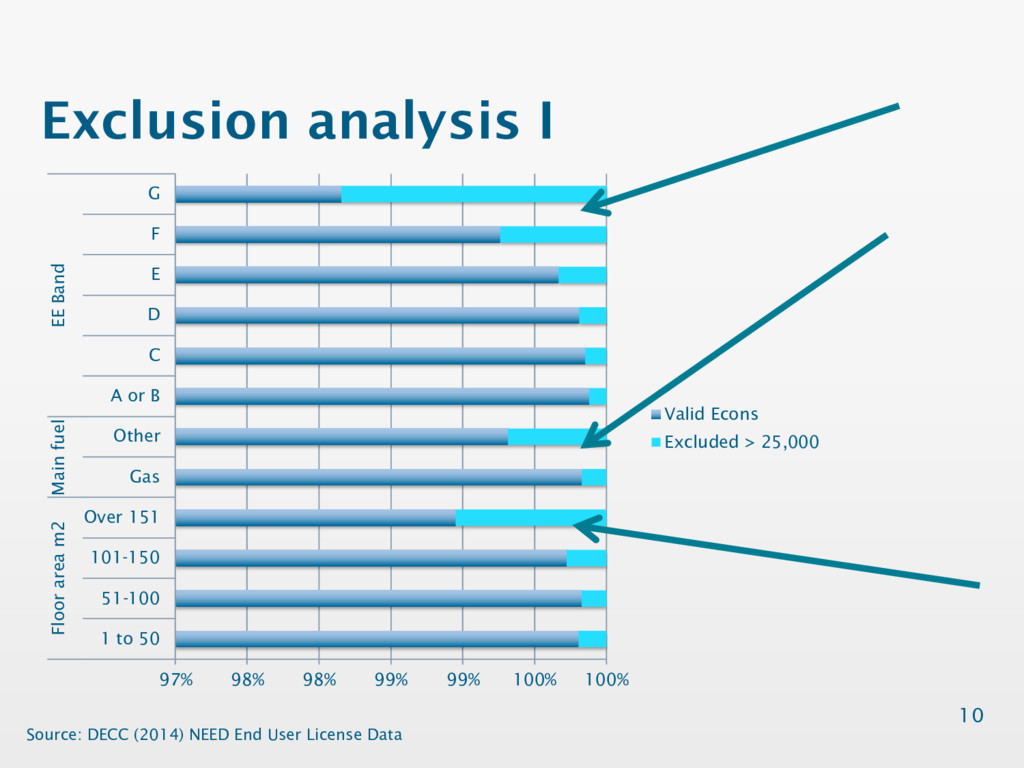
51-100 101-150 Over 151 Gas Other A or B C D E F G Floor area m2 Main fuel EE Band Valid Econs Excluded > 25,000 Exclusion analysis I 10 Source: DECC (2014) NEED End User License Data
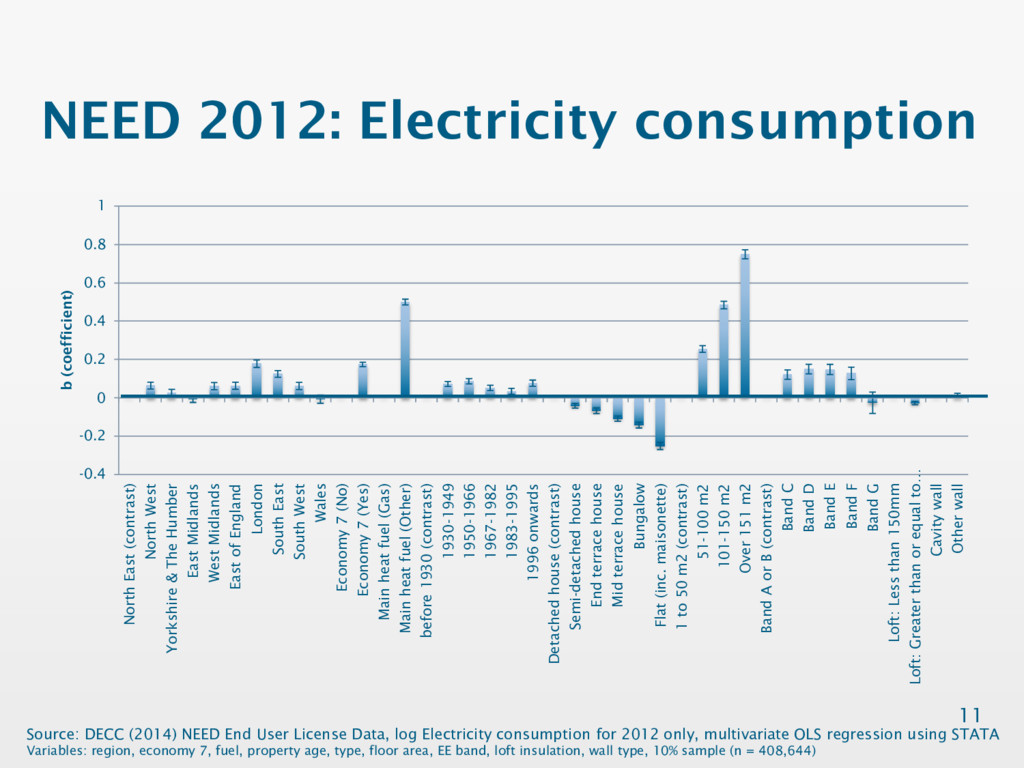
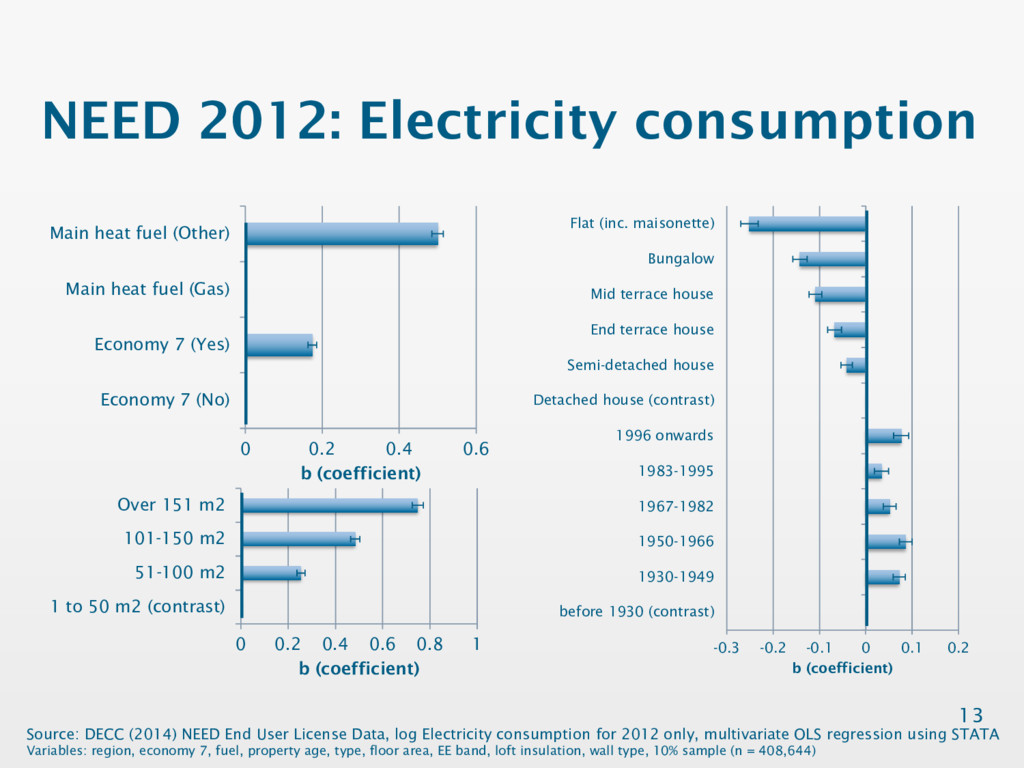
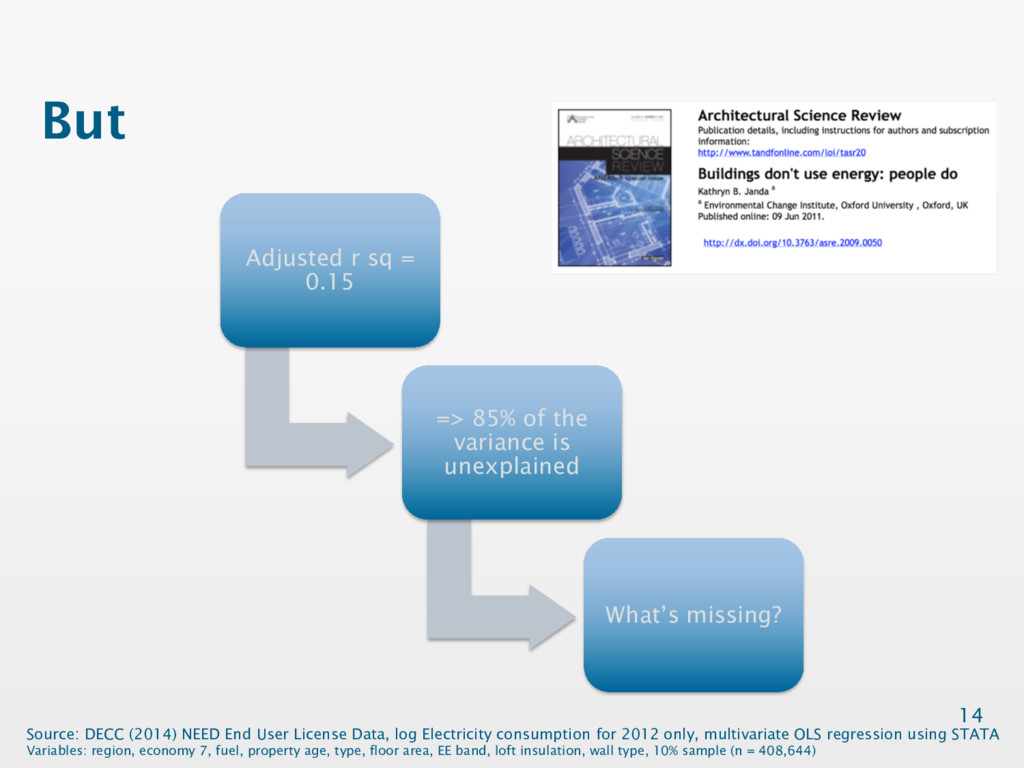
User License Data, log Electricity consumption for 2012 only, multivariate OLS regression using STATA Variables: region, economy 7, fuel, property age, type, floor area, EE band, loft insulation, wall type, 10% sample (n = 408,644) -0.4 -0.2 0 0.2 0.4 0.6 0.8 1 North East (contrast) North West Yorkshire & The Humber East Midlands West Midlands East of England London South East South West Wales Economy 7 (No) Economy 7 (Yes) Main heat fuel (Gas) Main heat fuel (Other) before 1930 (contrast) 1930-1949 1950-1966 1967-1982 1983-1995 1996 onwards Detached house (contrast) Semi-detached house End terrace house Mid terrace house Bungalow Flat (inc. maisonette) 1 to 50 m2 (contrast) 51-100 m2 101-150 m2 Over 151 m2 Band A or B (contrast) Band C Band D Band E Band F Band G Loft: Less than 150mm Loft: Greater than or equal to… Cavity wall Other wall b (coefficient)
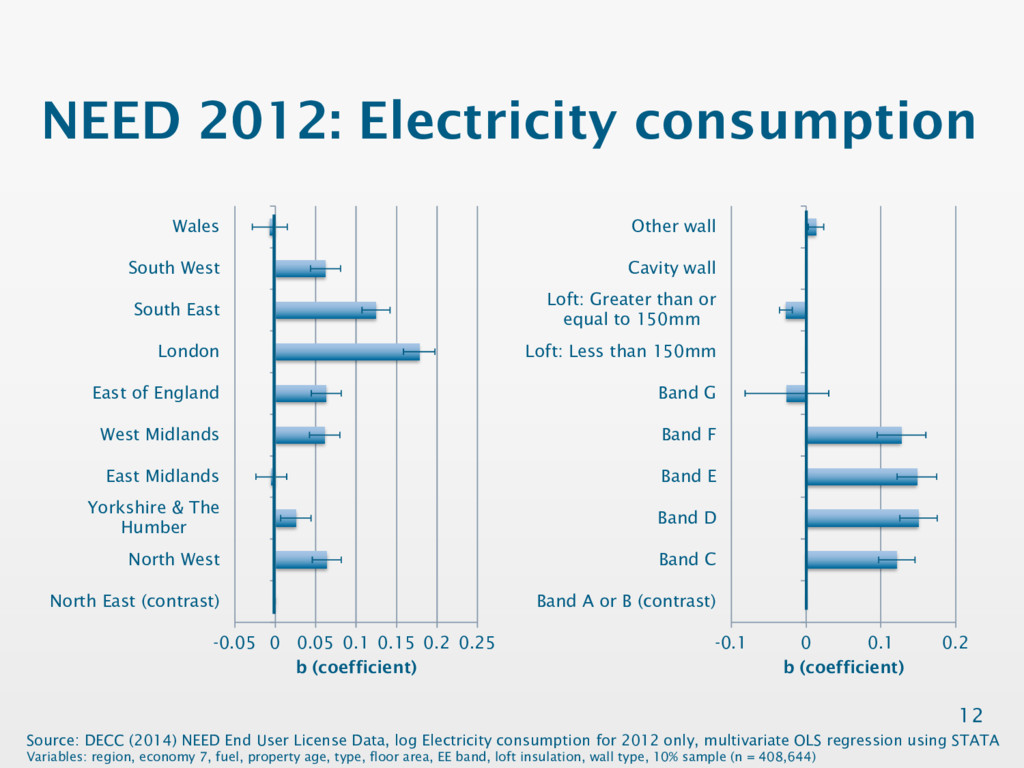
0.2 0.25 North East (contrast) North West Yorkshire & The Humber East Midlands West Midlands East of England London South East South West Wales b (coefficient) -0.1 0 0.1 0.2 Band A or B (contrast) Band C Band D Band E Band F Band G Loft: Less than 150mm Loft: Greater than or equal to 150mm Cavity wall Other wall b (coefficient) Source: DECC (2014) NEED End User License Data, log Electricity consumption for 2012 only, multivariate OLS regression using STATA Variables: region, economy 7, fuel, property age, type, floor area, EE band, loft insulation, wall type, 10% sample (n = 408,644)
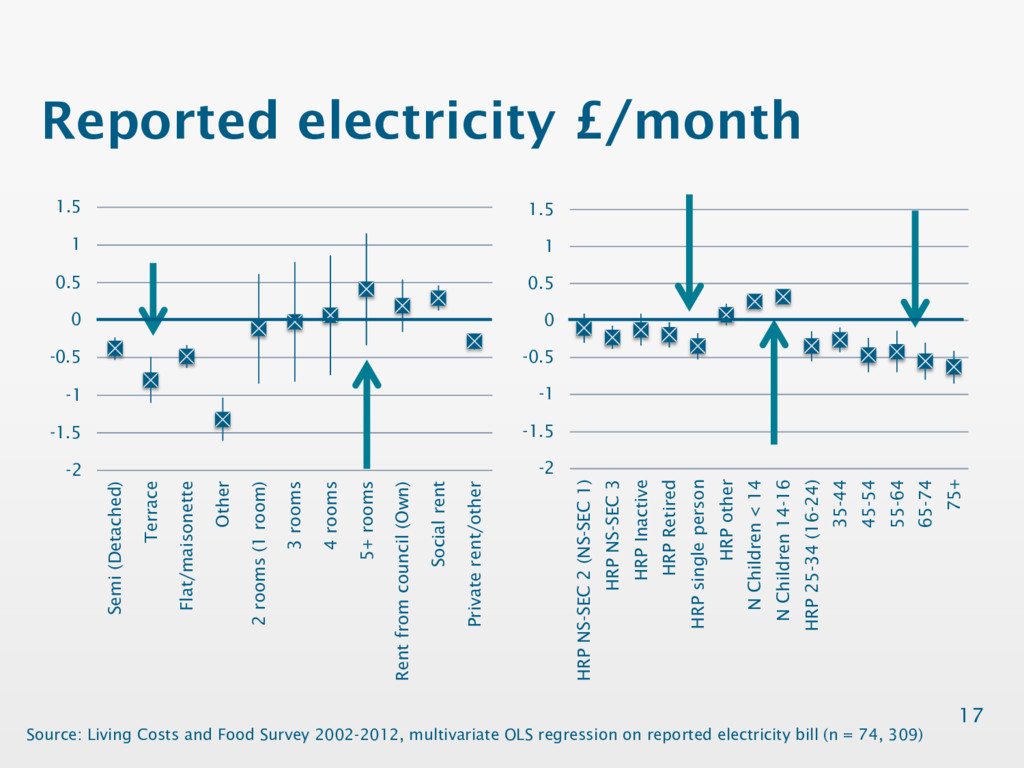
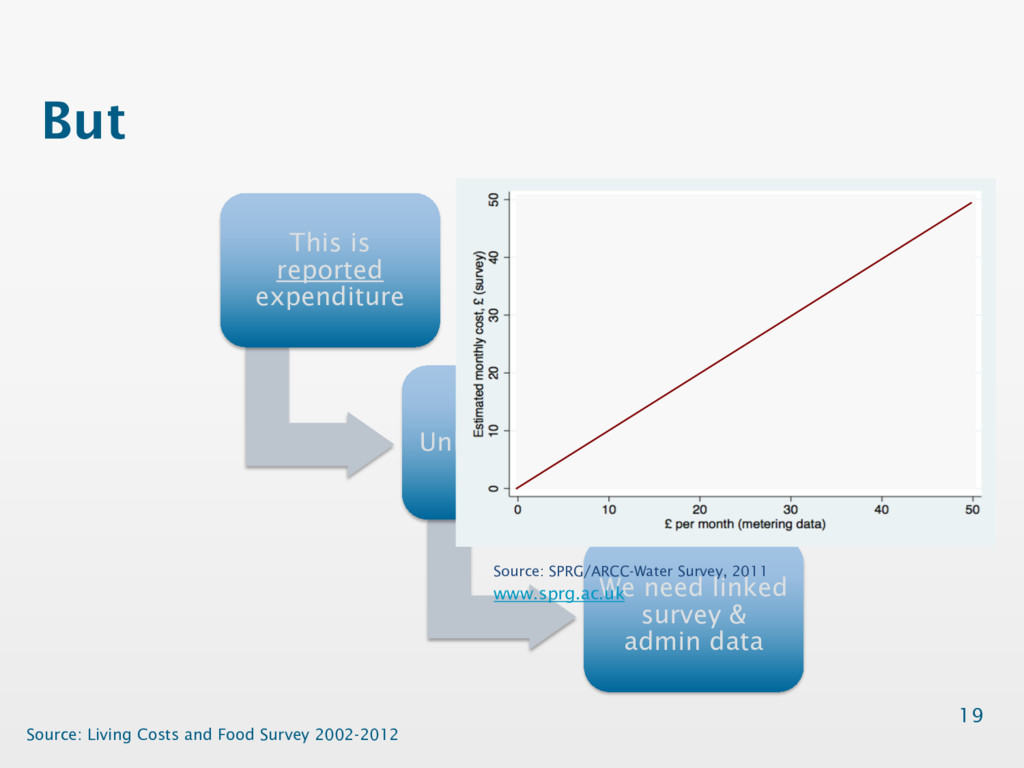
3 year anomaly low (previous quarter) Mean rainfall 3 year anomaly high (previous quarter) Mean sunshine 3 year anomaly high (previous quarter) And we can add ‘climate’ context 18 Source: Living Costs and Food Survey 2002-2012, multivariate OLS regression on reported electricity bill (n = 74, 309) Metoffice regional weather data Drier than usual Sunnier than usual
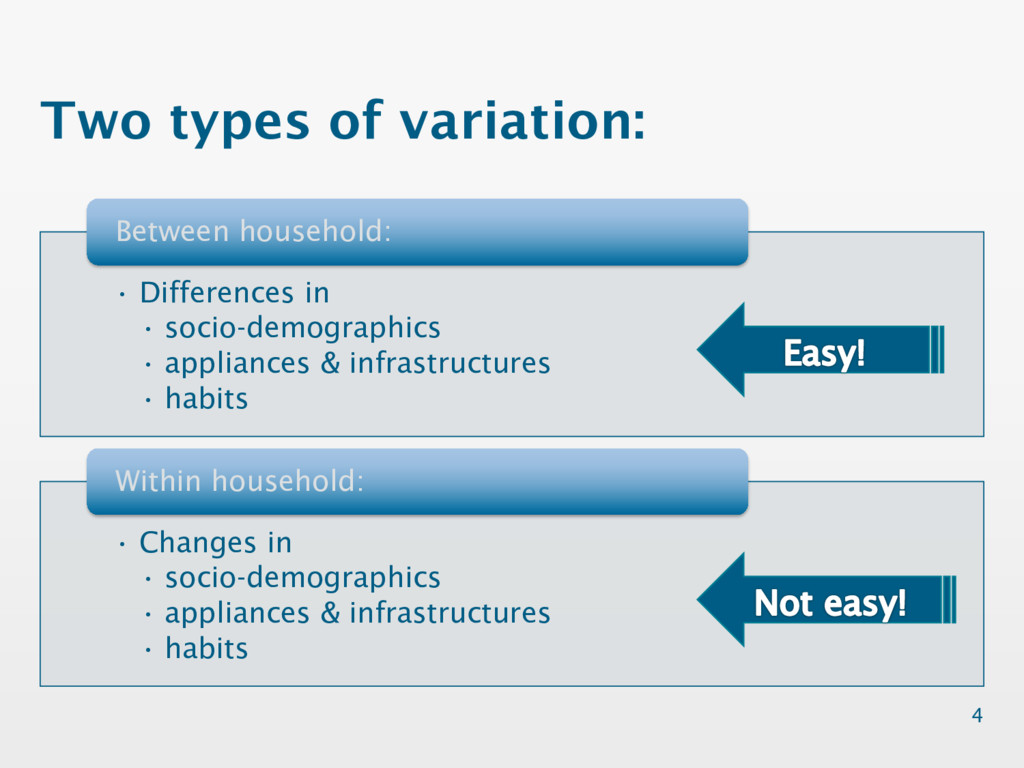
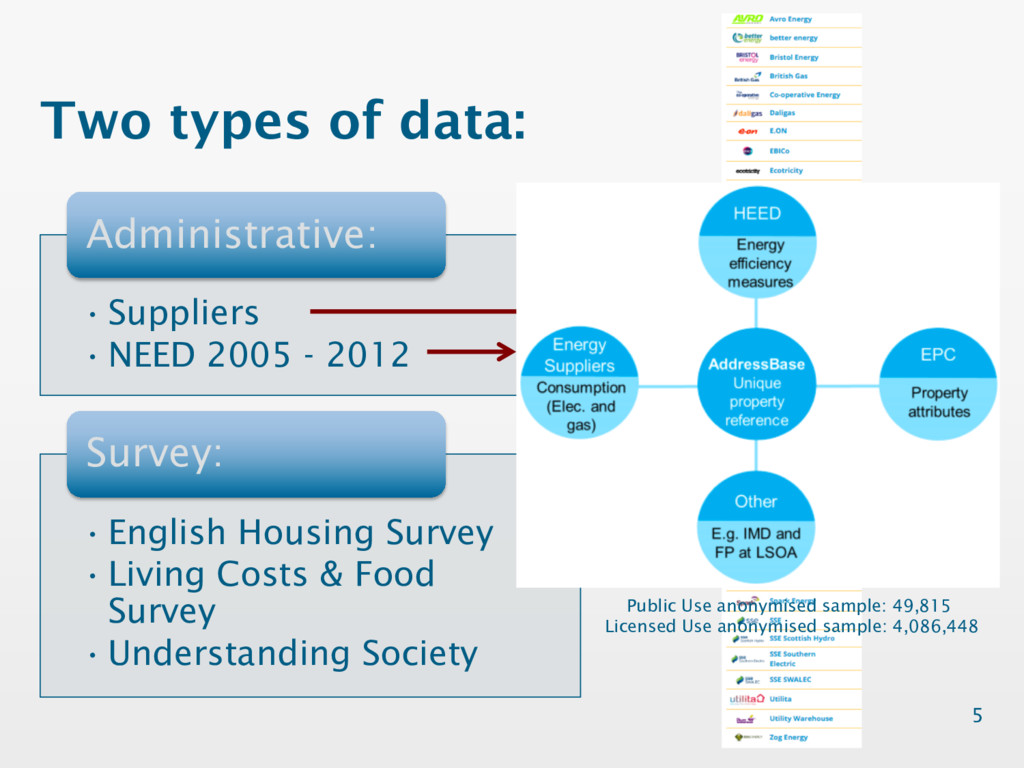
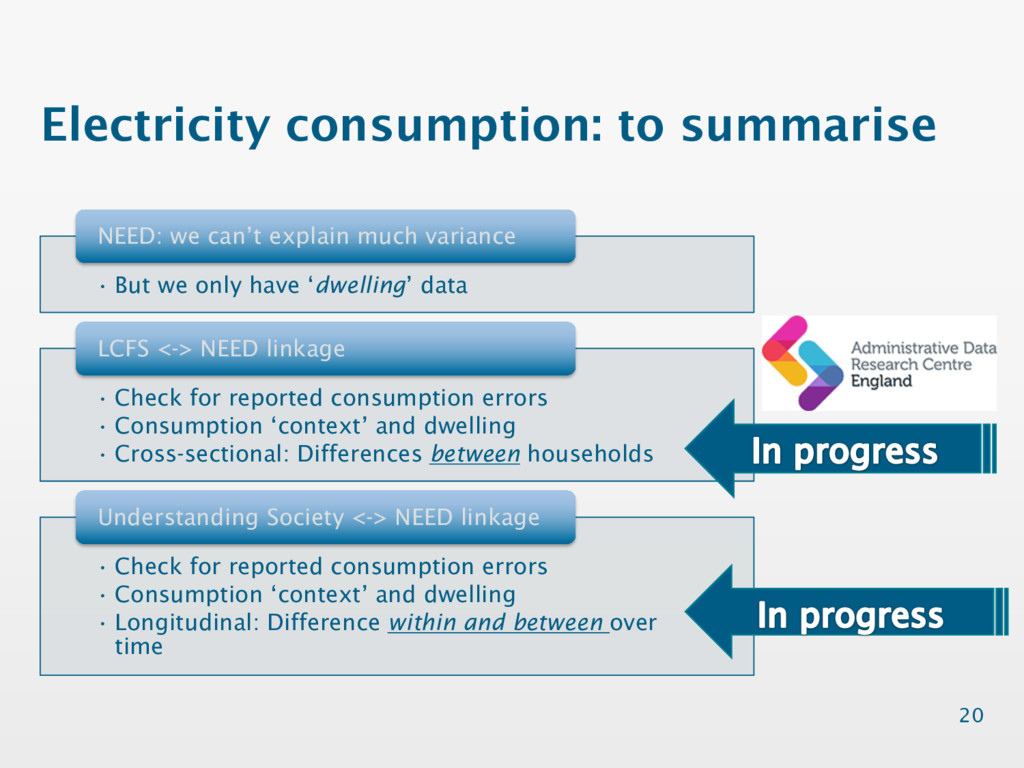
data NEED: we can’t explain much variance • Check for reported consumption errors • Consumption ‘context’ and dwelling • Cross-sectional: Differences between households LCFS <-> NEED linkage • Check for reported consumption errors • Consumption ‘context’ and dwelling • Longitudinal: Difference within and between over time Understanding Society <-> NEED linkage 20
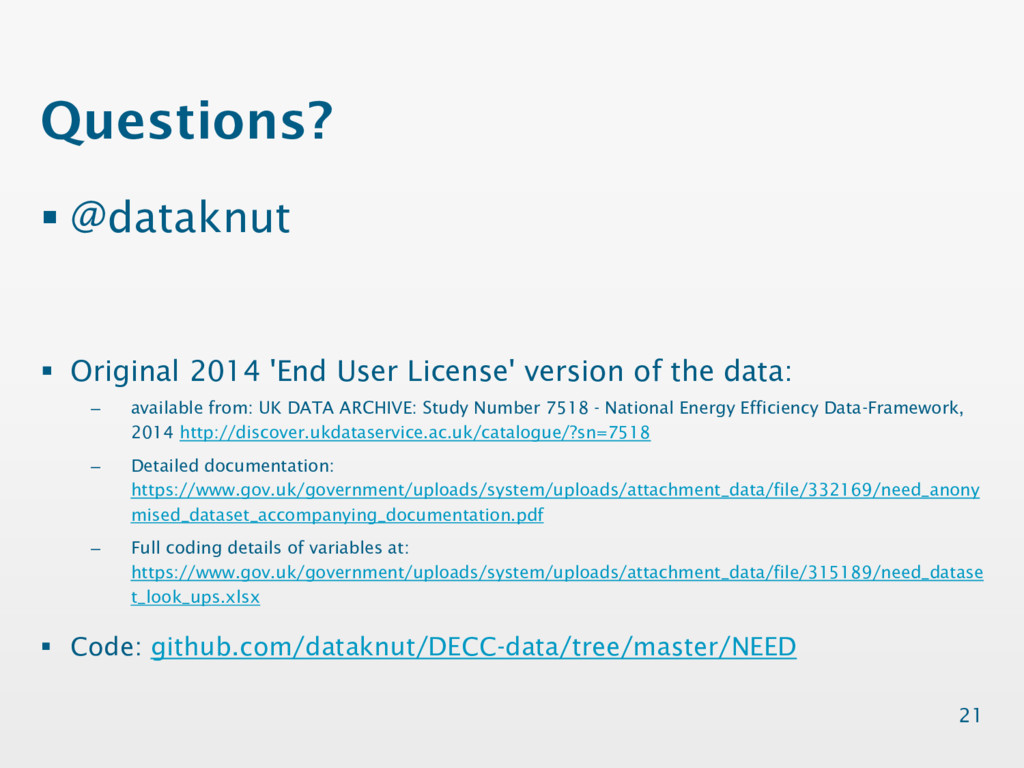
of the data: – available from: UK DATA ARCHIVE: Study Number 7518 - National Energy Efficiency Data-Framework, 2014 http://discover.ukdataservice.ac.uk/catalogue/?sn=7518 – Detailed documentation: https://www.gov.uk/government/uploads/system/uploads/attachment_data/file/332169/need_anony mised_dataset_accompanying_documentation.pdf – Full coding details of variables at: https://www.gov.uk/government/uploads/system/uploads/attachment_data/file/315189/need_datase t_look_ups.xlsx § Code: github.com/dataknut/DECC-data/tree/master/NEED 21