Upgrade to Pro — share decks privately, control downloads, hide ads and more …

What do we need computationally to make the most of single-cell RNA-seq data?

Davis McCarthy
September 21, 2016

What do we need computationally to make the most of single-cell RNA-seq data?

Invited talk at Genome Informatics 2016, held at the Wellcome Genome Campus, 19-22 September 2016.

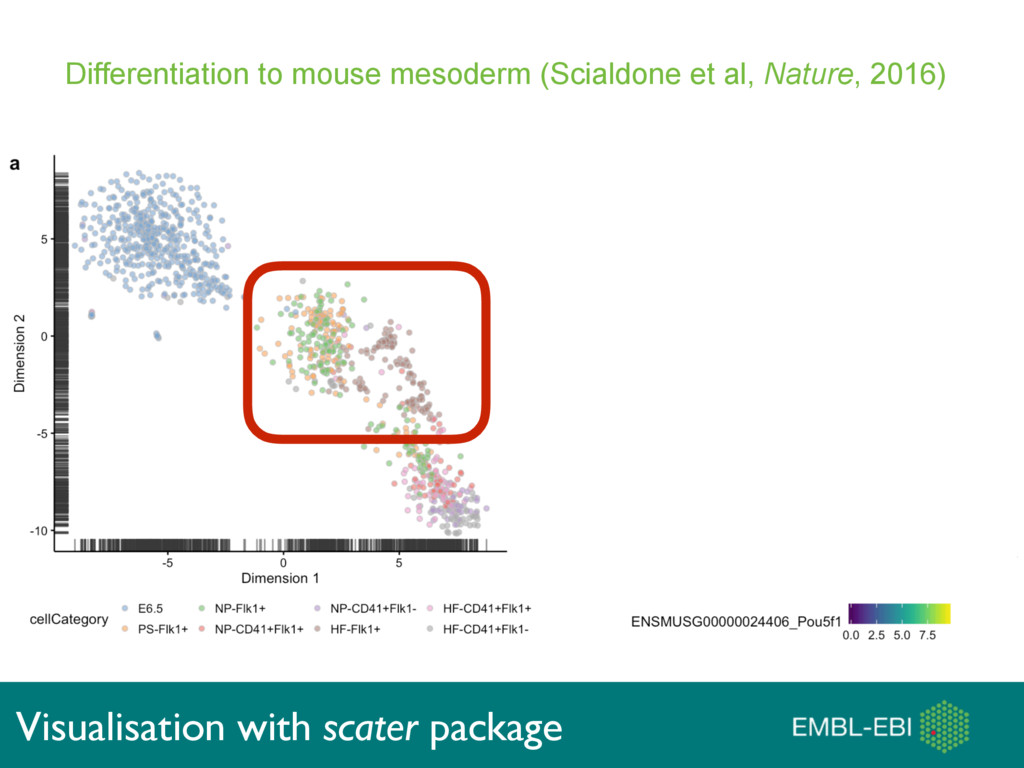
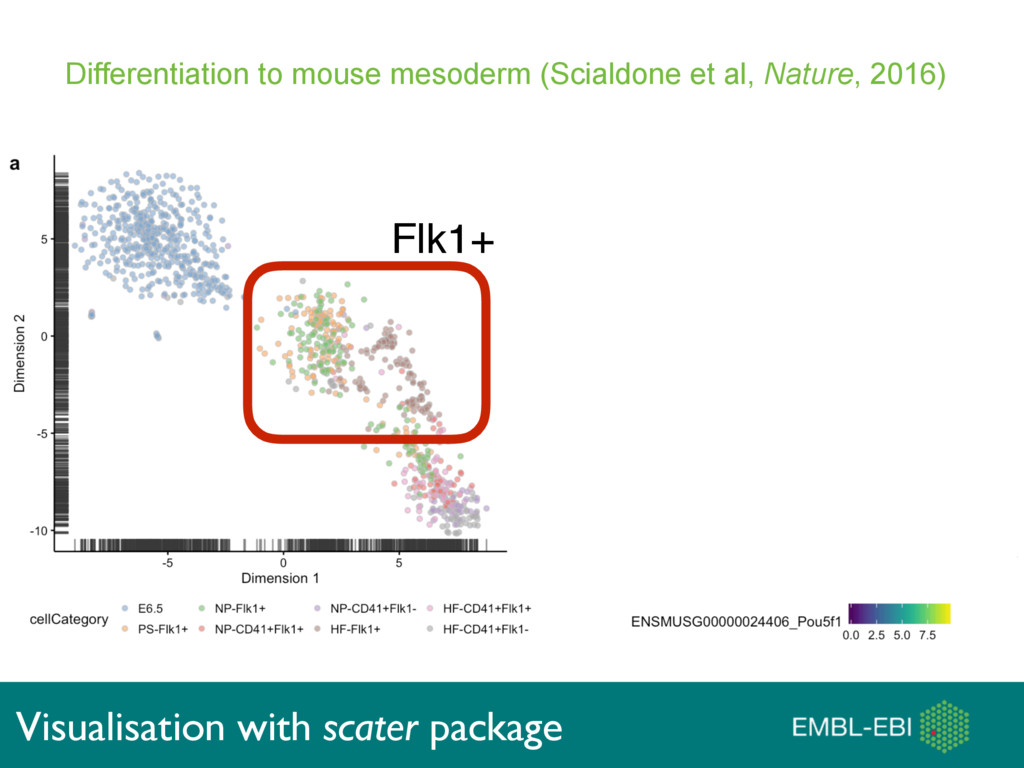
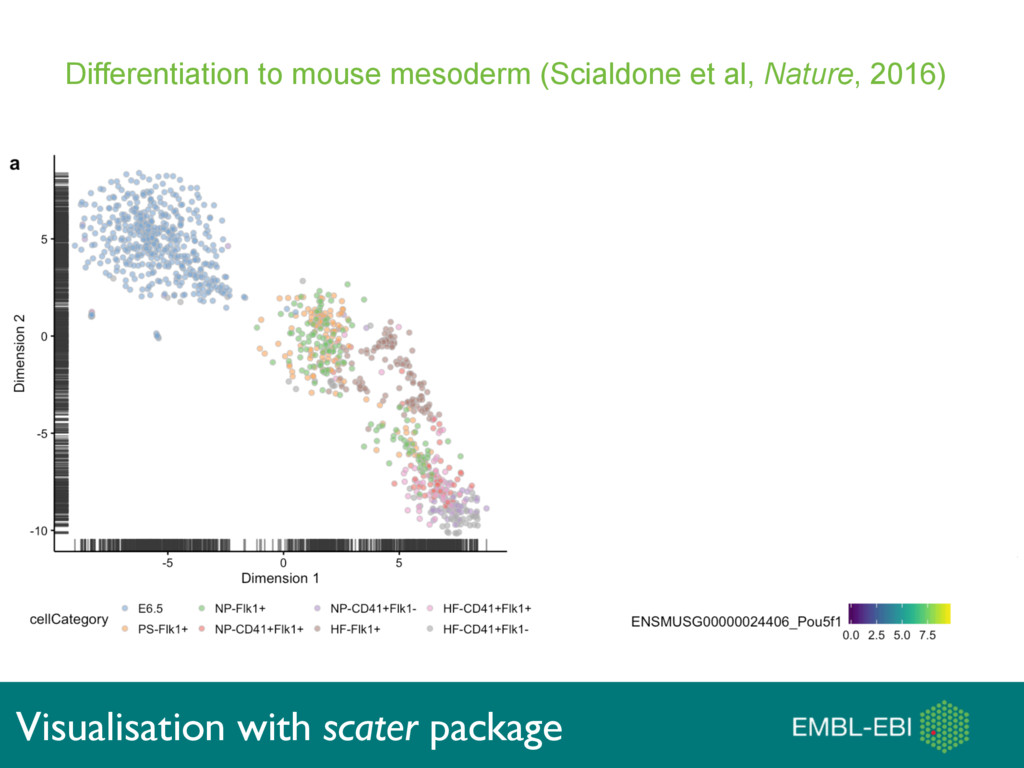
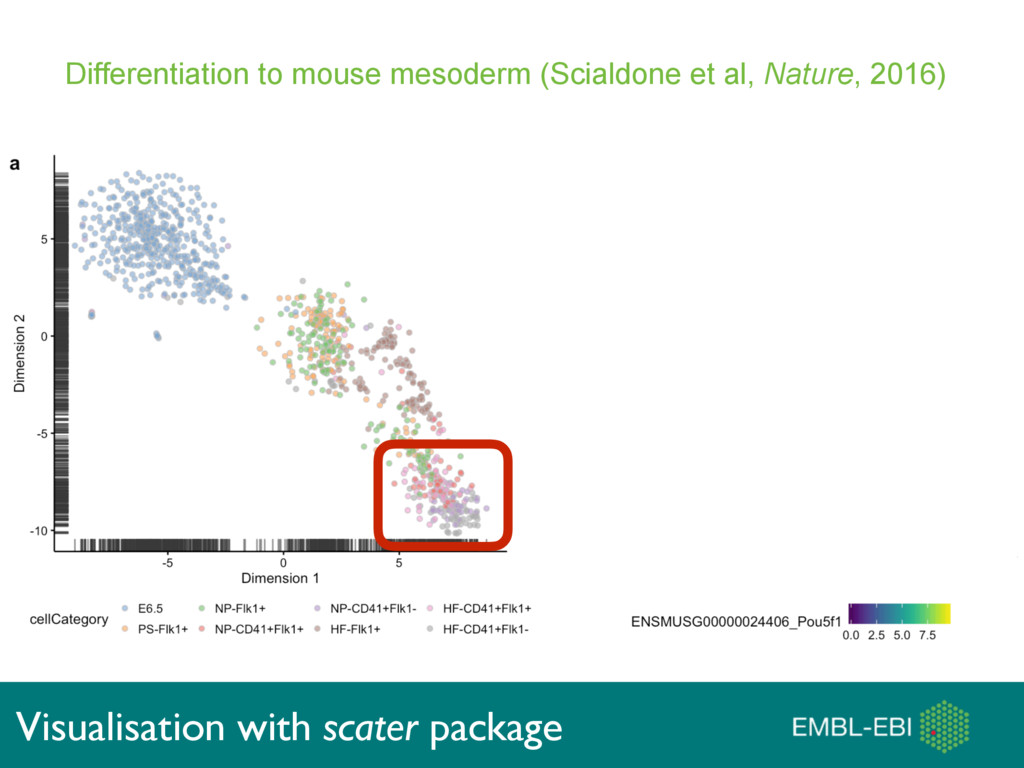
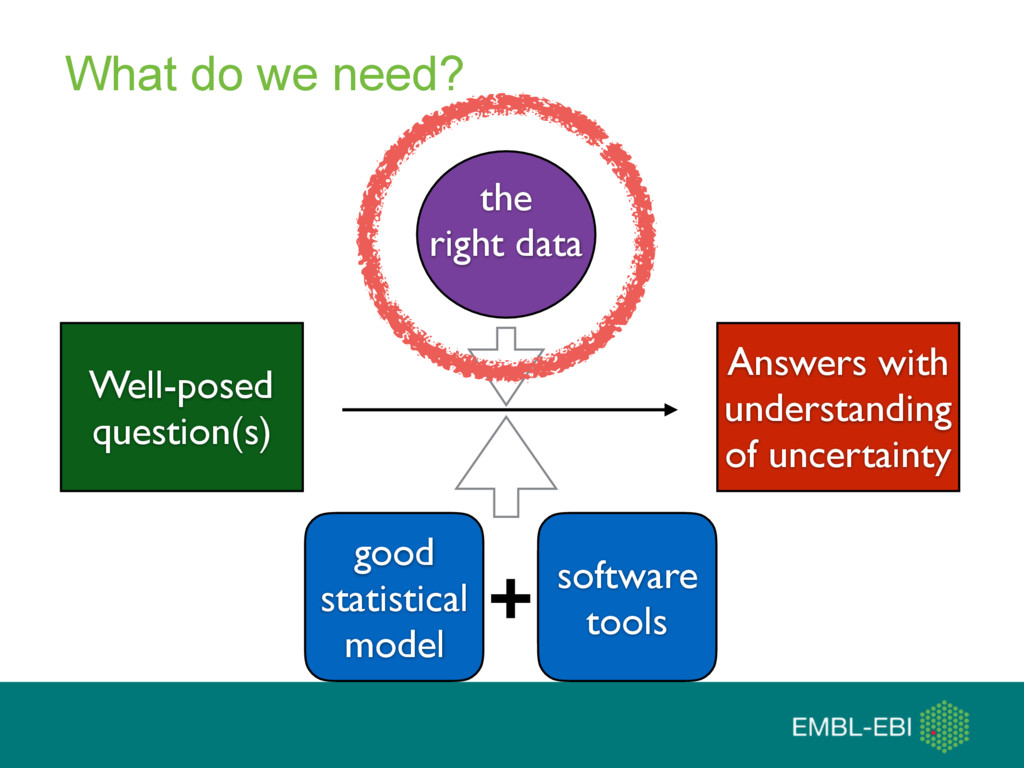
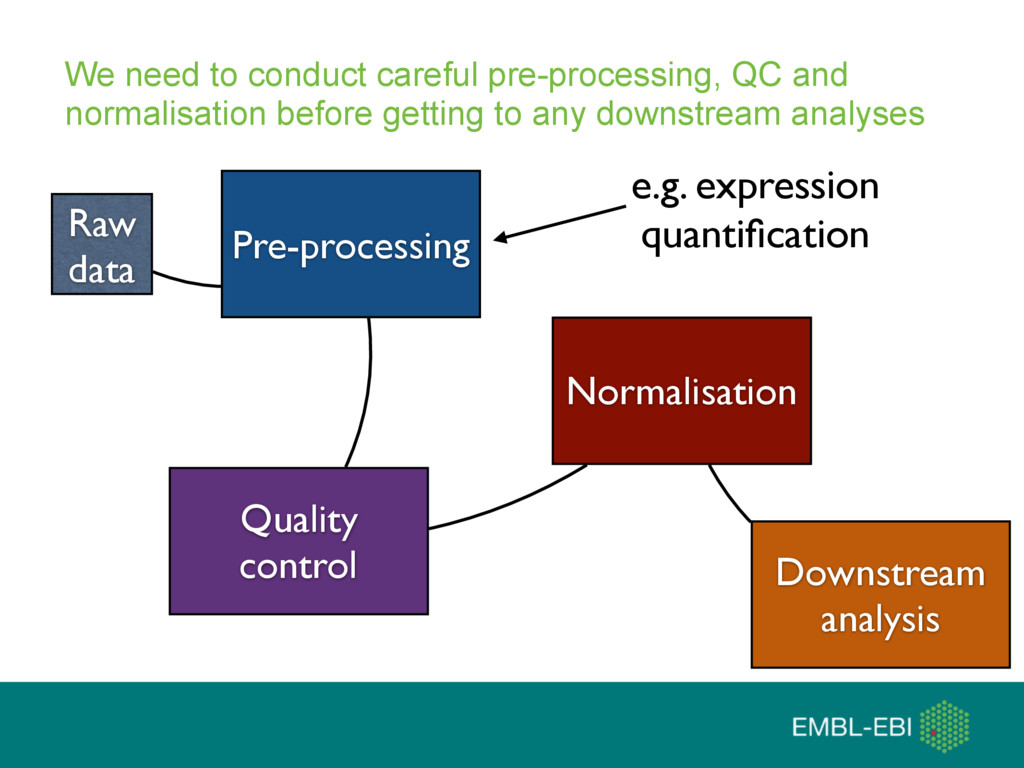
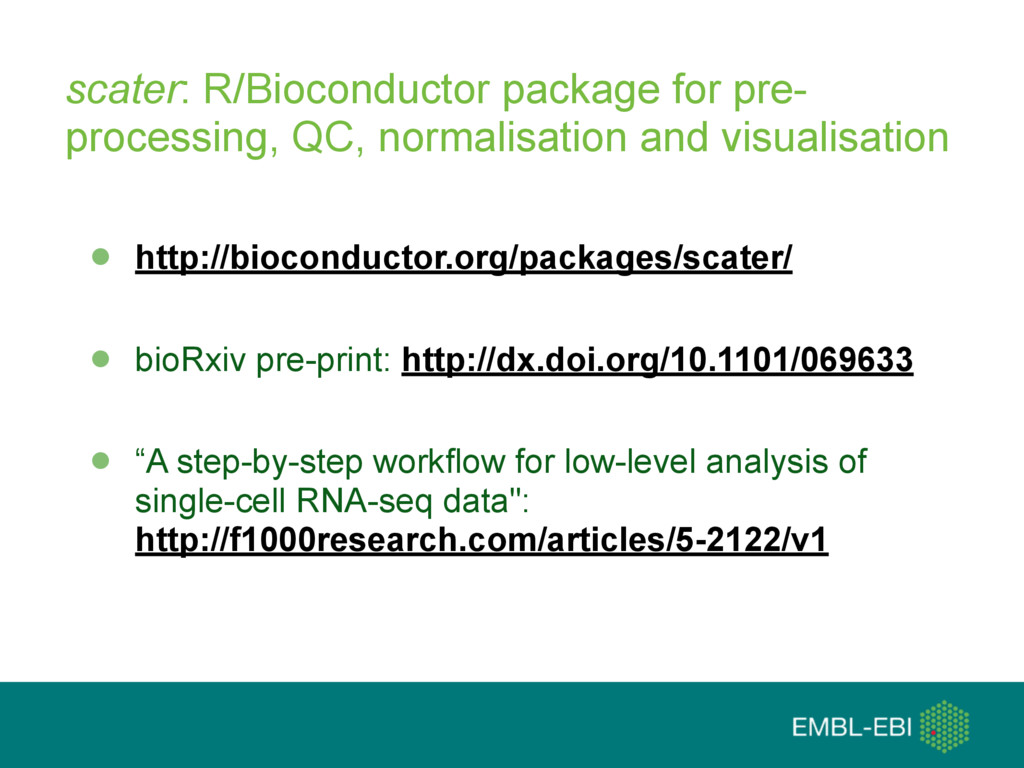
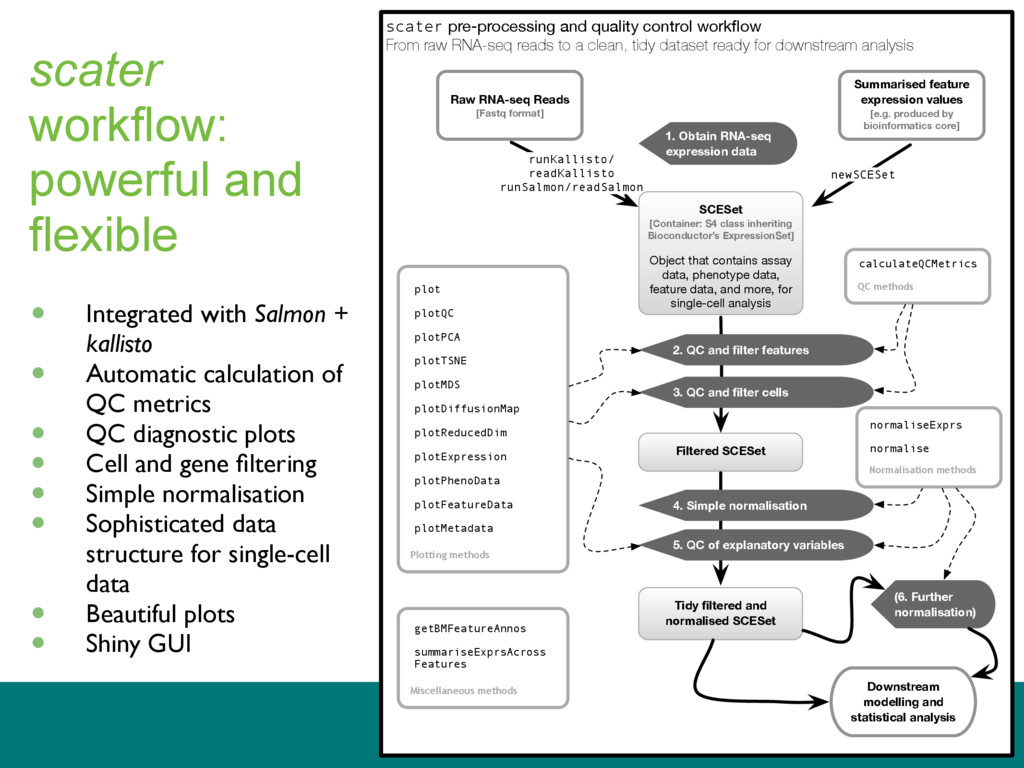
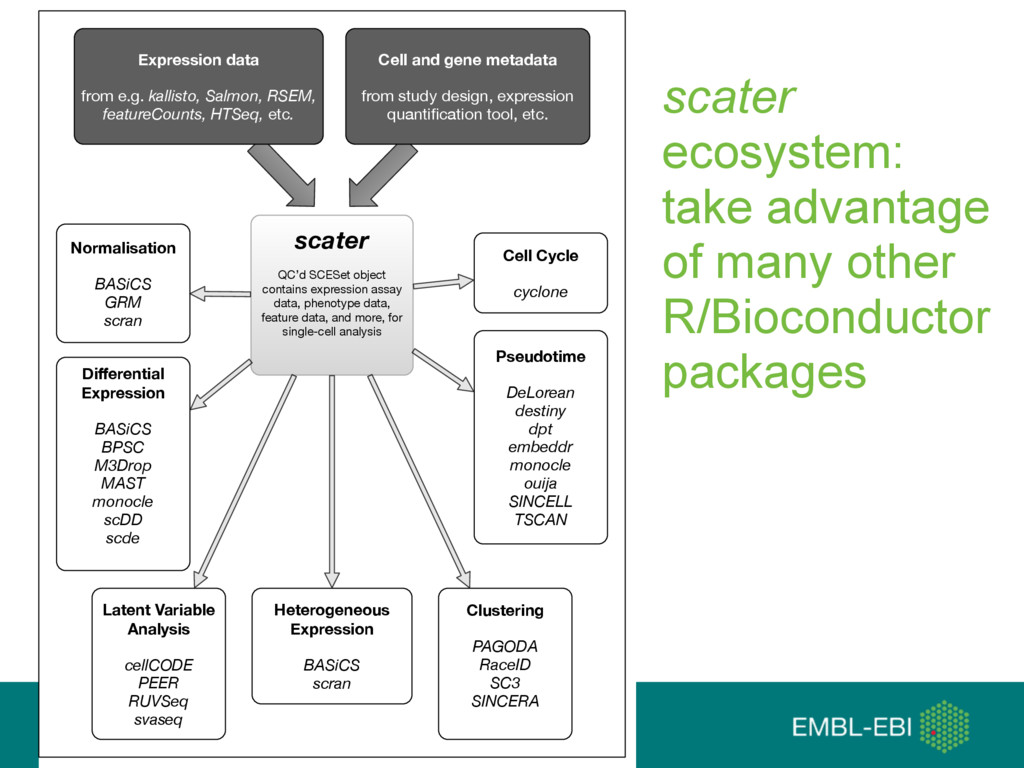
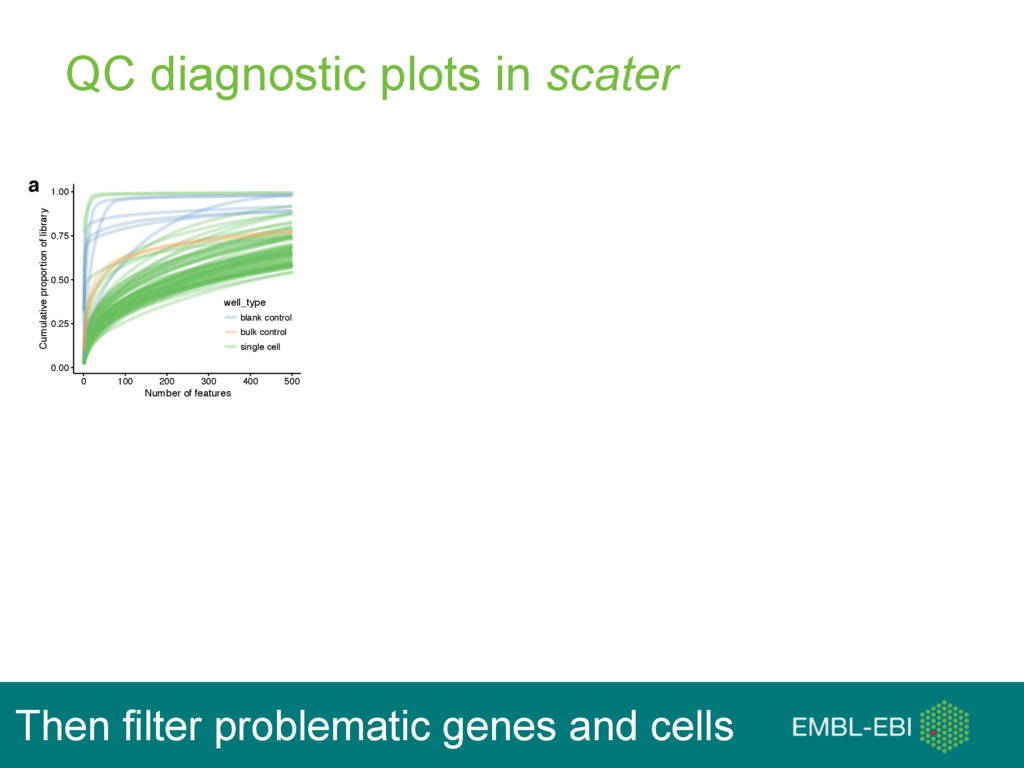
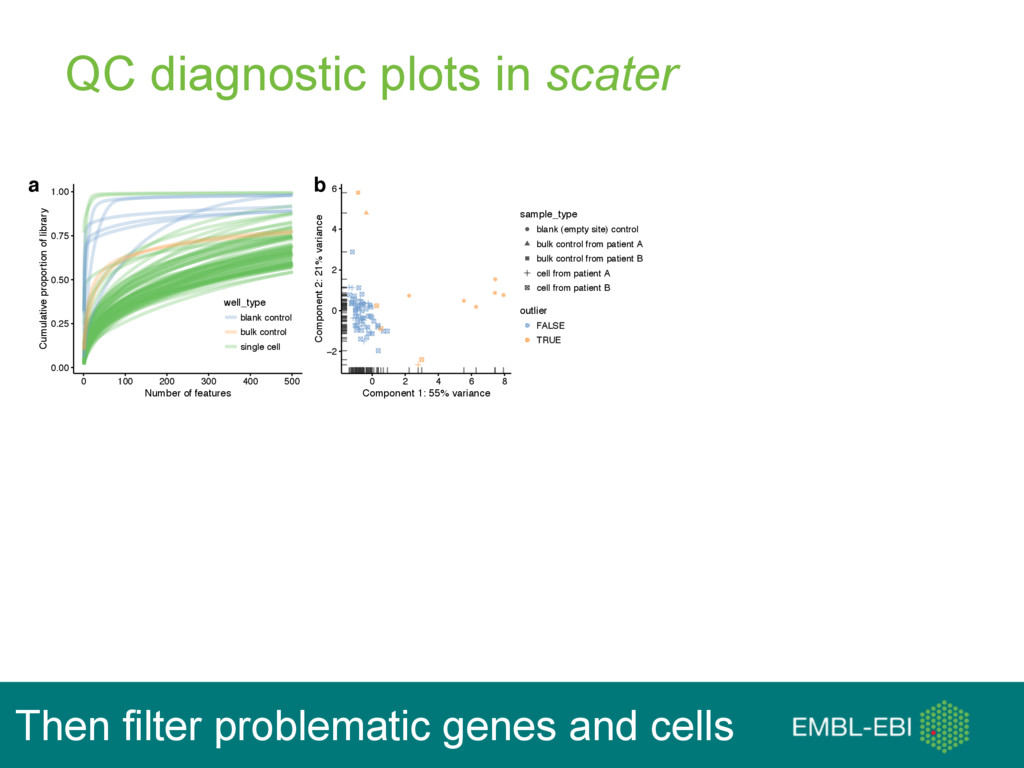
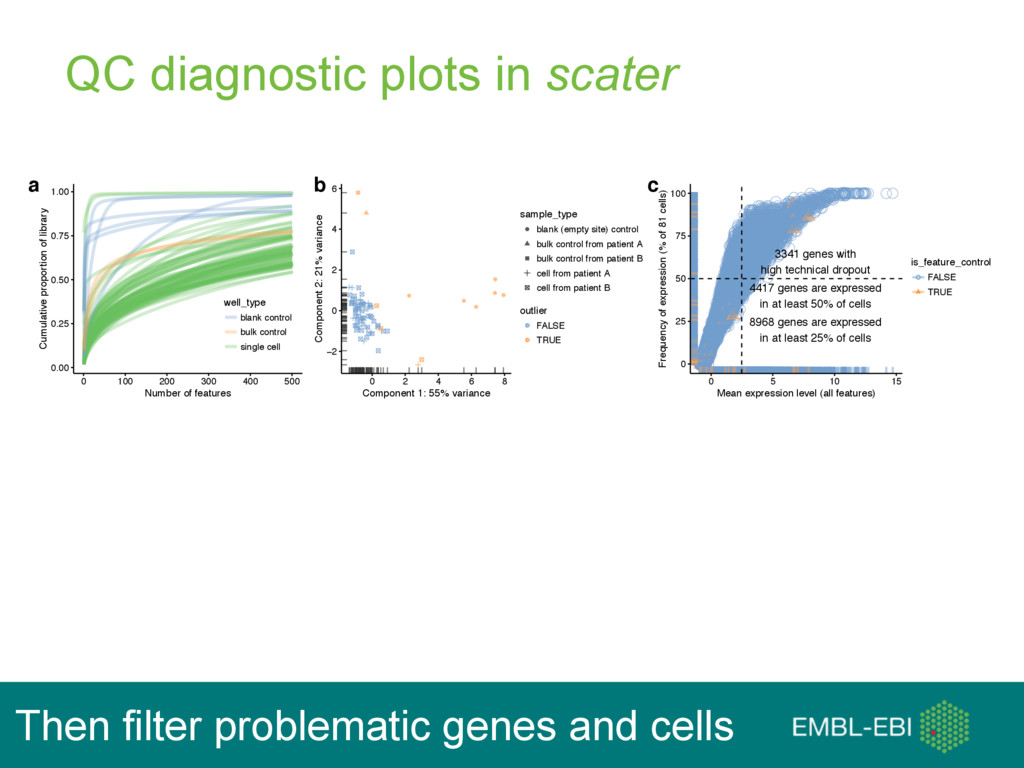
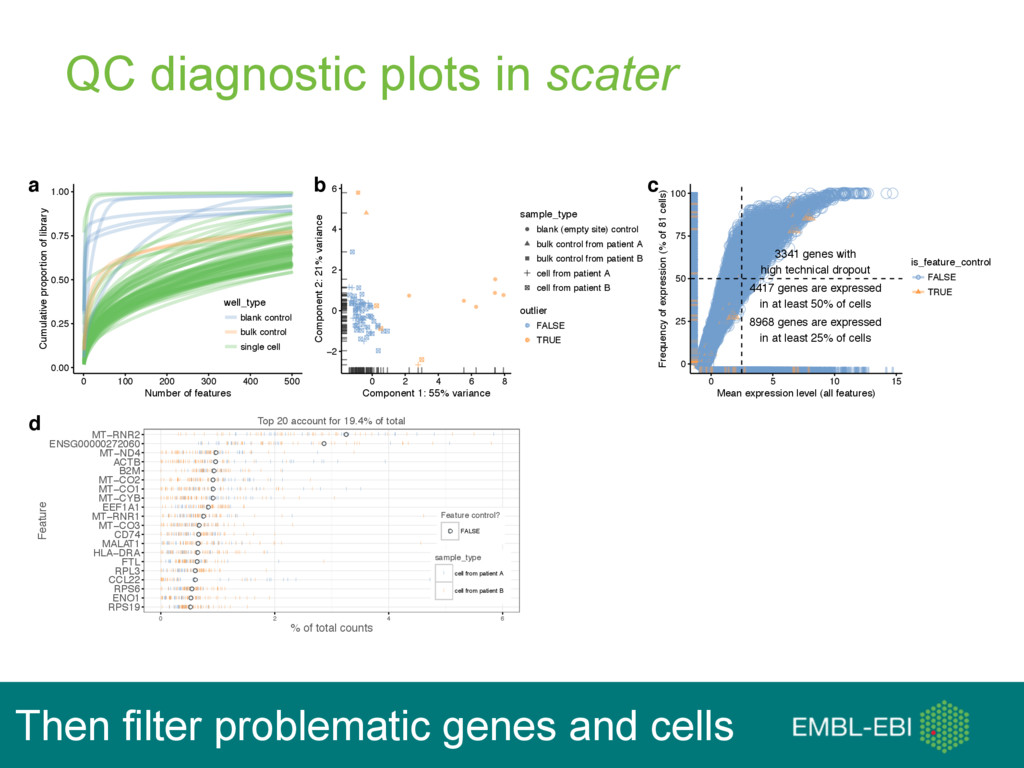
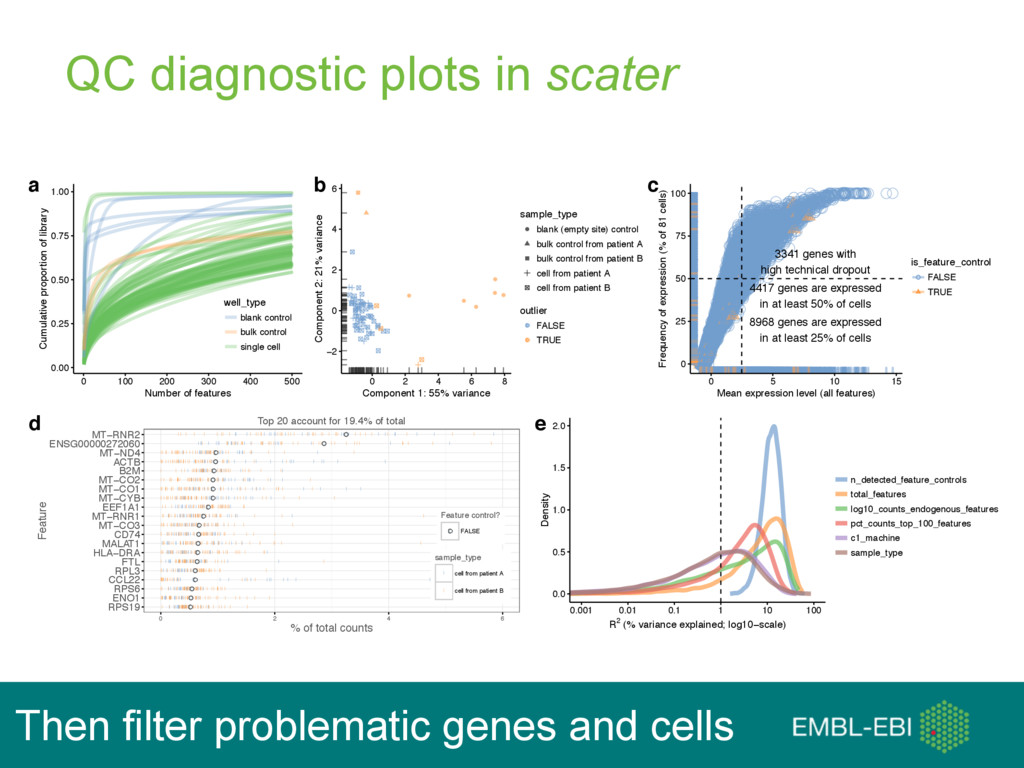
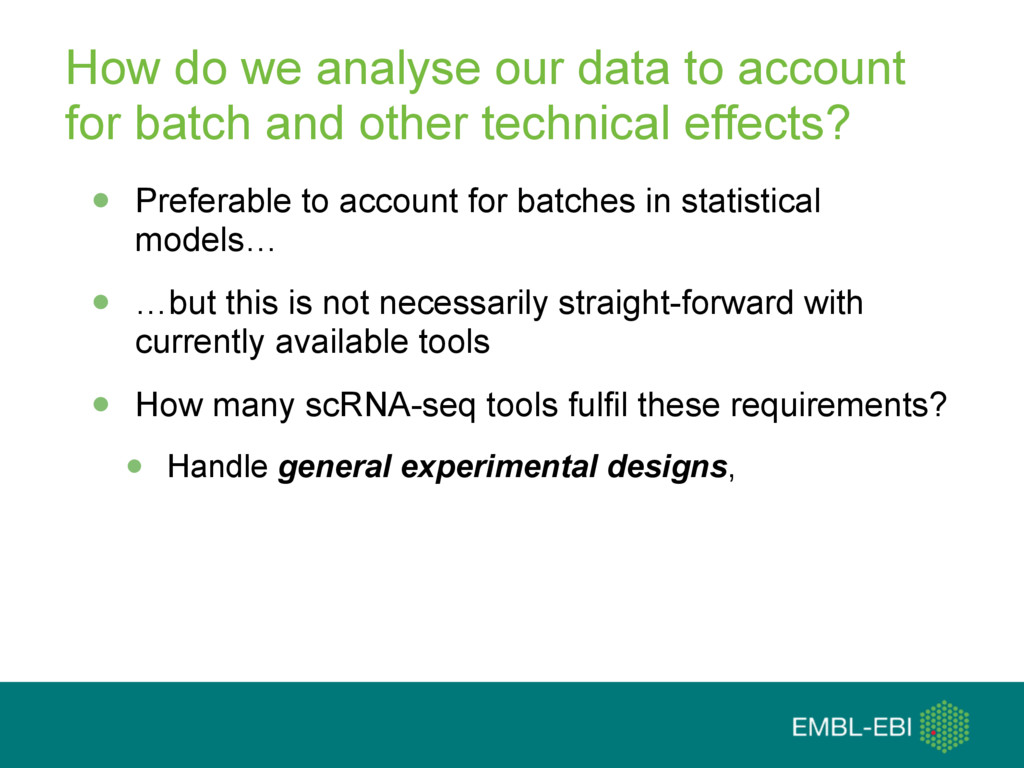
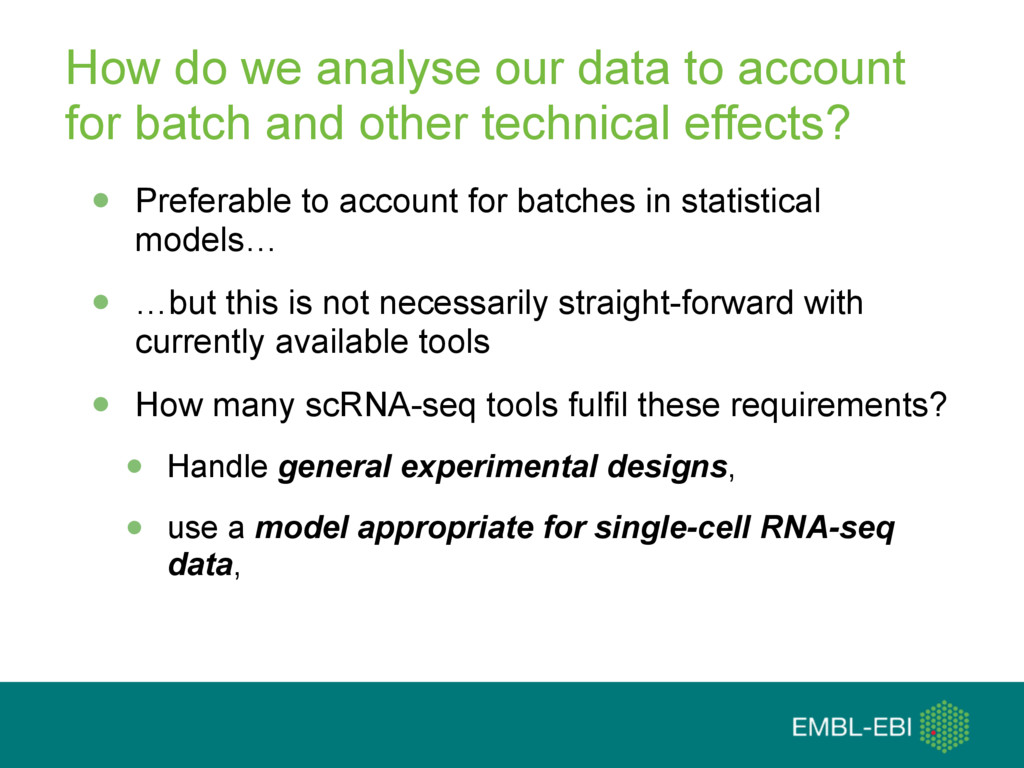
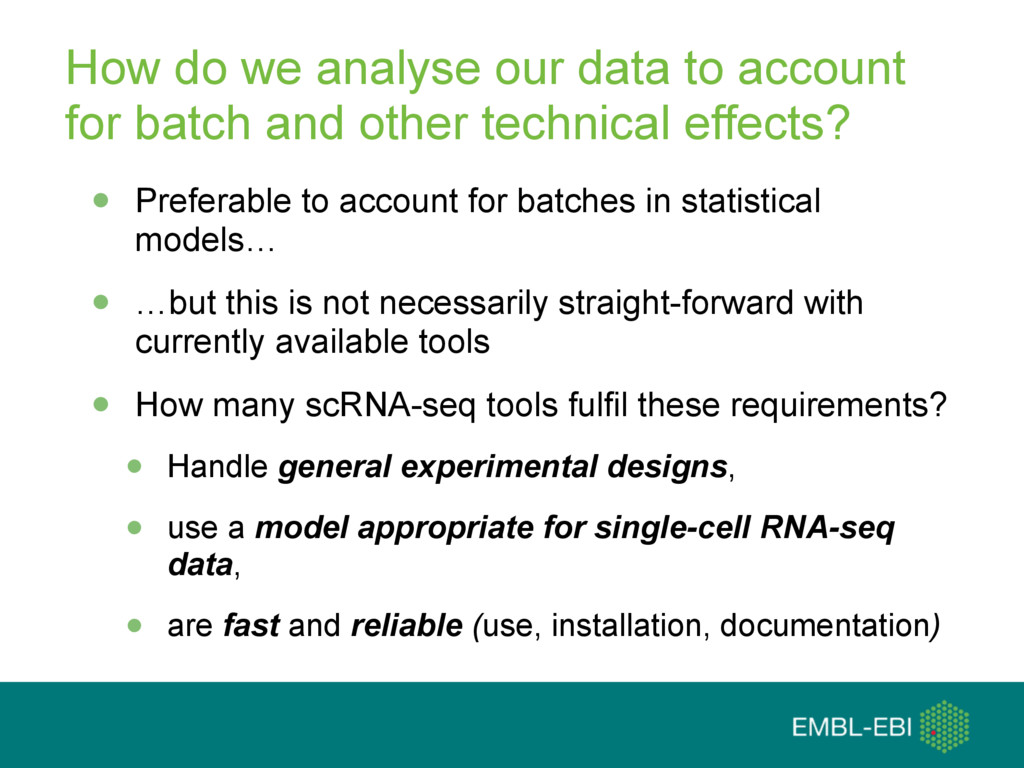
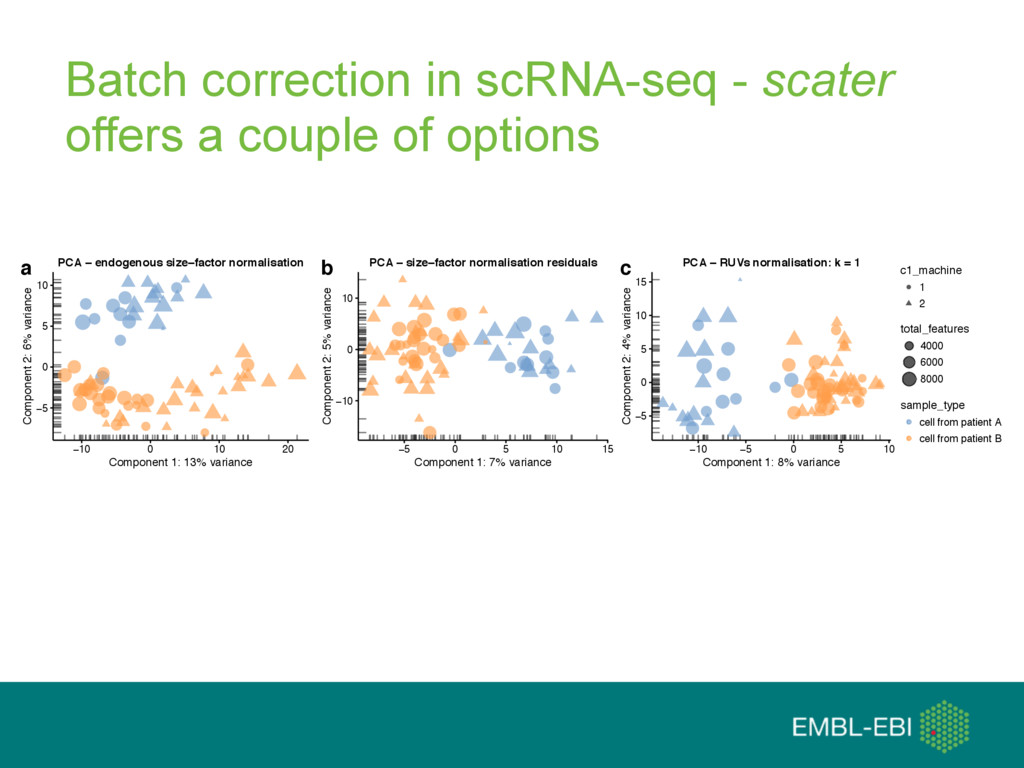
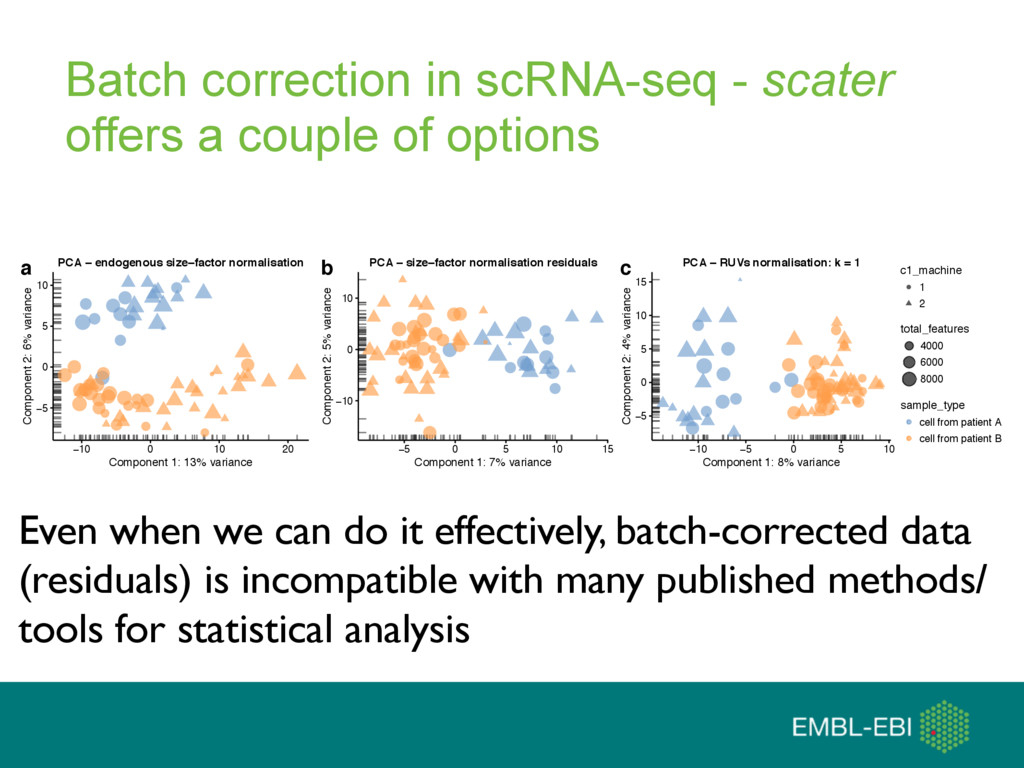
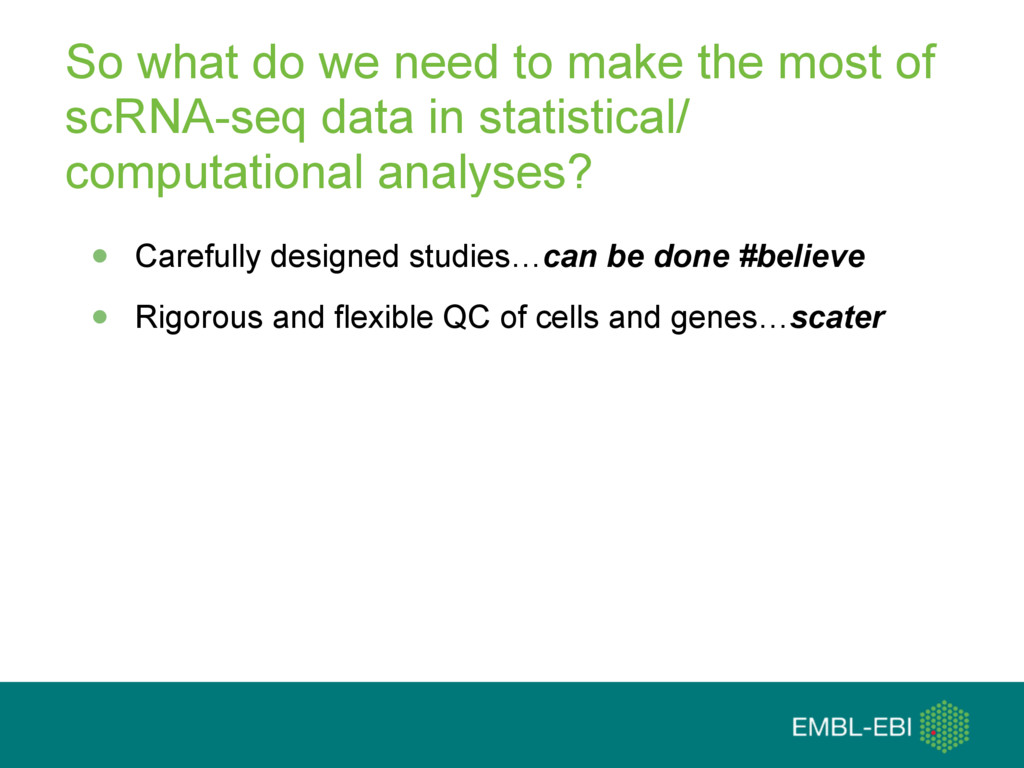
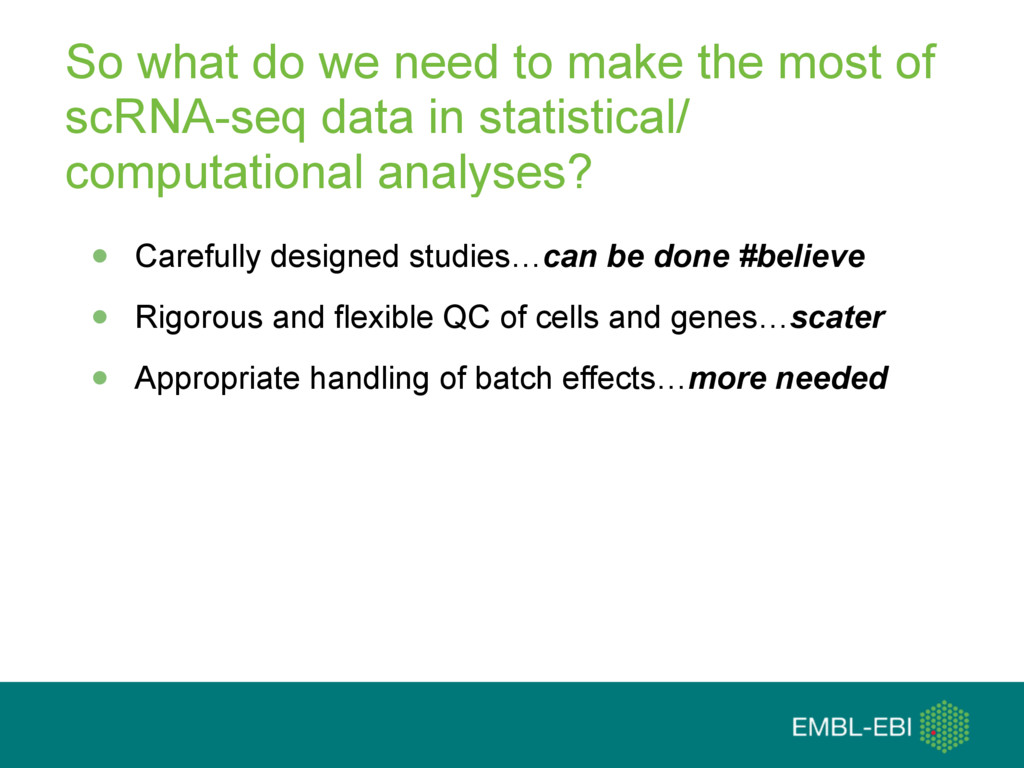
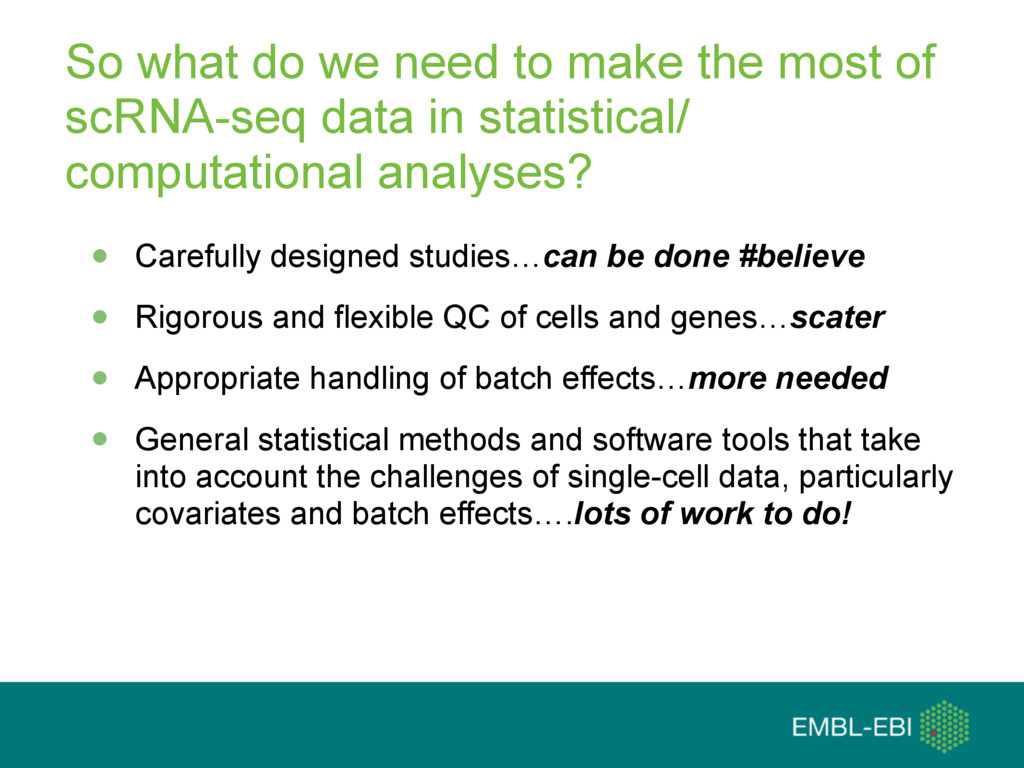
The talk focuses primarily on the R/Bioconductor package "scater" for pre-processing, quality control, normalisation and visualisation of single-cell RNA-seq data, but also addresses open questions in the field - such as the necessity of dealing with batch effects in our analyses and areas for future development of computational methods and tools.

Davis McCarthy

September 21, 2016
Tweet

More Decks by Davis McCarthy

Other Decks in Science

Transcript

  1. What do we need computationally so that we can make

    the most of single-cell RNA-seq data? Davis McCarthy NHMRC Early Career Fellow Stegle Group, EMBL-EBI @davisjmcc www.ebi.ac.uk
  2. Solid Tissue Dissociation Single Cell Isolation RNA RT& Second-strand Synthesis

    Amplified RNA cDNA Amplified cDNA Sequencing Library Sequencing Single-cell Expression Profiles Cell Types Identification IVT RT PCR OR Clustering Single Cell RNA Sequencing Workflow CAAGTTCCTACAGCTA AGTCCATGCCCATCCG AATCGGACTTCAGCCT GACCTAAGCCATCAGA AATCCTAGCATCCAGC ACCGTTACATCAACAG ATTCGATAACGACCAT CATGCCATTGACGATT Single-cell RNA sequencing https://en.wikipedia.org/wiki/File:RNA-Seq_workflow-5.pdf
  3. Differentiation to mouse mesoderm (Scialdone et al, Nature, 2016) Visualisation

    with scater package Flk1+ Pou5f1 (Oct4) Expression
  4. Differentiation to mouse mesoderm (Scialdone et al, Nature, 2016) Visualisation

    with scater package CD41+ Pou5f1 (Oct4) Expression
  5. Differentiation to mouse mesoderm (Scialdone et al, Nature, 2016) Visualisation

    with scater package CD41+ Pou5f1 (Oct4) Expression
  6. scRNA-seq data is high-resolution and high- dimensional. What can we

    do with it? Mouse mesoderm data (Scialdone et al, 2016) ENSMUSG00000024406_Pou5f1 0.0 2.5 5.0 7.5 0 300 600 900 DPT_rank Expression [log2(cpm + 1)] cellCategory E6.5 PS-Flk1+ NP-Flk1+ NP-CD41+Flk1+ NP-CD41+Flk1- HF-Flk1+ HF-CD41+Flk1+ HF-CD41+Flk1- Pou5f1 expression against diffusion pseudotime
  7. So if we want general methods that make the most

    of single-cell RNA-seq data to infer gene regulation relationships, differential expression, sub-populations, etc… https://giphy.com/gifs/thebachelorette-yeah-um-uh-3o7TKVaVwWwRJjmJOg …we have some work to do.
  8. So if we want general methods that make the most

    of single-cell RNA-seq data to infer gene regulation relationships, differential expression, sub-populations, etc… https://giphy.com/gifs/thebachelorette-yeah-um-uh-3o7TKVaVwWwRJjmJOg …we have some work to do.
  9. What do we need? Well-posed question(s) Answers with understanding of

    uncertainty the right data good statistical model
  10. What do we need? Well-posed question(s) Answers with understanding of

    uncertainty the right data software tools good statistical model
  11. What do we need? Well-posed question(s) Answers with understanding of

    uncertainty the right data software tools good statistical model +
  12. What do we need? Well-posed question(s) Answers with understanding of

    uncertainty the right data software tools good statistical model +
  13. Let’s imagine that we carry out our well- designed study…

    …and get good-quality sequence data to analyse.
  14. We need to conduct careful pre-processing, QC and normalisation before

    getting to any downstream analyses Raw data Pre-processing Quality control Downstream analysis e.g. expression quantification Normalisation
  15. How do we QC our data? • This depends on

    context, so is hands on • Visualise it
  16. How do we QC our data? • This depends on

    context, so is hands on • Visualise it • Calculate gene-level and cell-level QC metrics
  17. How do we QC our data? • This depends on

    context, so is hands on • Visualise it • Calculate gene-level and cell-level QC metrics • Use QC metrics to filter out potentially problematic genes and cells
  18. scater: R/Bioconductor package for pre- processing, QC, normalisation and visualisation

    • http://bioconductor.org/packages/scater/
 • bioRxiv pre-print: http://dx.doi.org/10.1101/069633
 • “A step-by-step workflow for low-level analysis of single-cell RNA-seq data": 
 http://f1000research.com/articles/5-2122/v1

  19. scater workflow: powerful and flexible scater pre-processing and quality control

    workflow From raw RNA-seq reads to a clean, tidy dataset ready for downstream analysis Raw RNA-seq Reads [Fastq format] Summarised feature expression values [e.g. produced by bioinformatics core] runKallisto/ readKallisto runSalmon/readSalmon newSCESet Plotting methods plot plotQC plotPCA plotTSNE plotMDS plotDiffusionMap plotReducedDim plotExpression plotPhenoData plotFeatureData plotMetadata Filtered SCESet Tidy filtered and normalised SCESet Downstream modelling and statistical analysis 1. Obtain RNA-seq expression data 2. QC and filter features 3. QC and filter cells 4. Simple normalisation 5. QC of explanatory variables SCESet [Container: S4 class inheriting Bioconductor’s ExpressionSet] Object that contains assay data, phenotype data, feature data, and more, for single-cell analysis (6. Further normalisation) QC methods calculateQCMetrics Miscellaneous methods getBMFeatureAnnos summariseExprsAcross Features Normalisation methods normaliseExprs normalise • Integrated with Salmon + kallisto • Automatic calculation of QC metrics • QC diagnostic plots • Cell and gene filtering • Simple normalisation • Sophisticated data structure for single-cell data • Beautiful plots • Shiny GUI
  20. scater QC’d SCESet object contains expression assay data, phenotype data,

    feature data, and more, for single-cell analysis Expression data from e.g. kallisto, Salmon, RSEM, featureCounts, HTSeq, etc. Cell and gene metadata from study design, expression quantification tool, etc. Normalisation BASiCS GRM scran Differential Expression BASiCS BPSC M3Drop MAST monocle scDD scde Heterogeneous Expression BASiCS scran Clustering PAGODA RaceID SC3 SINCERA Latent Variable Analysis cellCODE PEER RUVSeq svaseq Cell Cycle cyclone Pseudotime DeLorean destiny dpt embeddr monocle ouija SINCELL TSCAN scater ecosystem: take advantage of many other R/Bioconductor packages
  21. Little example # cells C1 Machine 1 C1 Machine 2

    Patient A 11 13 Patient B 25 24 For detailed case study see scater preprint on bioRxiv doi: http://dx.doi.org/10.1101/069633