Establishing Dynamic Measures of Built Environment Characteristics and their Relationship to Patterns of Socio-Spatial Structure
Alexandros N. Alexiou, PhD Cand.; Alex D. Singleton, Dr.
University of Liverpool, Dept. of Geography and Planning
Presented at the AAG Annual Meeting – Tampa, Florida, April 2014
to Patterns of Socio-Spatial Structure AAG Annual Meeting – Tampa, Florida, April 2014 Alexandros N. Alexiou* Dr Alex D. Singleton** - *PhD Candidate, University of Liverpool **Reader, University of Liverpool Dept. of Geography and Planning
classifications organise areal units into categories that share similarities across multiple socio-economic attributes. Some Developed Classifications: Private Classifications: MOSAIC (Experian), ACORN (CACI), P2 People and Places (BD), Claritas (PRiZM) and EuroDirect (CAMEO). Public Classifications: Output Area Classification (OAC), Urban - Rural Classification Similar products have also been created in academia Current methodologies established in the 1970s; although an extended history includes social area analysis, factorial ecologies, city classification studies, etc. There have been very few attempts to explore the spatial relationships between socio-economic and built environment (BE) measures Or the ways in which such physical measures can be created from new open data sources.
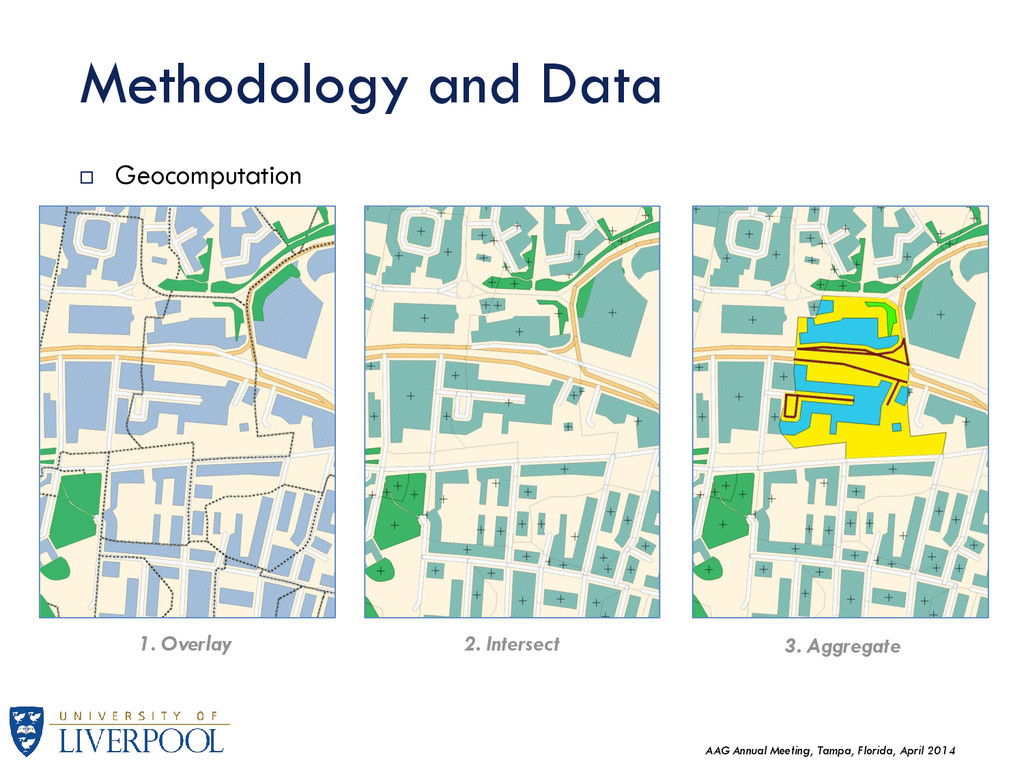
is extensive research on the topic of analysing relationships between the built environment (BE) and urban development patterns, such as the transportation - land use models, especially on the importance of local urban effects over the macroeconomic national and regional ones. Geographic sensitivity for example may be mediated by the overall transport connectivity of an area. Current classification systems include little to no input of such spatial attributes: some physical attributes are reflected by census data (e.g. type of housing), their impacts however has not been evaluated in any systematic way. Future censuses may not produce the same amount of data detail. Geocomputation can provide a means to calculate new attributes, given: the advances in computational power and relevant software; an increasing availability of open geographical data.
research explores the generation of BE characteristics and a methodological approach of building an extended geodemographic model, Including their correlation with existing geodemographic classifications as a means of evaluation. Such inputs could be used in future classifications, increasing robustness and helping alleviate dependence on census data. The theoretical framework is the concept that people live in places that reflect their current needs and socio-economic statuses. For instance, connectivity is arguably a key feature in shaping urban residential dynamics and socio-spatial segregation historically (e.g. Chicago vs. Los Angeles). Many physical characteristics of an area are important to residential decisions (i.e. transit, parks, densities, etc). The importance of physical attributes in socio-spatial patterns can be illustrated in the following geodemographic clusters from the UK:
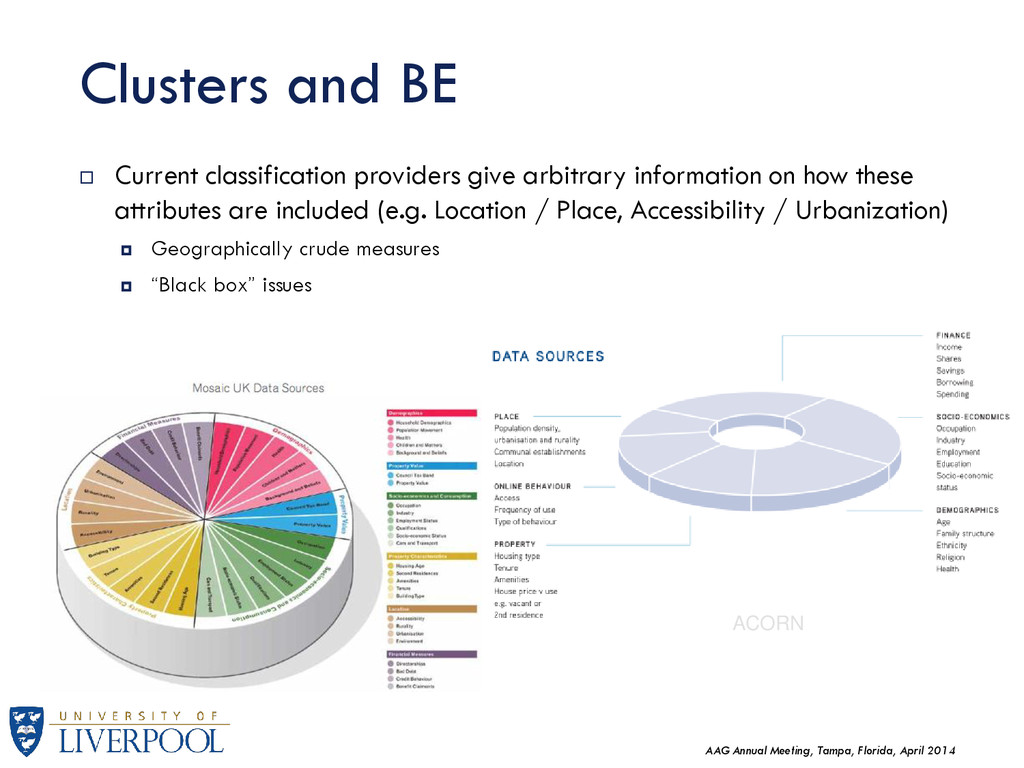
Current classification providers give arbitrary information on how these attributes are included (e.g. Location / Place, Accessibility / Urbanization) Geographically crude measures “Black box” issues ACORN
The main goal is to introduce measures of BE or physical context, and explore these within the 2001 Output Area Classifications (OAC). Data was provided by the Ordnance Survey under the Open Database License (ODbL), while the 2001 Output Area Classifications were provided by the UK Data Service for academic use. Data from openstreetmaps.org where also examined but not used in the final classification. England has been selected as a geographical area of analysis which includes 165,665 Output Areas corresponding to the 2001 census. The analysis was mainly carried out using the “R” software package. QGIS (Quantum GIS) was used for geographical data exploration. A geo-computational approach is used to calculate most of these measures (calculated for every Output Area polygon).
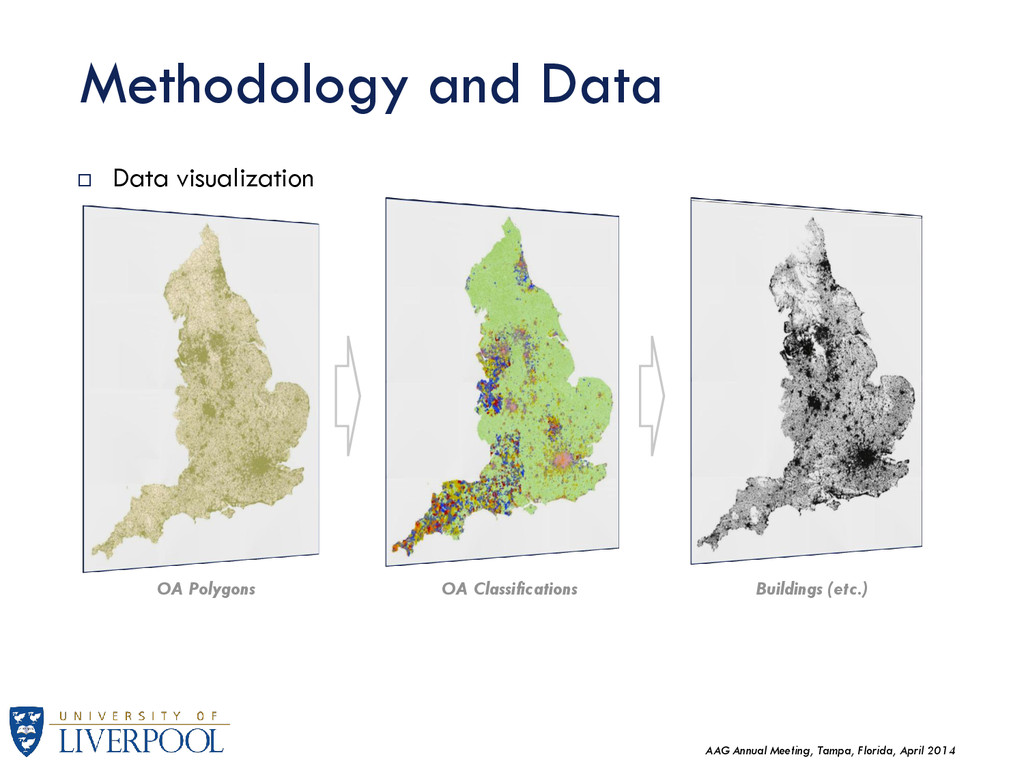
There are many BE attributes to be considered, but for this research we focus on three broad categories: Street Network Buildings and Densities Green Spaces Other Variables: OAC classifications Super-group Level (7 Classes) Group Level (21 Classes) Sub-group Level (52 Classes) National Socio-economic Classification (8 Classes – by population amount) Population (including household / communal population) Available data is summarized in the following figure:
Census Output Areas (2001) Population OAC Super- (7), Group (21), Sub- (52) Street Network (km) Major Roads Motorways Primary Roads A Roads Minor Roads B Roads Local Street Minor Street Buildings (Blocks) (he) Density (pop/he) Gross Density (per OA surface) Net Density (per built surface) Green Spaces Area (he) Road Intersections per OA perimeter length Distance from Coast NSeC Ratio – (8 Classes, Total population per class) Pedestrian network length Railroad Access Airport Proximity Household/ Communal Population Ratio Reference Unit Tier 1 Tier 2 Tier 3 Additional Variables
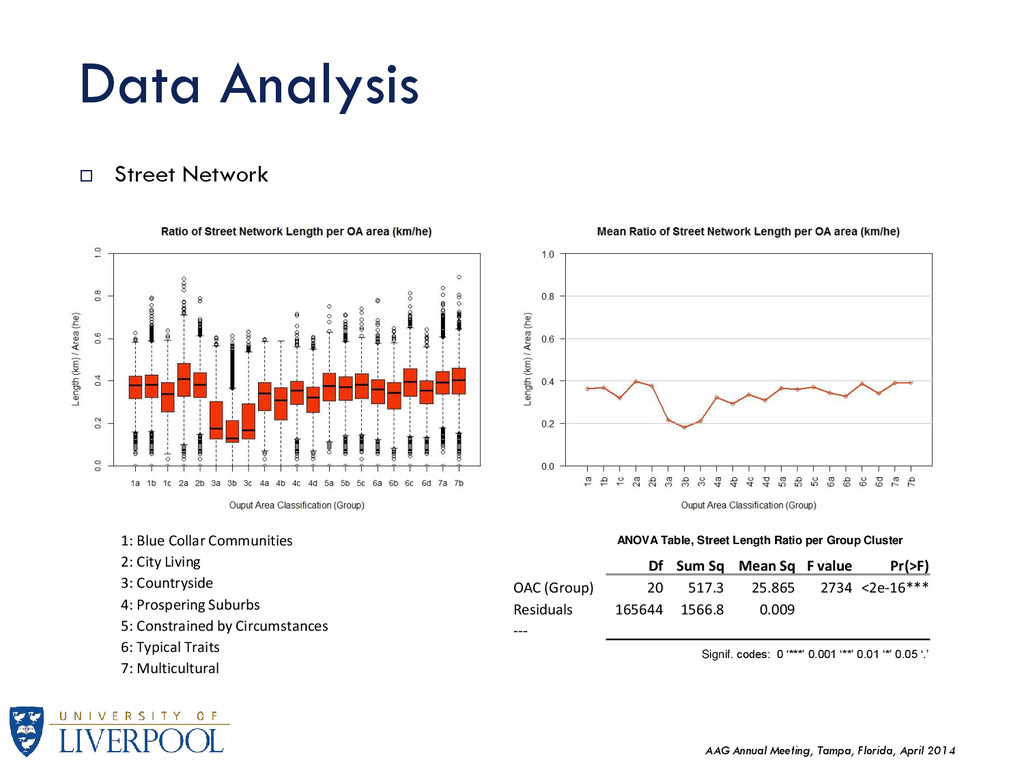
Street Network Df Sum Sq Mean Sq F value Pr(>F) OAC (Group) 20 517.3 25.865 2734 <2e-16*** Residuals 165644 1566.8 0.009 --- Signif. codes: 0 ‘***’ 0.001 ‘**’ 0.01 ‘*’ 0.05 ‘.’ ANOVA Table, Street Length Ratio per Group Cluster 1: Blue Collar Communities 2: City Living 3: Countryside 4: Prospering Suburbs 5: Constrained by Circumstances 6: Typical Traits 7: Multicultural
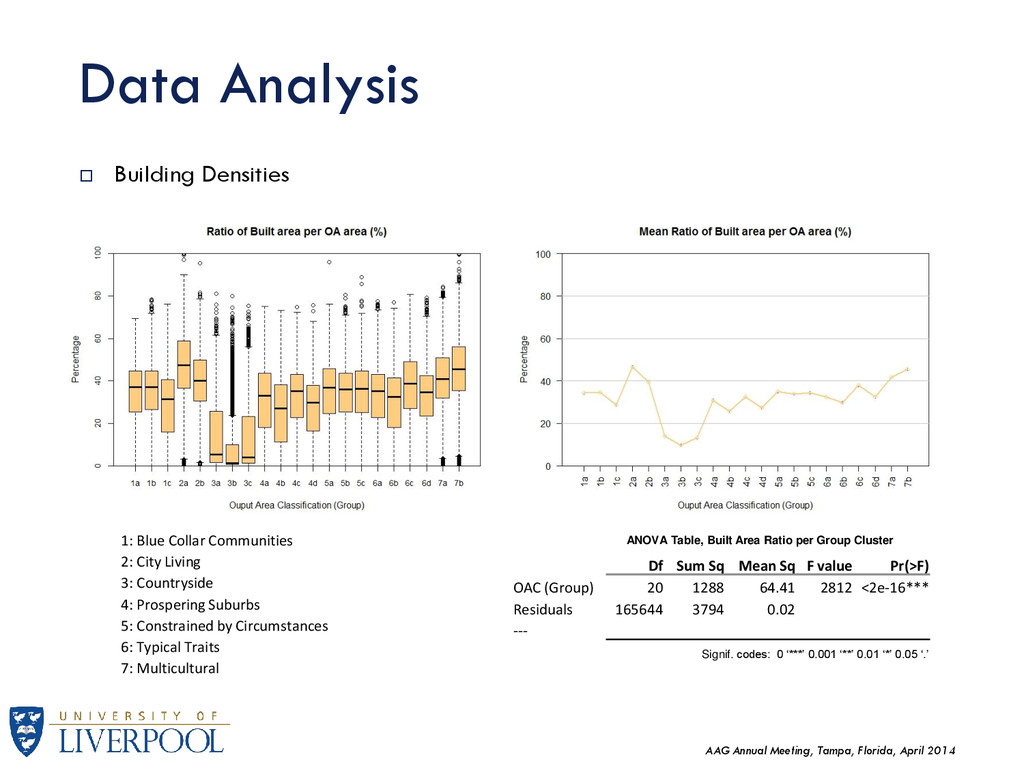
Building Densities Df Sum Sq Mean Sq F value Pr(>F) OAC (Group) 20 1288 64.41 2812 <2e-16*** Residuals 165644 3794 0.02 --- Signif. codes: 0 ‘***’ 0.001 ‘**’ 0.01 ‘*’ 0.05 ‘.’ ANOVA Table, Built Area Ratio per Group Cluster 1: Blue Collar Communities 2: City Living 3: Countryside 4: Prospering Suburbs 5: Constrained by Circumstances 6: Typical Traits 7: Multicultural
Green spaces Df Sum Sq Mean Sq F value Pr(>F) OAC (Group) 20 47 2.3493 487.9 <2e-16*** Residuals 165644 797.6 0.0048 --- Signif. codes: 0 ‘***’ 0.001 ‘**’ 0.01 ‘*’ 0.05 ‘.’ ANOVA Table, Green Space Ratio per Group Cluster 1: Blue Collar Communities 2: City Living 3: Countryside 4: Prospering Suburbs 5: Constrained by Circumstances 6: Typical Traits 7: Multicultural
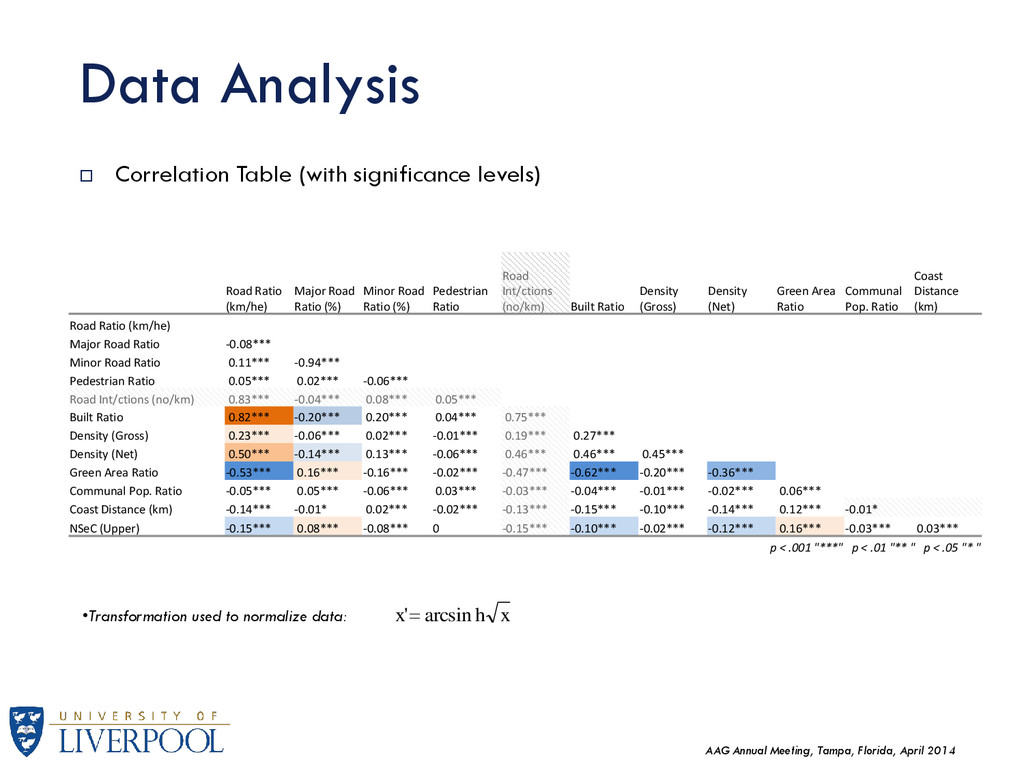
used to normalize data: x h x arcsin ' Correlation Table (with significance levels) Road Ratio (km/he) Major Road Ratio (%) Minor Road Ratio (%) Pedestrian Ratio Road Int/ctions (no/km) Built Ratio Density (Gross) Density (Net) Green Area Ratio Communal Pop. Ratio Coast Distance (km) Road Ratio (km/he) Major Road Ratio -0.08*** Minor Road Ratio 0.11*** -0.94*** Pedestrian Ratio 0.05*** 0.02*** -0.06*** Road Int/ctions (no/km) 0.83*** -0.04*** 0.08*** 0.05*** Built Ratio 0.82*** -0.20*** 0.20*** 0.04*** 0.75*** Density (Gross) 0.23*** -0.06*** 0.02*** -0.01*** 0.19*** 0.27*** Density (Net) 0.50*** -0.14*** 0.13*** -0.06*** 0.46*** 0.46*** 0.45*** Green Area Ratio -0.53*** 0.16*** -0.16*** -0.02*** -0.47*** -0.62*** -0.20*** -0.36*** Communal Pop. Ratio -0.05*** 0.05*** -0.06*** 0.03*** -0.03*** -0.04*** -0.01*** -0.02*** 0.06*** Coast Distance (km) -0.14*** -0.01* 0.02*** -0.02*** -0.13*** -0.15*** -0.10*** -0.14*** 0.12*** -0.01* NSeC (Upper) -0.15*** 0.08*** -0.08*** 0 -0.15*** -0.10*** -0.02*** -0.12*** 0.16*** -0.03*** 0.03*** p < .001 "***" p < .01 "** " p < .05 "* "
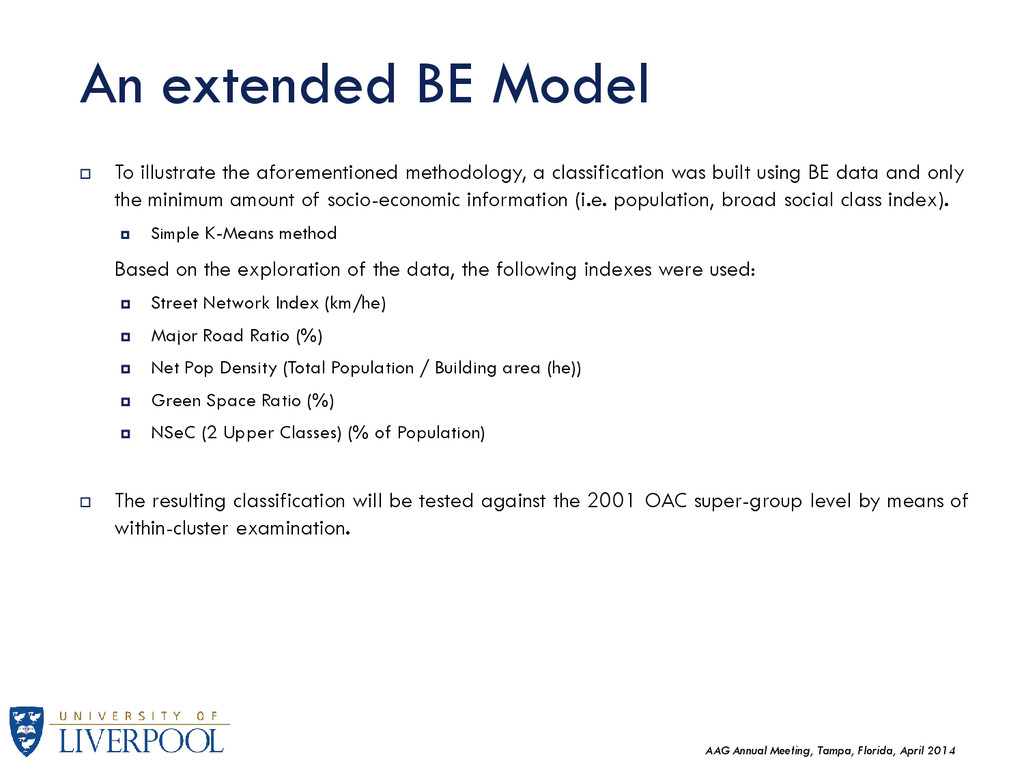
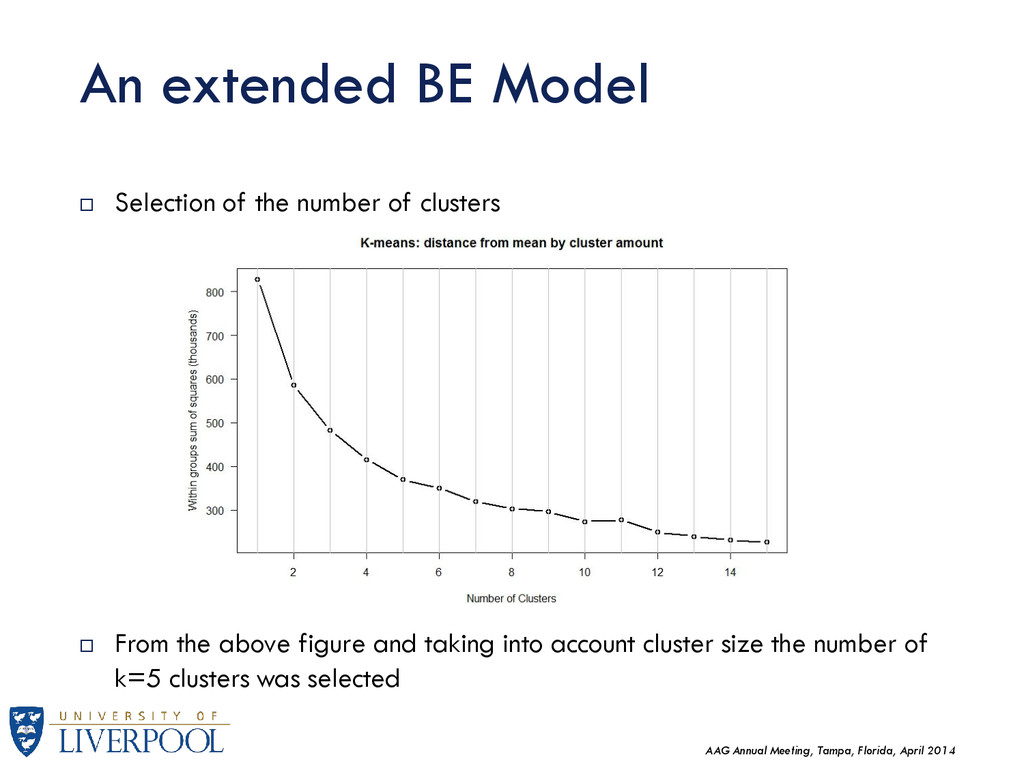
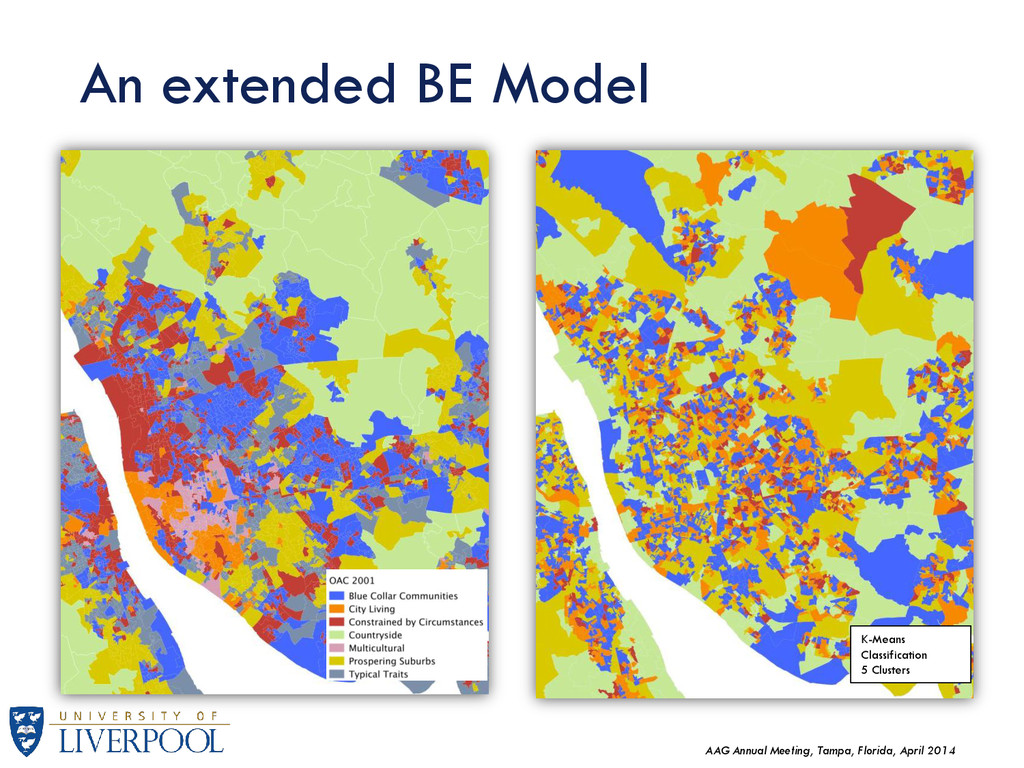
the aforementioned methodology, a classification was built using BE data and only the minimum amount of socio-economic information (i.e. population, broad social class index). Simple K-Means method Based on the exploration of the data, the following indexes were used: Street Network Index (km/he) Major Road Ratio (%) Net Pop Density (Total Population / Building area (he)) Green Space Ratio (%) NSeC (2 Upper Classes) (% of Population) The resulting classification will be tested against the 2001 OAC super-group level by means of within-cluster examination. An extended BE Model
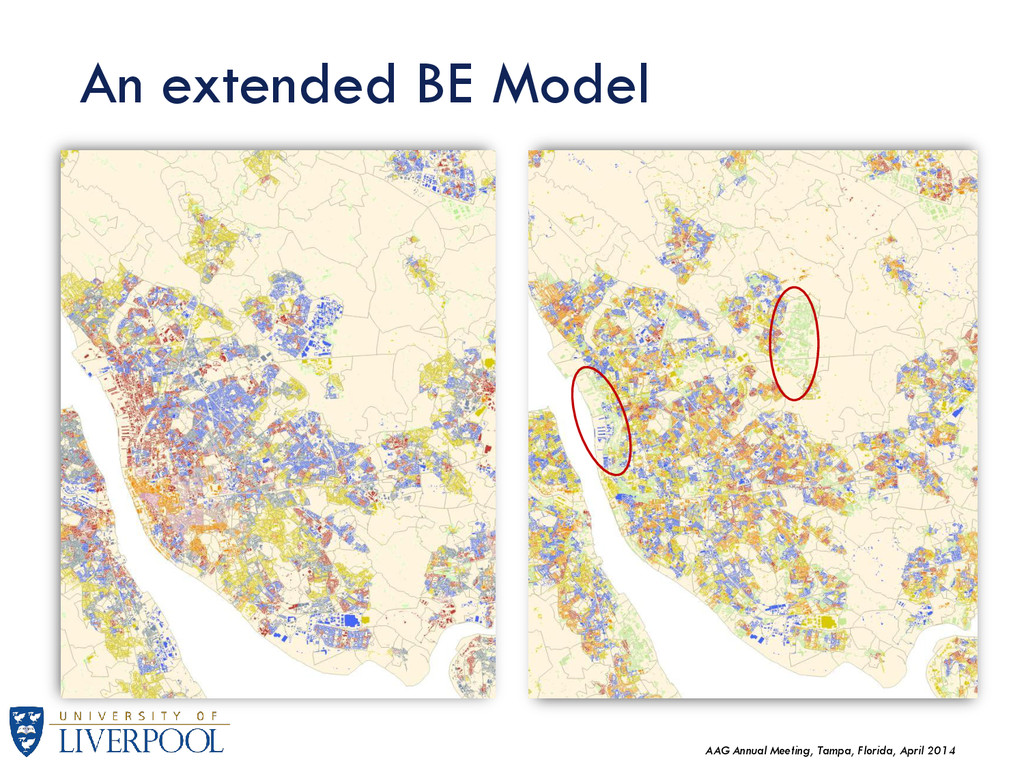
These preliminary results show some level of differentiation along the BE dimensions proposed. In general, the results indicate a dichotomy between what appears to be dense vs. sparse developed areas. Further research is needed to solidify indexes: K-means clustering is a widely used classifier but may not be well-suited for BE data distributions. Other classifiers should be explored, such as the multinomial logit model or supervised classifiers. Weighted measures can adjust the impact factor of a particular measure to the classifier. Spatial analysis to discern patterns, including near-geography indexes based on network analysis rather than Euclidian distance Aim to create a “BE Signature” of different measures along socio-economic profiles. These measures could act as an additional multi-dimensional that can help build robustness in current classification methodologies. BE can also incorporate sensitivity to near-geography quite effectively, addressing two common issues in geodemographic classifications: Ecological Fallacy Lack of Geographic Sensitivity
Tampa, Florida, April 2014 Acknowledgements: This work is funded as part of an ESRC PhD studentship and is in collaboration with the Office for National Statistics
![Thank you for your time [email protected] AAG Annual Meeting –](https://files.speakerdeck.com/presentations/bc2e3cf0ba6301318c00666f13e3b6f2/slide_24.jpg)