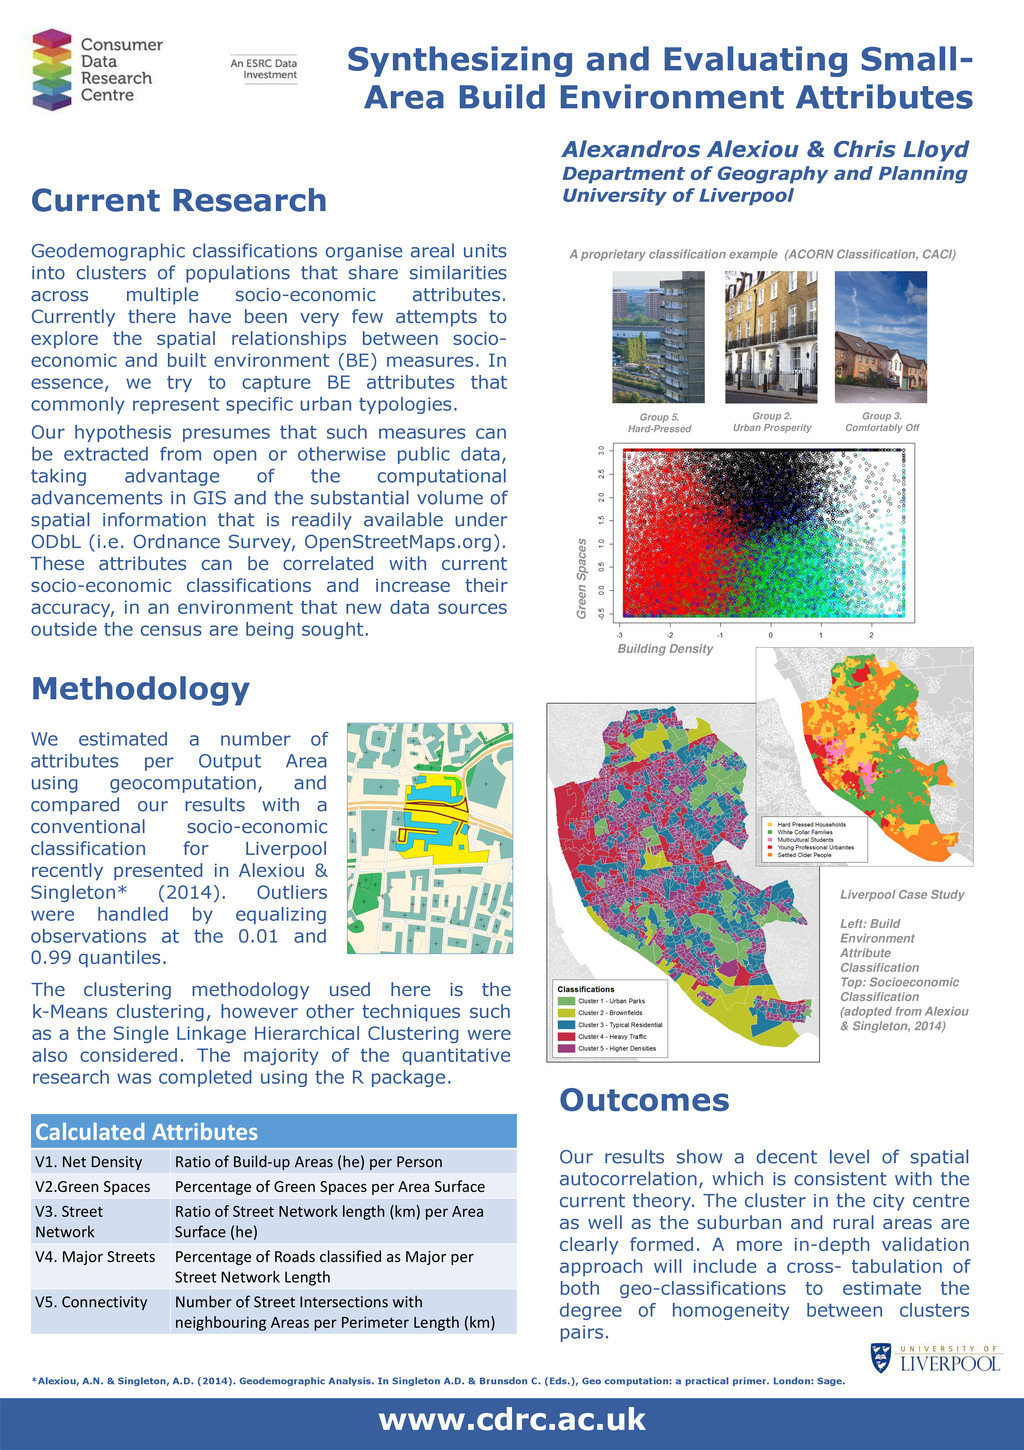
Geodemographic classifications organise areal units into clusters of populations that share similarities across multiple socio-economic attributes. Currently there have been very few attempts to explore the spatial relationships between socio- economic and built environment (BE) measures. In essence, we try to capture BE attributes that commonly represent specific urban typologies. Our hypothesis presumes that such measures can be extracted from open or otherwise public data, taking advantage of the computational advancements in GIS and the substantial volume of spatial information that is readily available under ODbL (i.e. Ordnance Survey, OpenStreetMaps.org). These attributes can be correlated with current socio-economic classifications and increase their accuracy, in an environment that new data sources outside the census are being sought. Alexandros Alexiou & Chris Lloyd Department of Geography and Planning University of Liverpool www.cdrc.ac.uk Methodology We estimated a number of attributes per Output Area using geocomputation, and compared our results with a conventional socio-economic classification for Liverpool recently presented in Alexiou & Singleton* (2014). Outliers were handled by equalizing observations at the 0.01 and 0.99 quantiles. Calculated Attributes V1. Net Density Ratio of Build-up Areas (he) per Person V2.Green Spaces Percentage of Green Spaces per Area Surface V3. Street Network Ratio of Street Network length (km) per Area Surface (he) V4. Major Streets Percentage of Roads classified as Major per Street Network Length V5. Connectivity Number of Street Intersections with neighbouring Areas per Perimeter Length (km) Group 2. Urban Prosperity Group 3. Comfortably Off Group 5. Hard-Pressed A proprietary classification example (ACORN Classification, CACI) The clustering methodology used here is the k-Means clustering, however other techniques such as a the Single Linkage Hierarchical Clustering were also considered. The majority of the quantitative research was completed using the R package. Outcomes Our results show a decent level of spatial autocorrelation, which is consistent with the current theory. The cluster in the city centre as well as the suburban and rural areas are clearly formed. A more in-depth validation approach will include a cross- tabulation of both geo-classifications to estimate the degree of homogeneity between clusters pairs. Liverpool Case Study Left: Build Environment Attribute Classification Top: Socioeconomic Classification (adopted from Alexiou & Singleton, 2014) Green Spaces Building Density *Alexiou, A.N. & Singleton, A.D. (2014). Geodemographic Analysis. In Singleton A.D. & Brunsdon C. (Eds.), Geo computation: a practical primer. London: Sage.