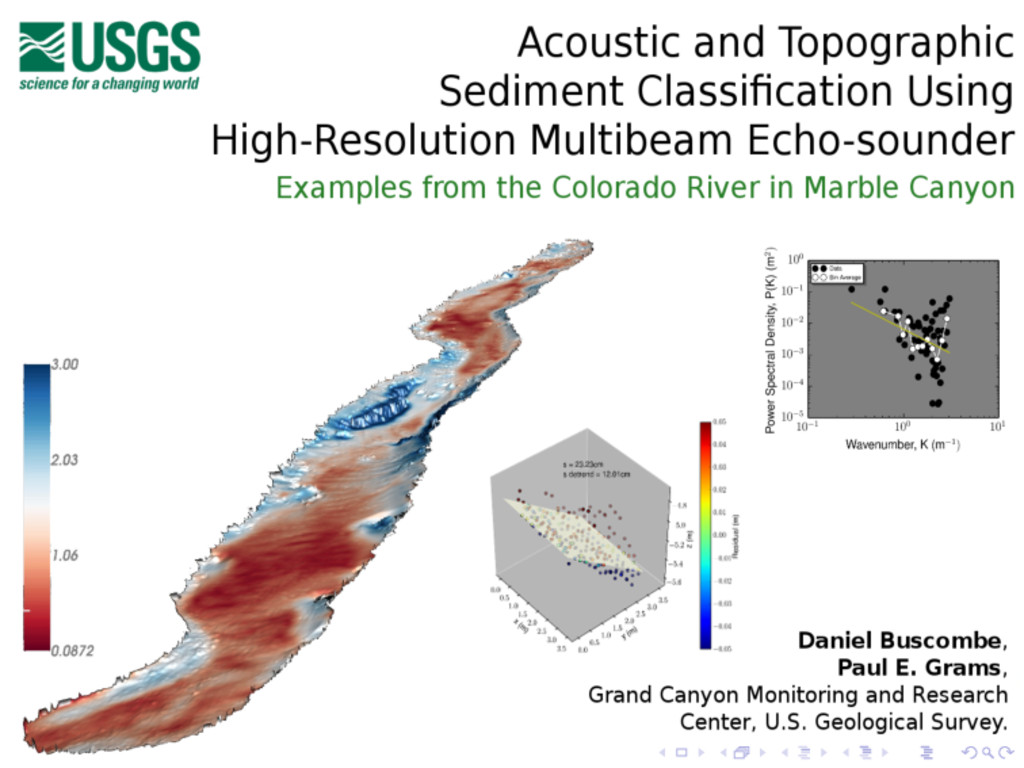
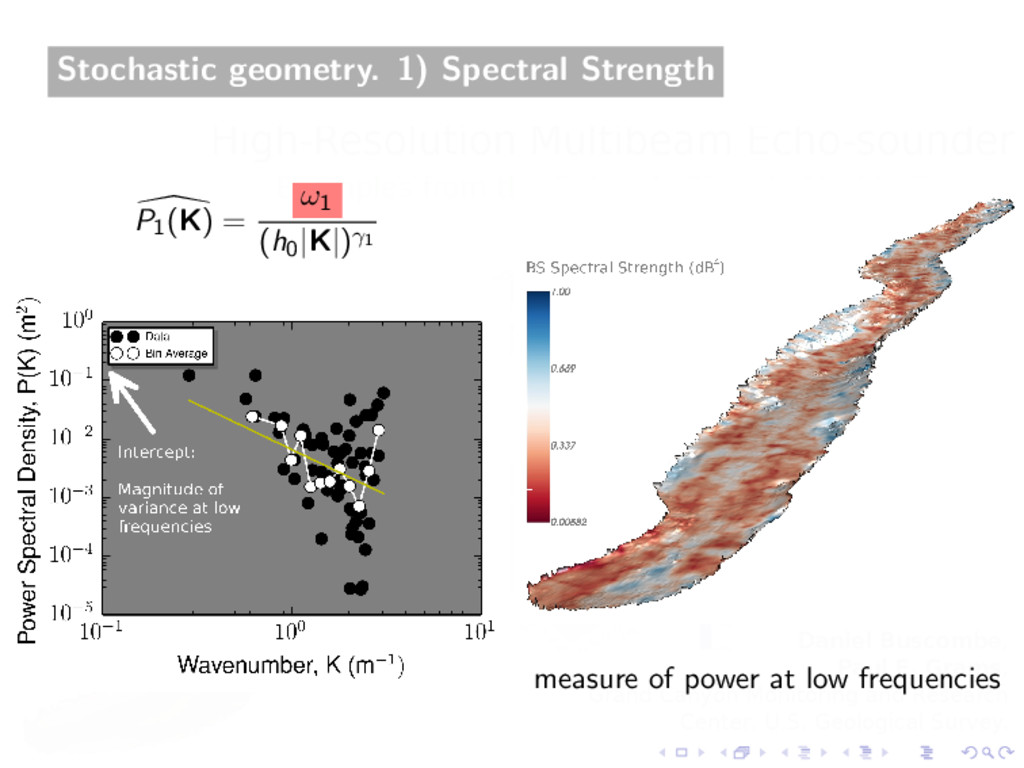
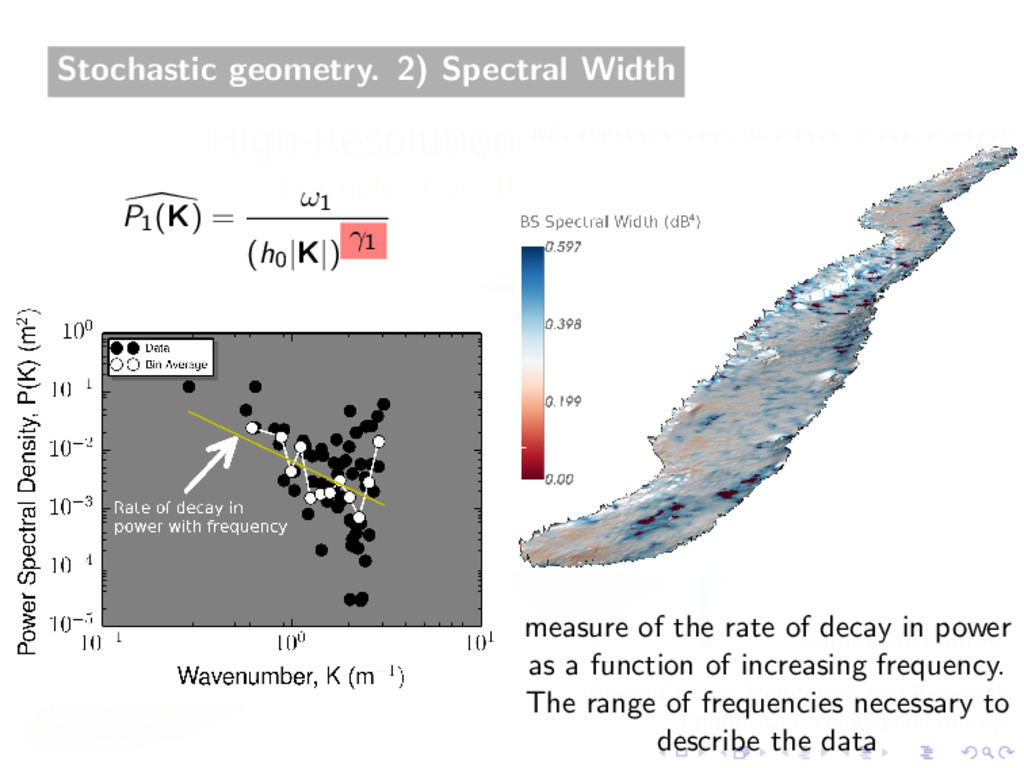
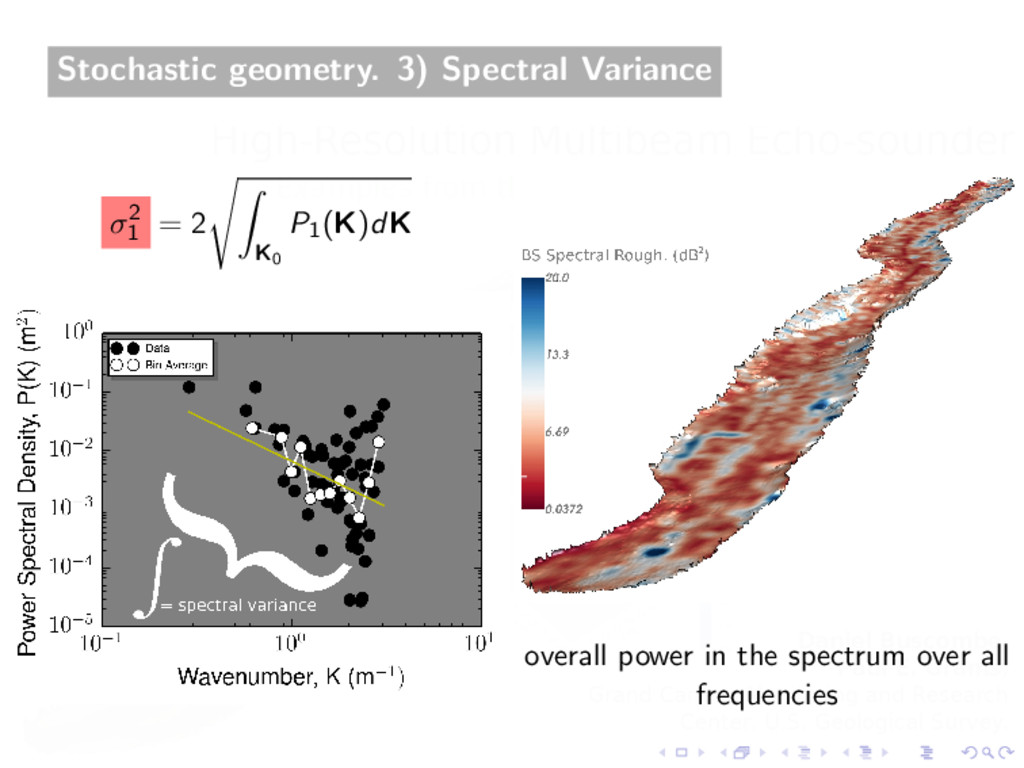
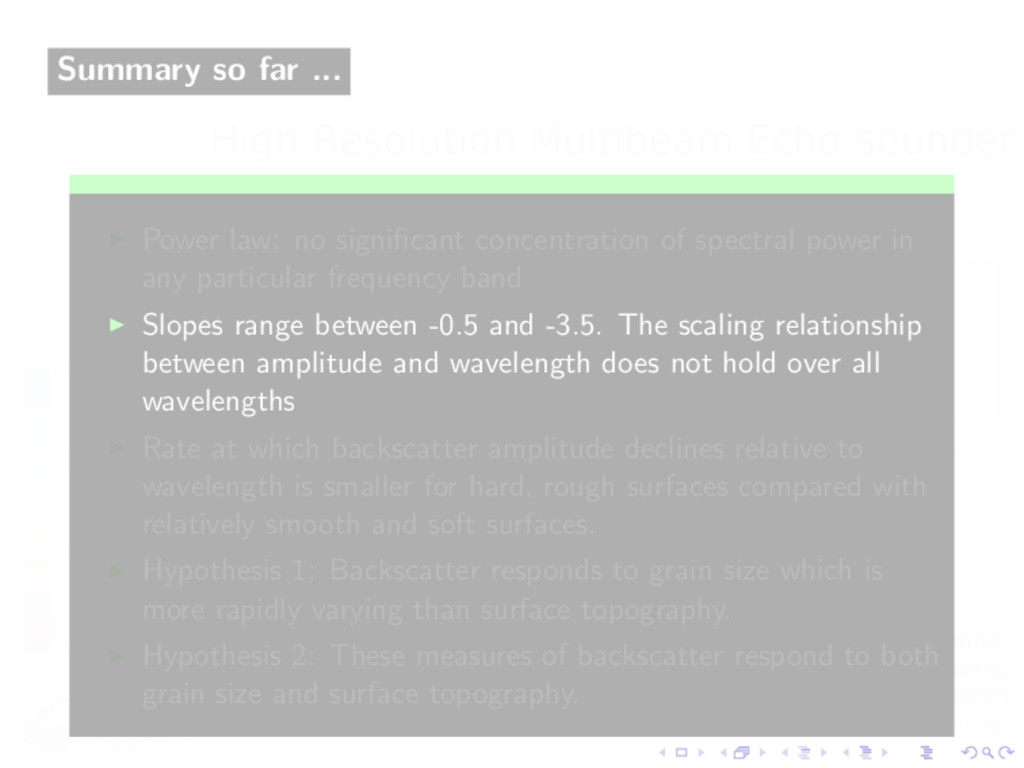
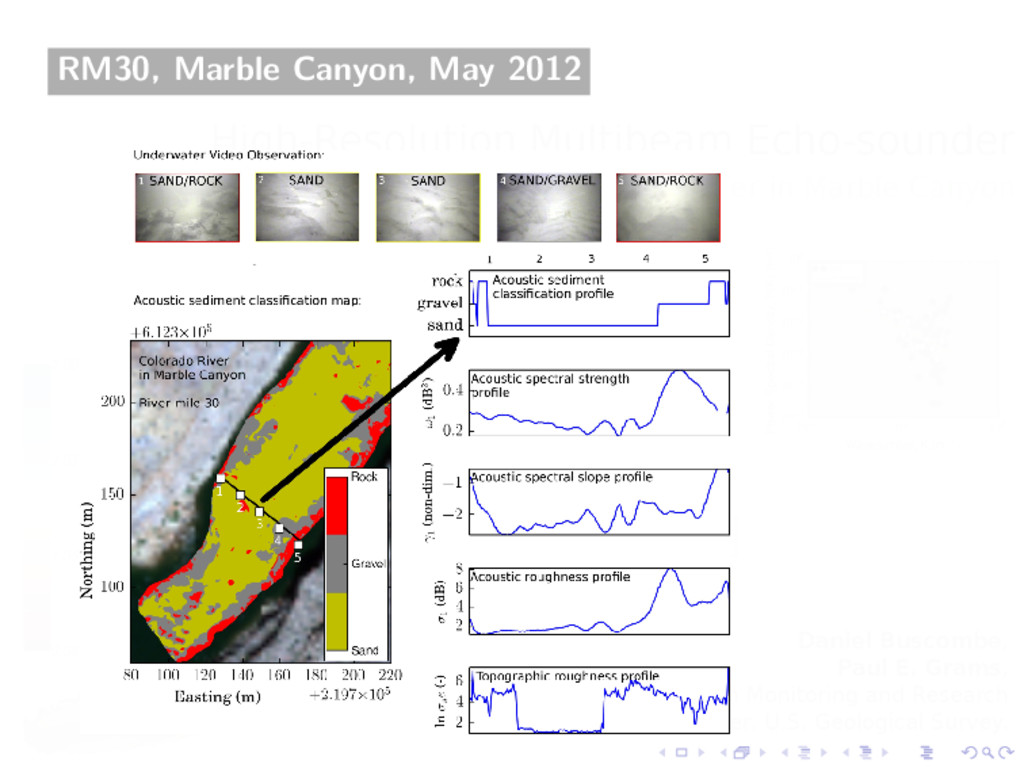
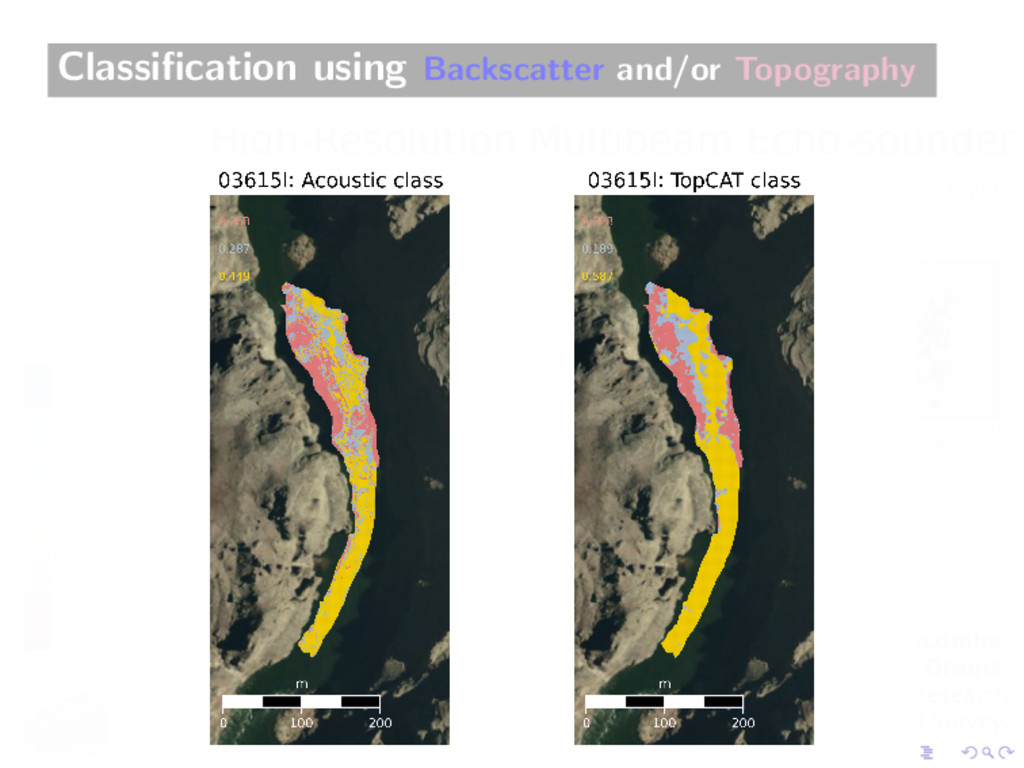
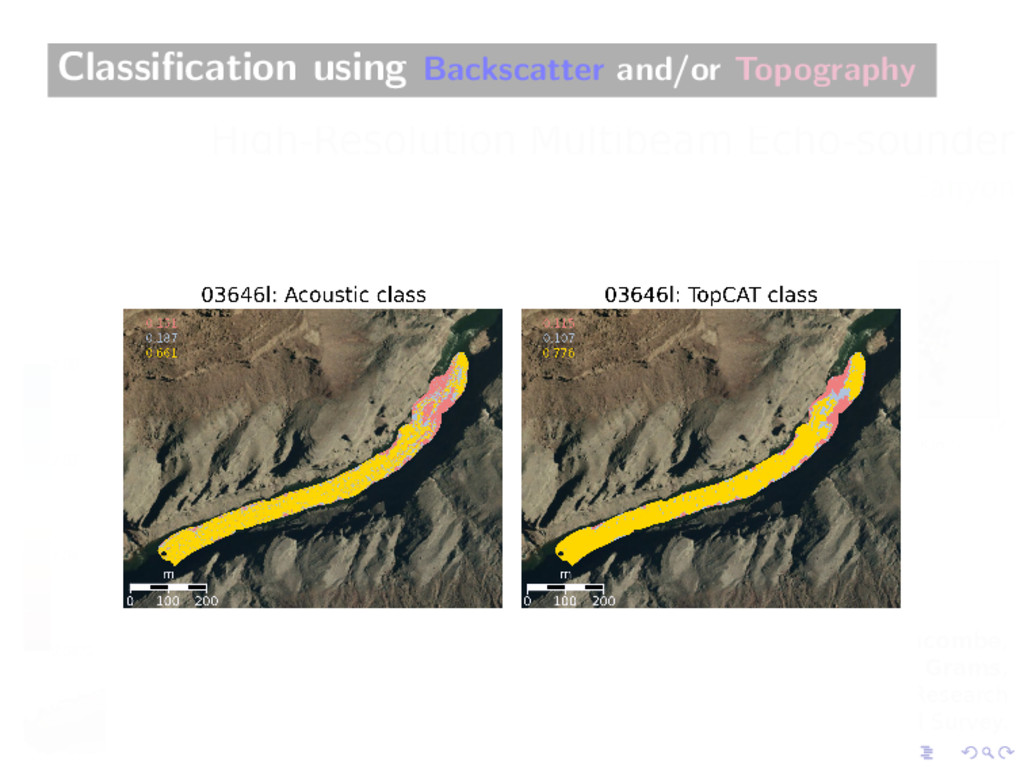
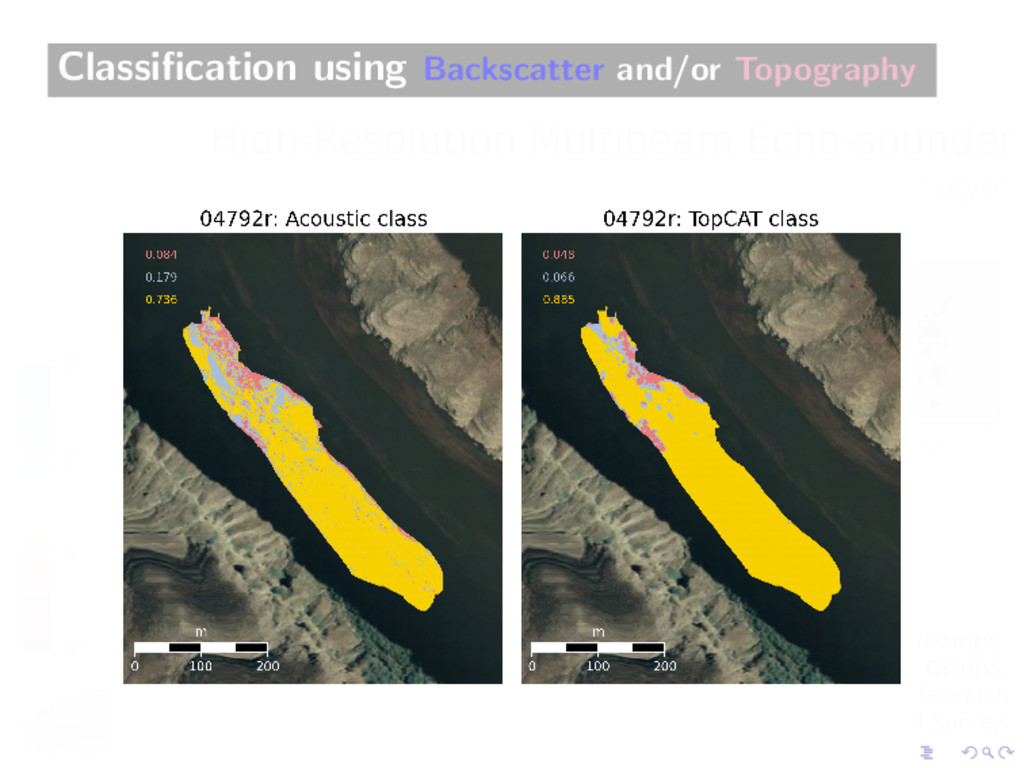
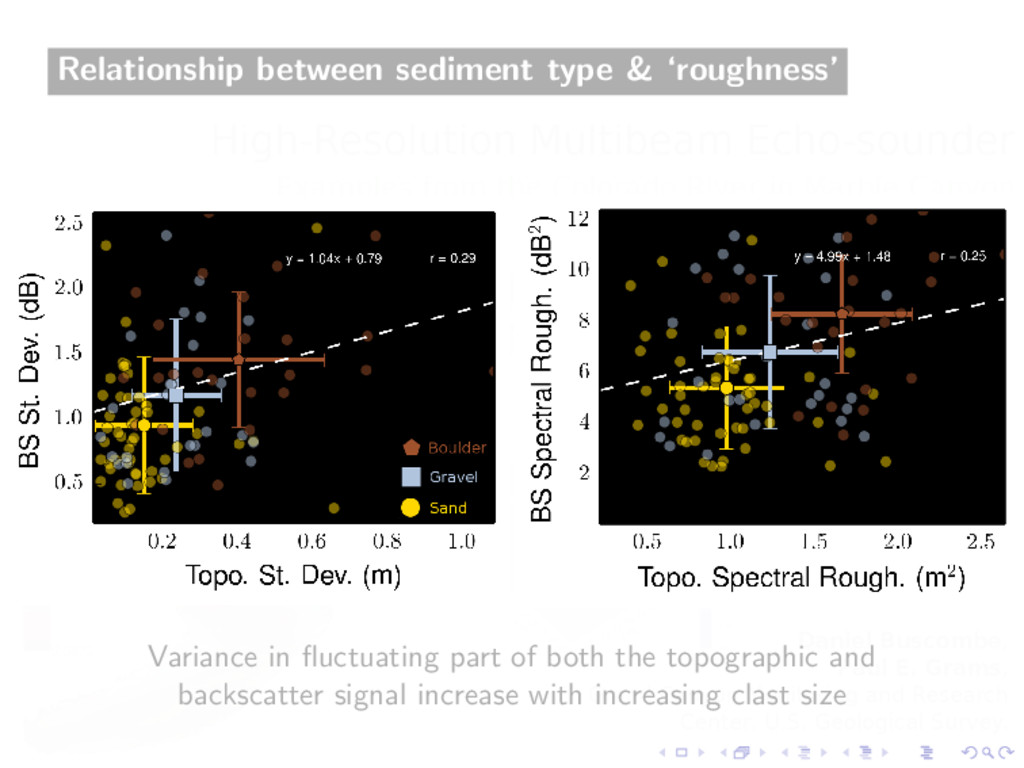
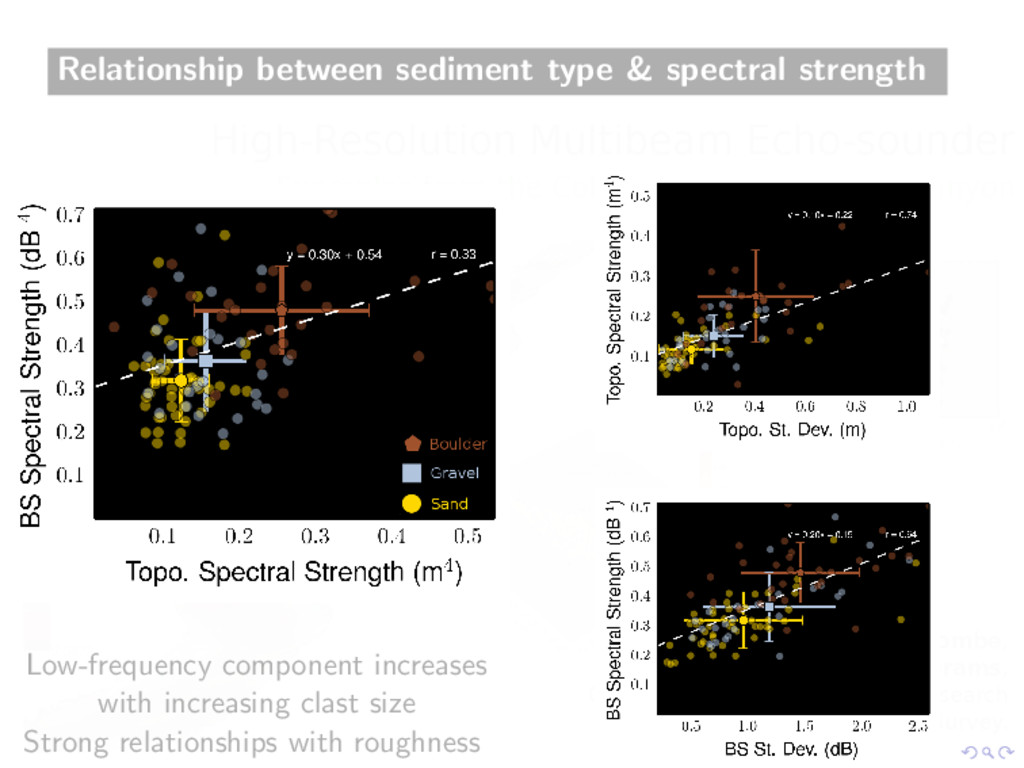
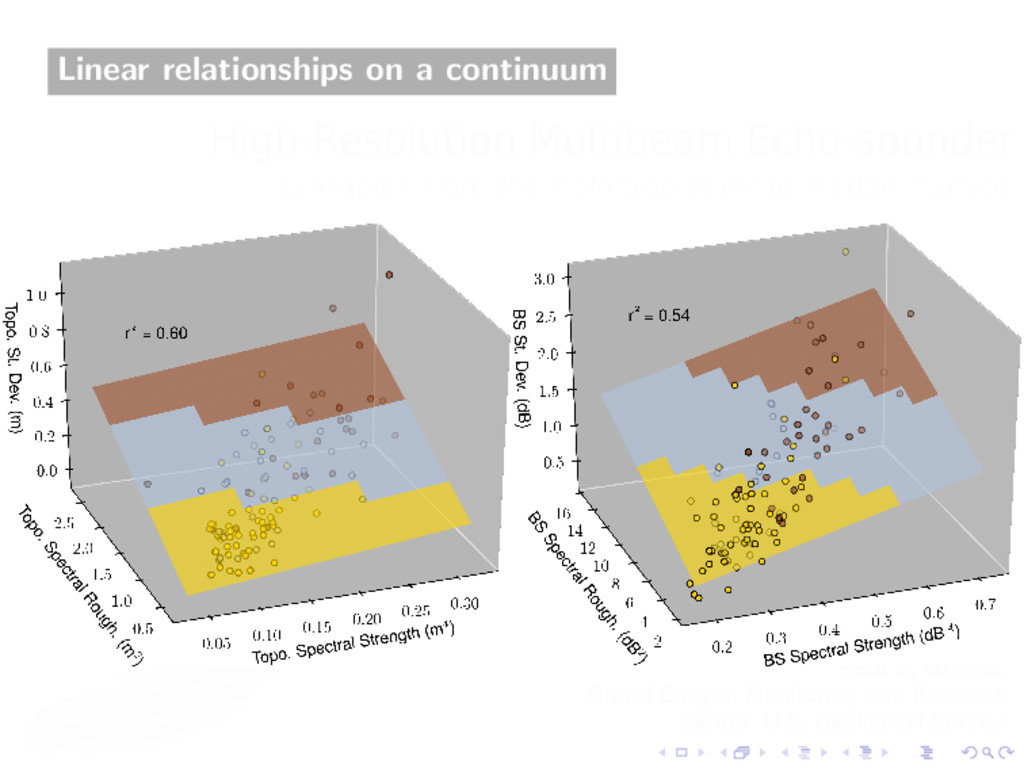
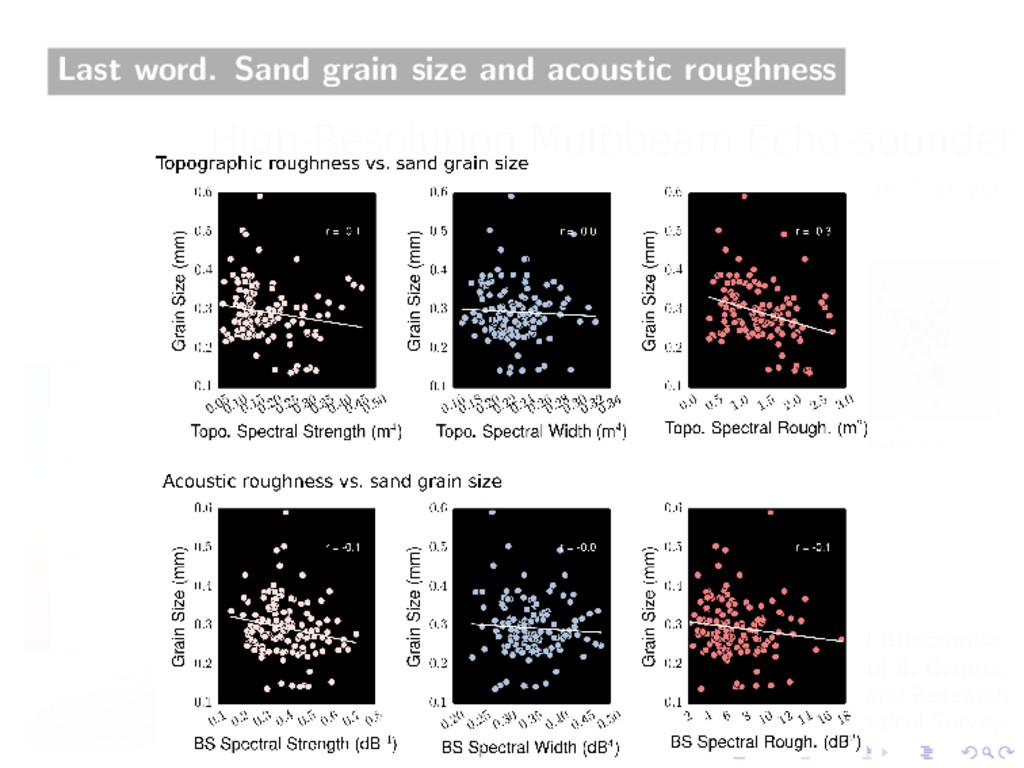
spectral power in any particular frequency band Slopes range between -0.5 and -3.5. The scaling relationship between amplitude and wavelength does not hold over all wavelengths Rate at which backscatter amplitude declines relative to wavelength is smaller for hard, rough surfaces compared with relatively smooth and soft surfaces. Hypothesis 1: Backscatter responds to grain size which is more rapidly varying than surface topography. Hypothesis 2: These measures of backscatter respond to both grain size and surface topography.
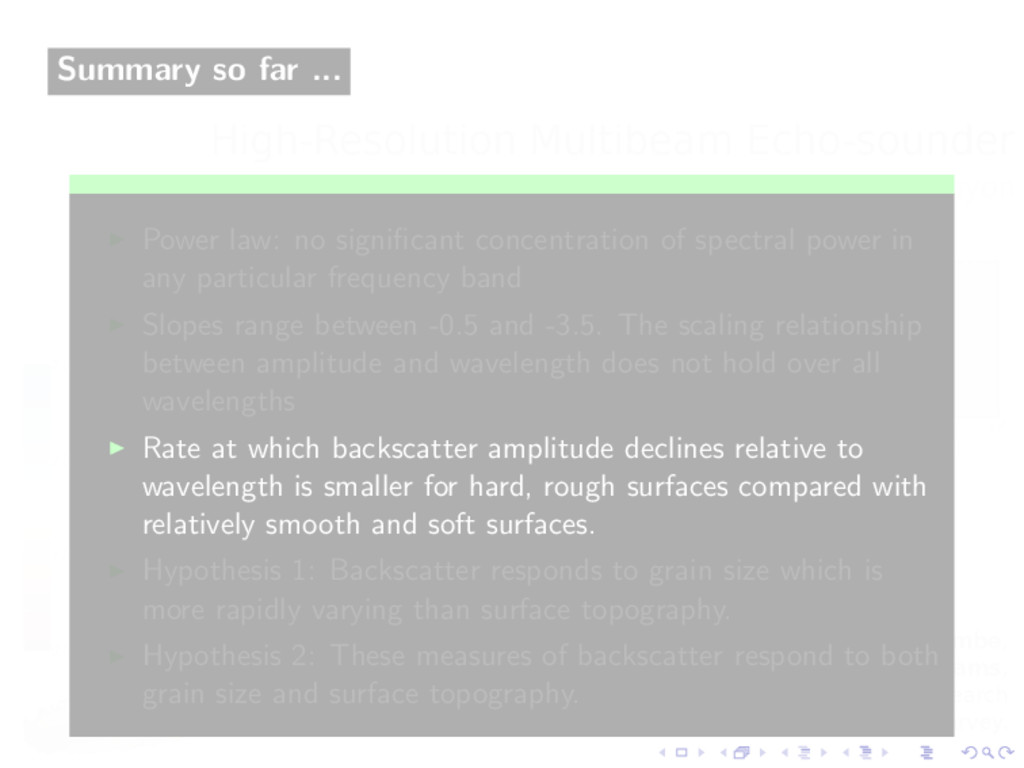
spectral power in any particular frequency band Slopes range between -0.5 and -3.5. The scaling relationship between amplitude and wavelength does not hold over all wavelengths Rate at which backscatter amplitude declines relative to wavelength is smaller for hard, rough surfaces compared with relatively smooth and soft surfaces. Hypothesis 1: Backscatter responds to grain size which is more rapidly varying than surface topography. Hypothesis 2: These measures of backscatter respond to both grain size and surface topography.
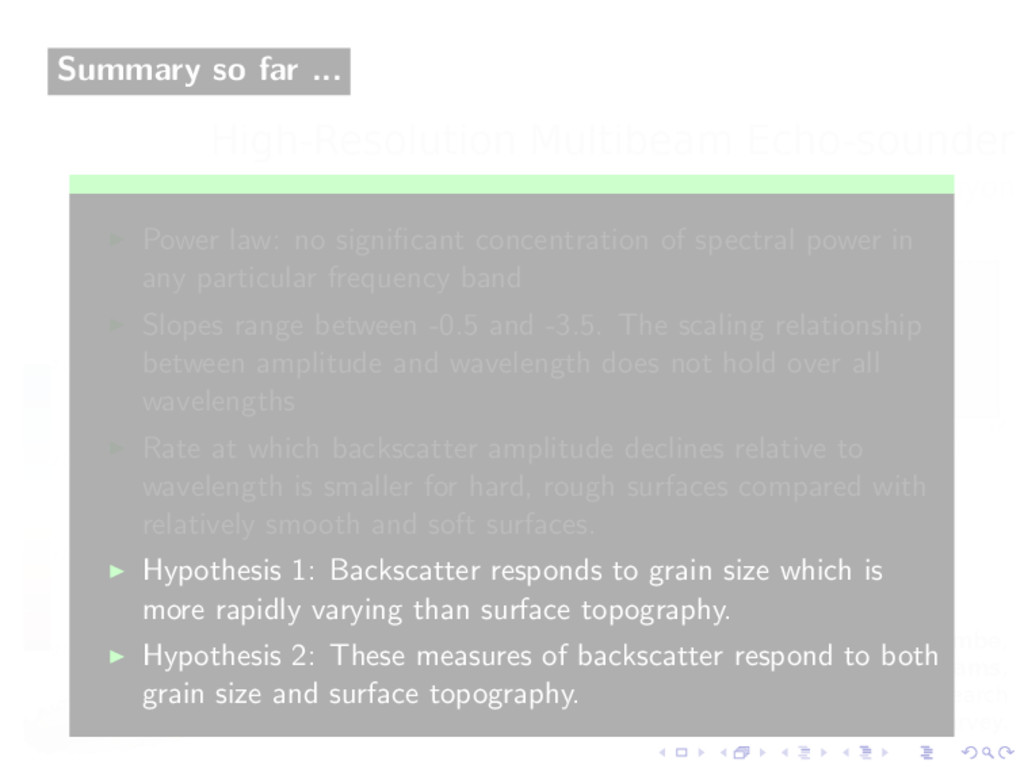
spectral power in any particular frequency band Slopes range between -0.5 and -3.5. The scaling relationship between amplitude and wavelength does not hold over all wavelengths Rate at which backscatter amplitude declines relative to wavelength is smaller for hard, rough surfaces compared with relatively smooth and soft surfaces. Hypothesis 1: Backscatter responds to grain size which is more rapidly varying than surface topography. Hypothesis 2: These measures of backscatter respond to both grain size and surface topography.
spectral power in any particular frequency band Slopes range between -0.5 and -3.5. The scaling relationship between amplitude and wavelength does not hold over all wavelengths Rate at which backscatter amplitude declines relative to wavelength is smaller for hard, rough surfaces compared with relatively smooth and soft surfaces. Hypothesis 1: Backscatter responds to grain size which is more rapidly varying than surface topography. Hypothesis 2: These measures of backscatter respond to both grain size and surface topography.
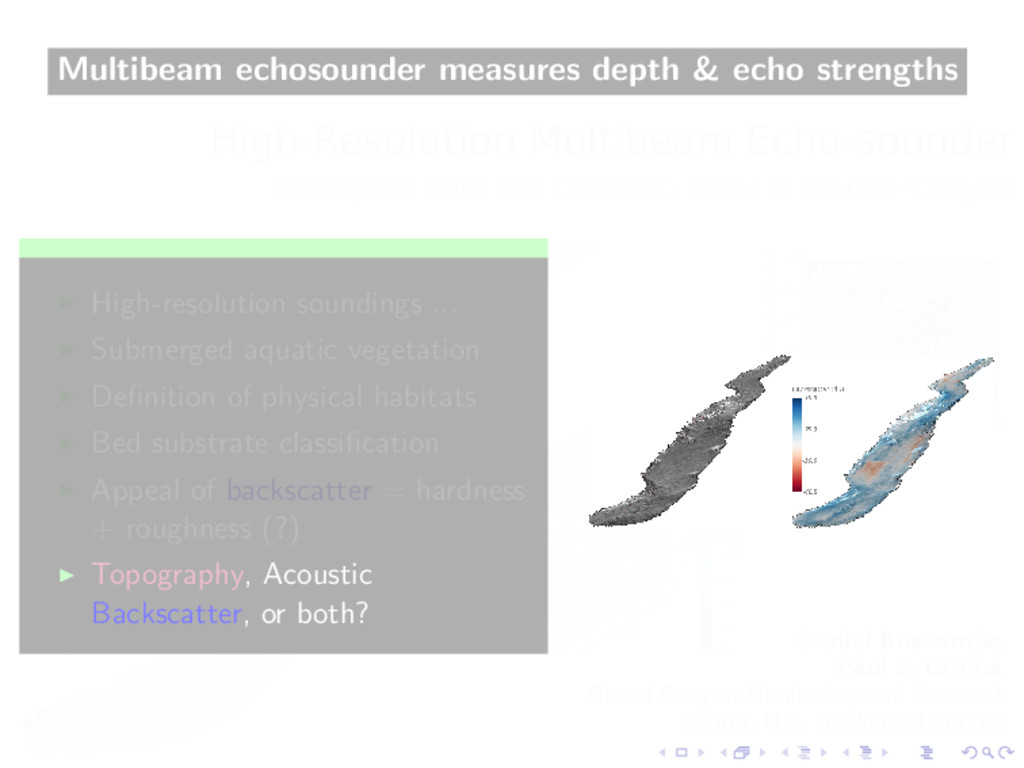
deterministic measures of backscatter and topography? What’s their relationship to sediment type? Can we use this information to get at what scaling relationships exist between amplitude and lengthscales of riverbed patchiness?
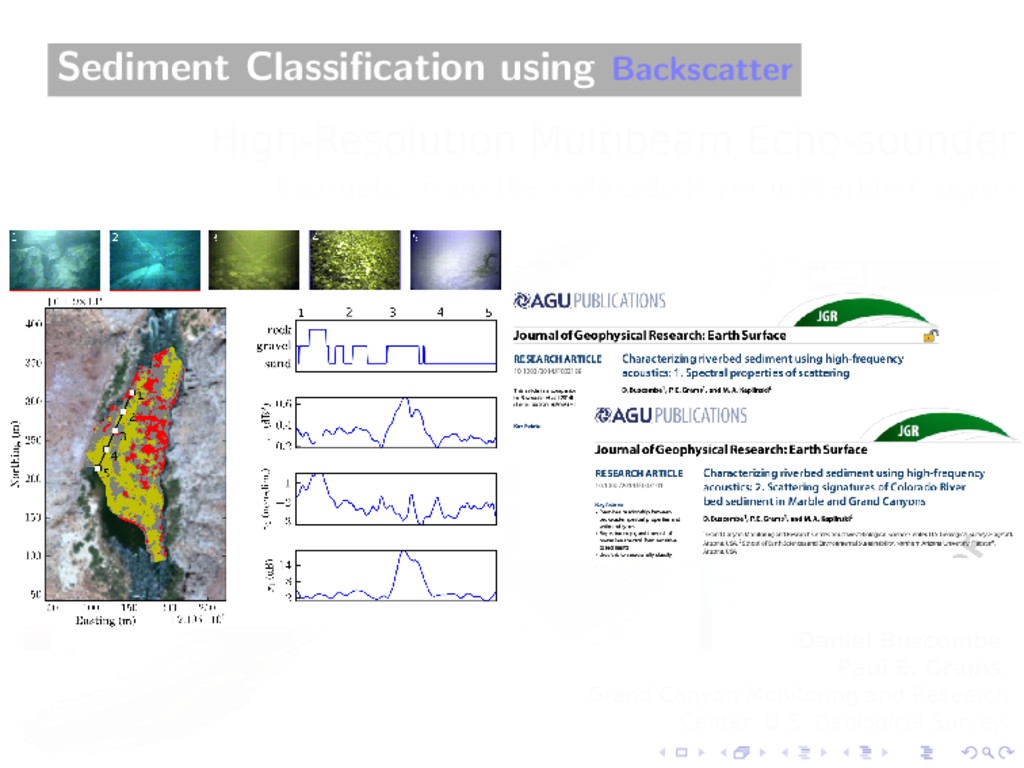
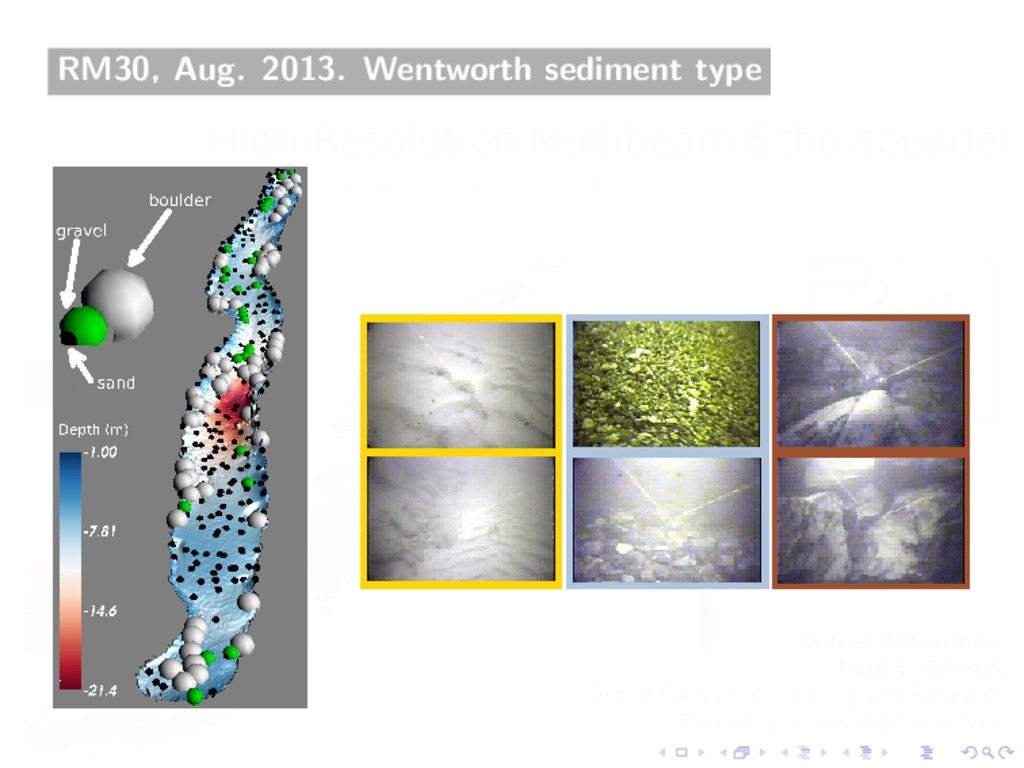
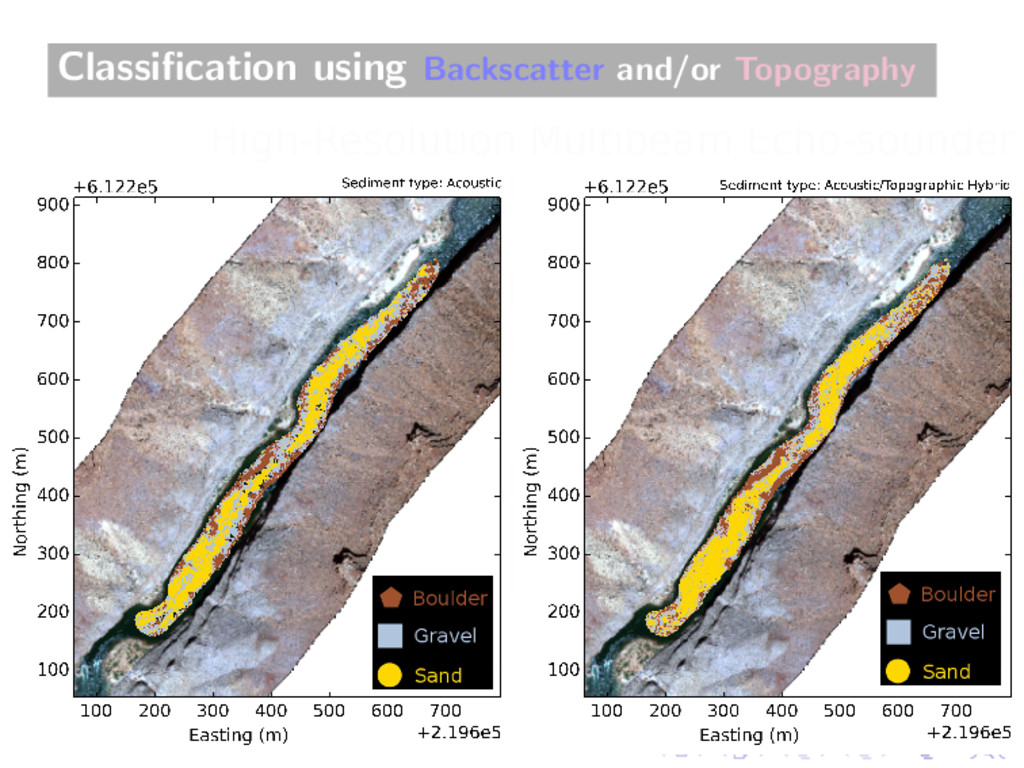
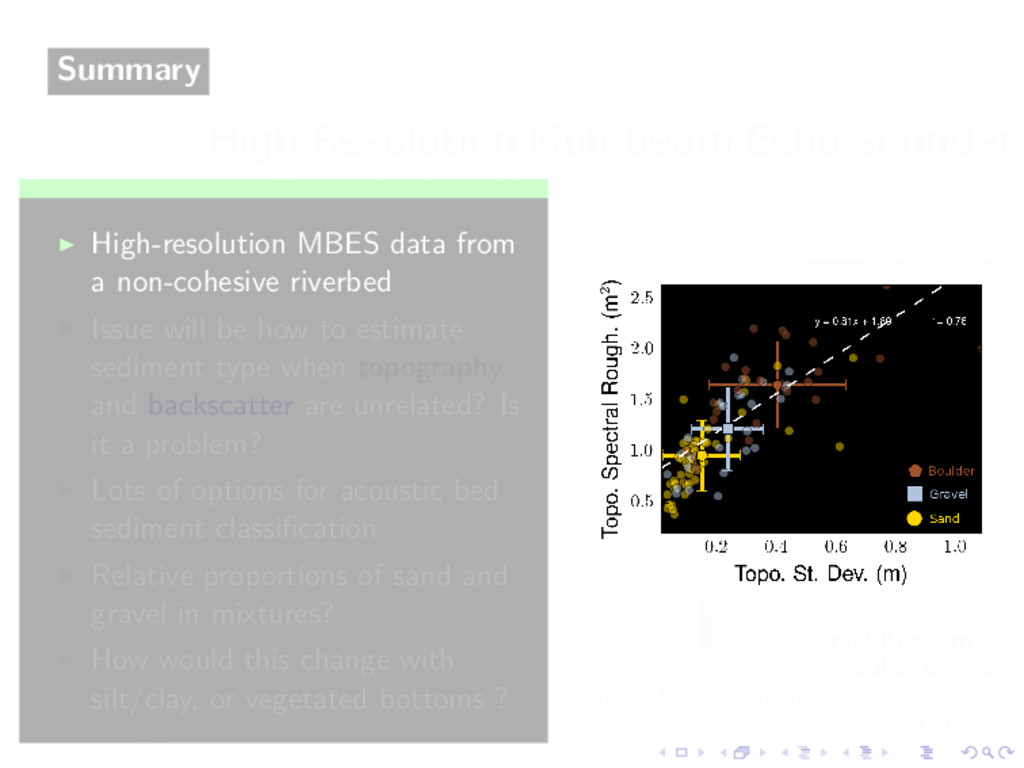
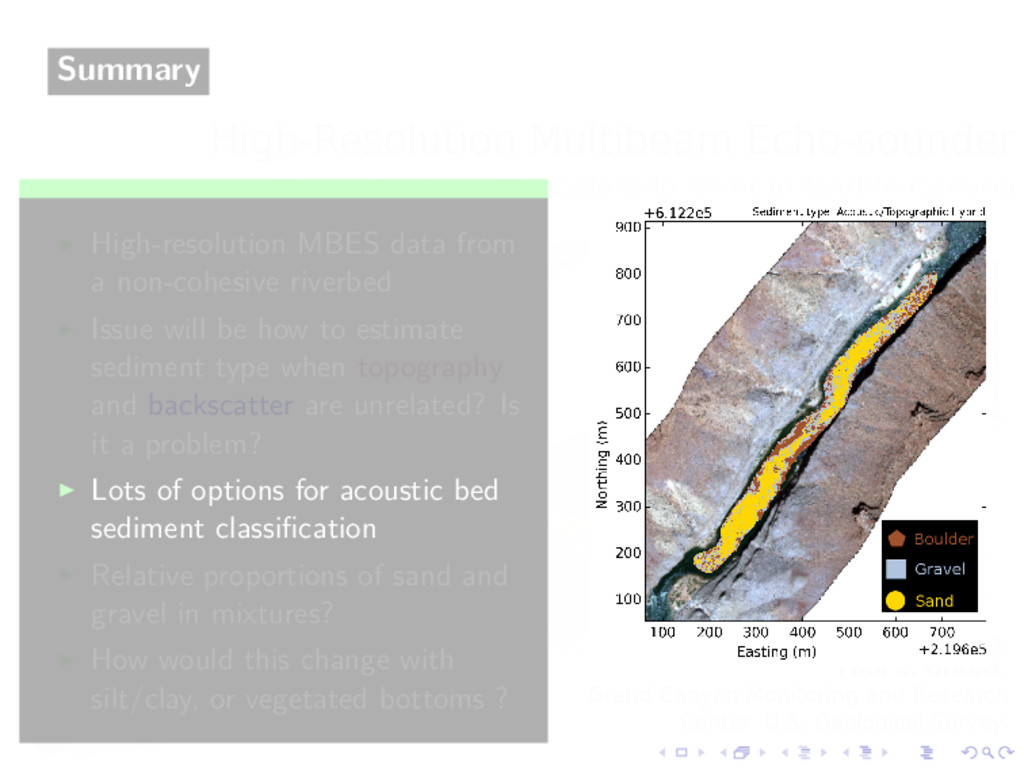
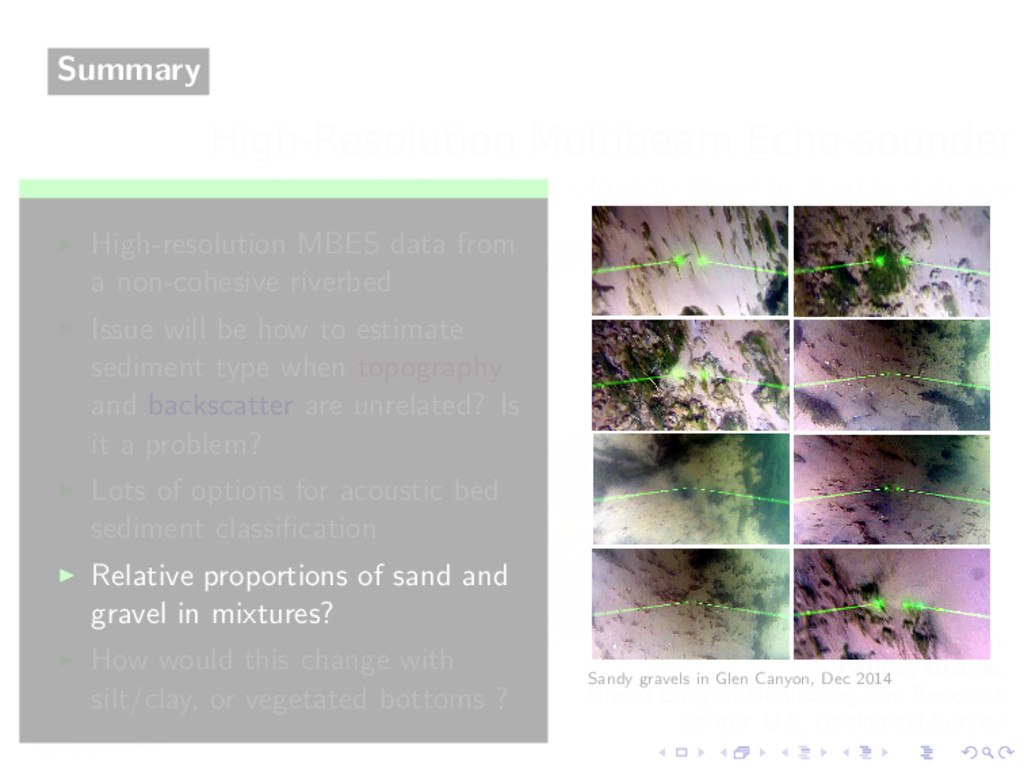
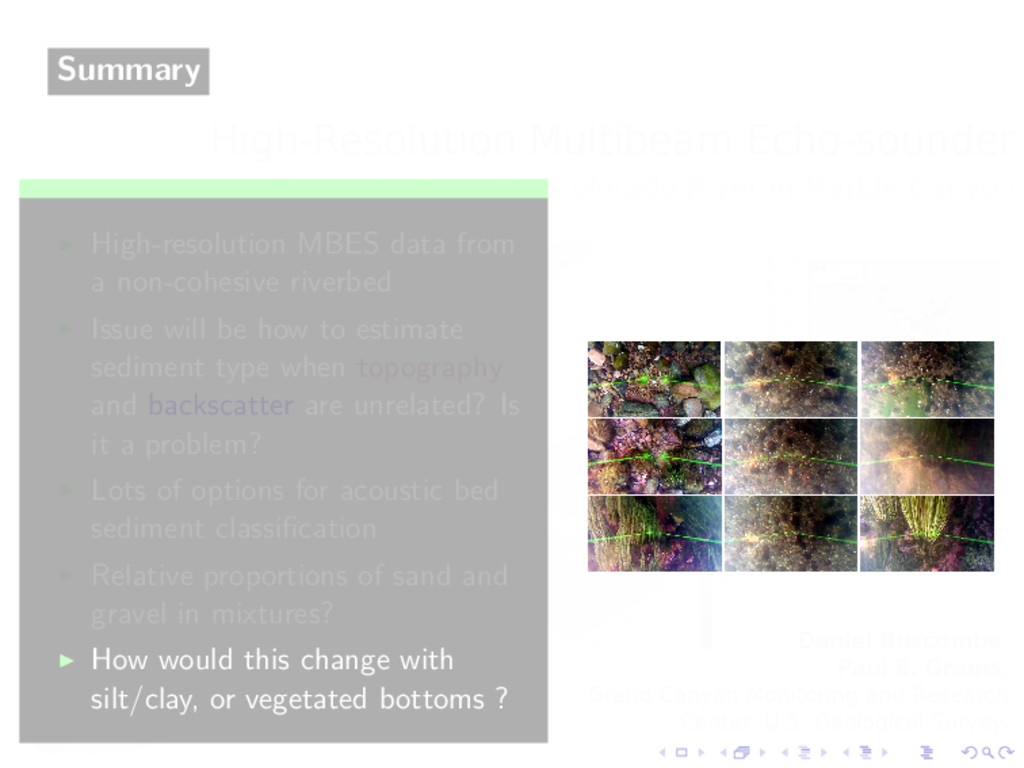
be how to estimate sediment type when topography and backscatter are unrelated? Is it a problem? Lots of options for acoustic bed sediment classification Relative proportions of sand and gravel in mixtures? How would this change with silt/clay, or vegetated bottoms ?
be how to estimate sediment type when topography and backscatter are unrelated? Is it a problem? Lots of options for acoustic bed sediment classification Relative proportions of sand and gravel in mixtures? How would this change with silt/clay, or vegetated bottoms ?
be how to estimate sediment type when topography and backscatter are unrelated? Is it a problem? Lots of options for acoustic bed sediment classification Relative proportions of sand and gravel in mixtures? How would this change with silt/clay, or vegetated bottoms ?
be how to estimate sediment type when topography and backscatter are unrelated? Is it a problem? Lots of options for acoustic bed sediment classification Relative proportions of sand and gravel in mixtures? How would this change with silt/clay, or vegetated bottoms ? Sandy gravels in Glen Canyon, Dec 2014
be how to estimate sediment type when topography and backscatter are unrelated? Is it a problem? Lots of options for acoustic bed sediment classification Relative proportions of sand and gravel in mixtures? How would this change with silt/clay, or vegetated bottoms ?