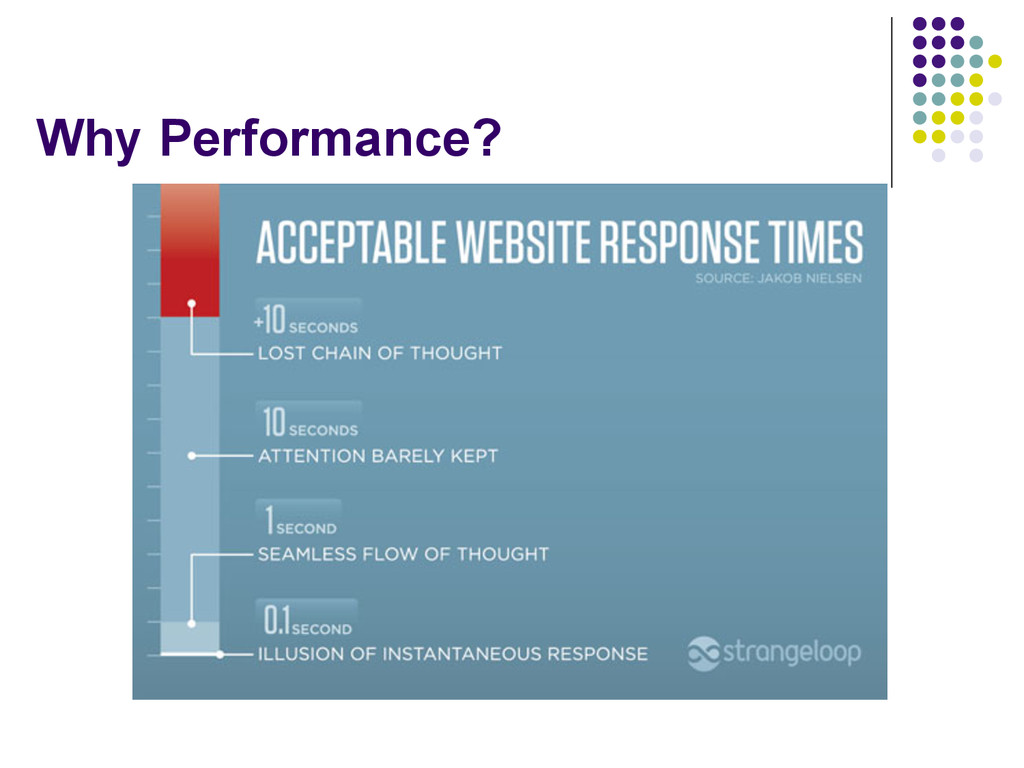
How quickly application responds to a user l Scalability l How application handles expected users and beyond l Stability l How stable the application is under load § Could be expected or unexpected
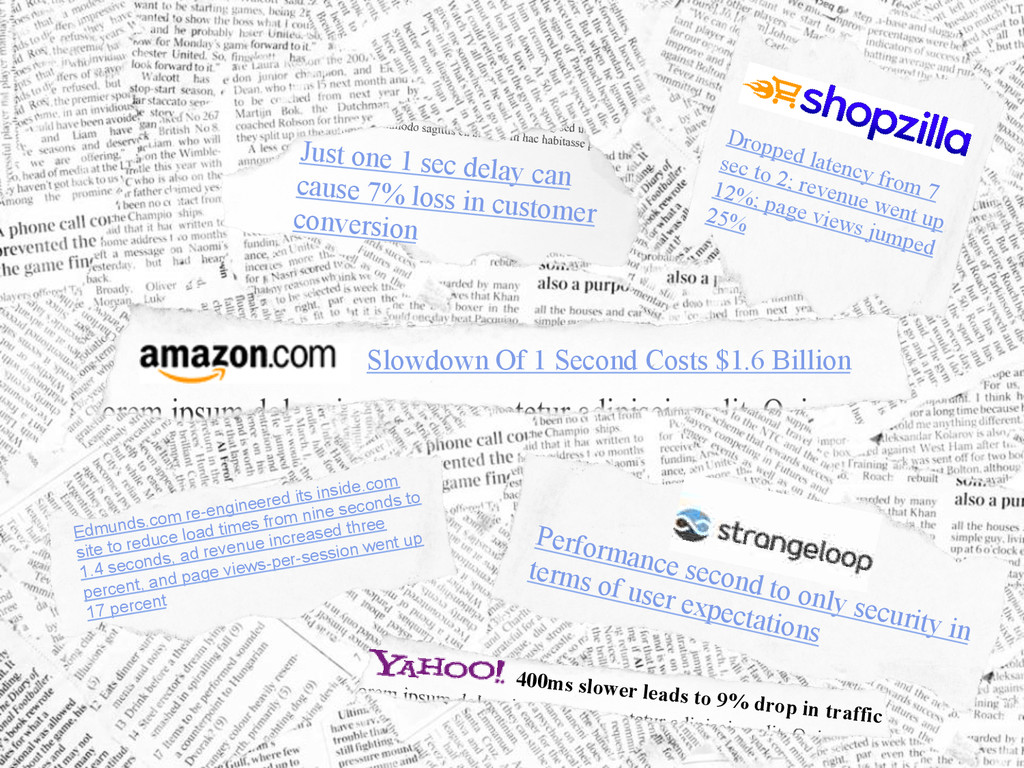
1 sec delay can cause 7% loss in customer conversion Dropped latency from 7 sec to 2; revenue went up 12%; page views jumped 25% Edmunds.com re-engineered its inside.com site to reduce load times from nine seconds to 1.4 seconds, ad revenue increased three percent, and page views-per-session went up 17 percent Slowdown Of 1 Second Costs $1.6 Billion Performance second to only security in terms of user expectations
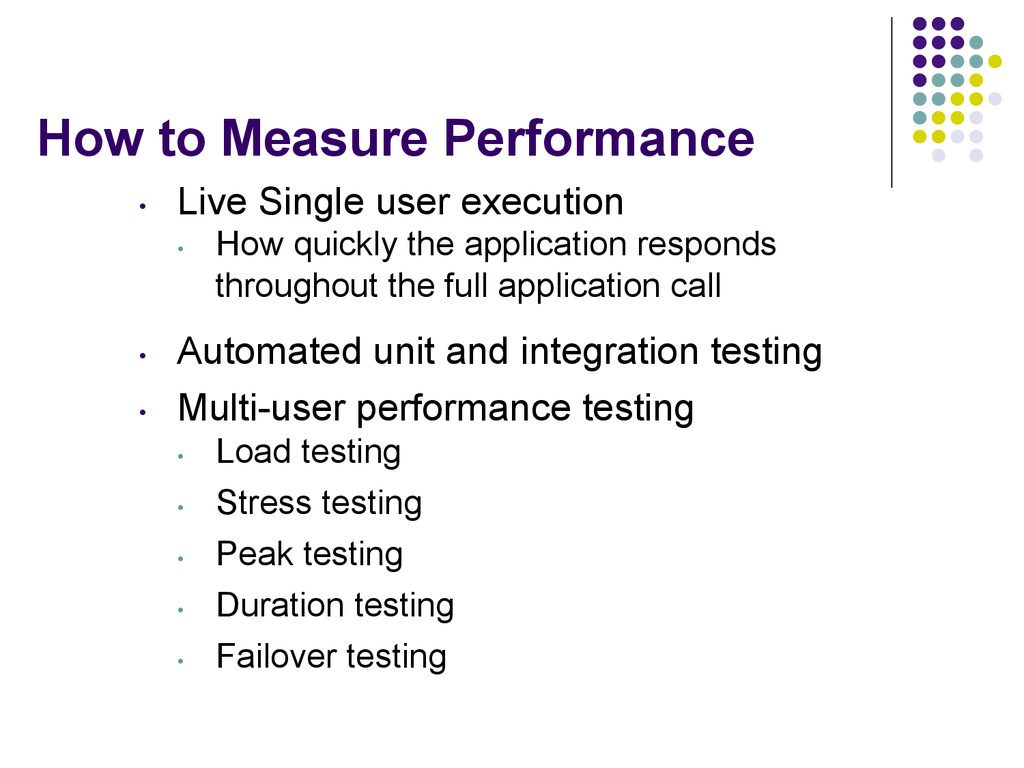
How quickly the application responds throughout the full application call • Automated unit and integration testing • Multi-user performance testing • Load testing • Stress testing • Peak testing • Duration testing • Failover testing
chunk by default • If you turn it on and writeln to response, each write will get chunked (big perf hit for large HTML) AJAX Defer JS CSS on top JS on the bottom JS load asynchronously
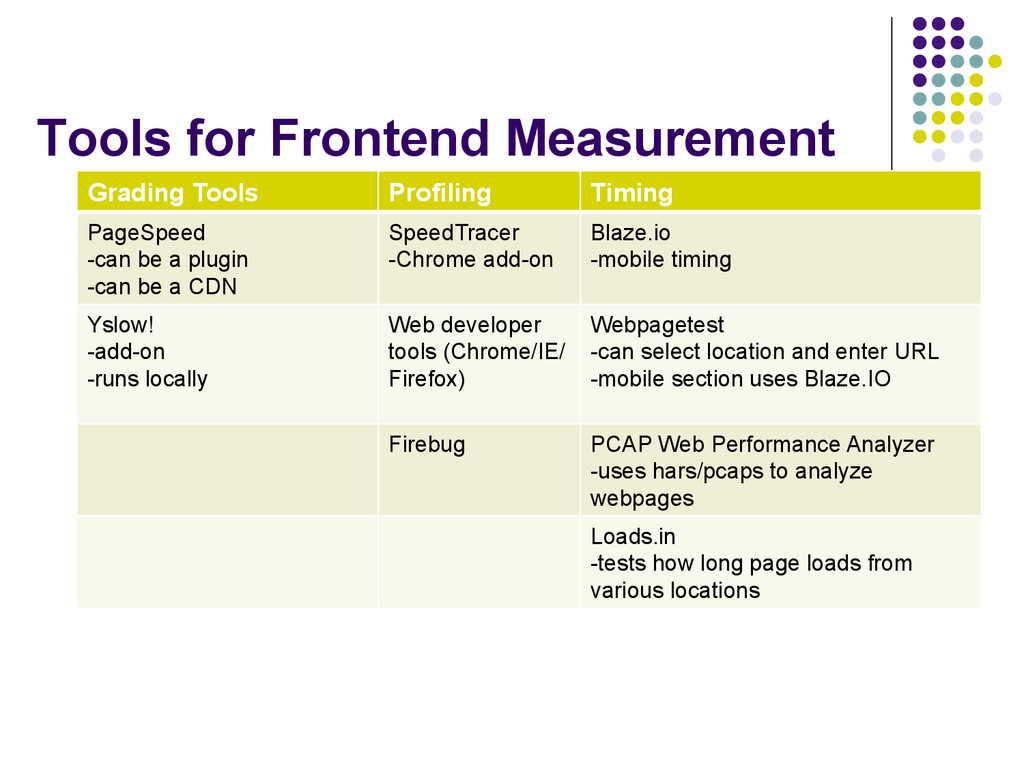
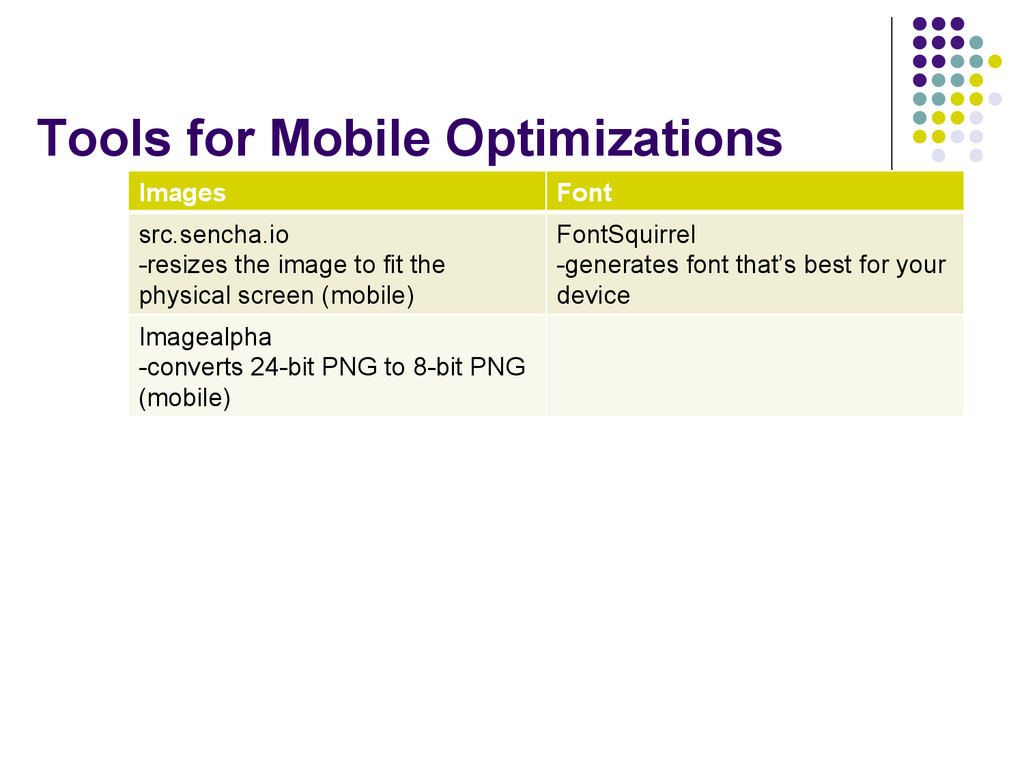
be a plugin -can be a CDN SpeedTracer -Chrome add-on Blaze.io -mobile timing Yslow! -add-on -runs locally Web developer tools (Chrome/IE/ Firefox) Webpagetest -can select location and enter URL -mobile section uses Blaze.IO Firebug PCAP Web Performance Analyzer -uses hars/pcaps to analyze webpages Loads.in -tests how long page loads from various locations
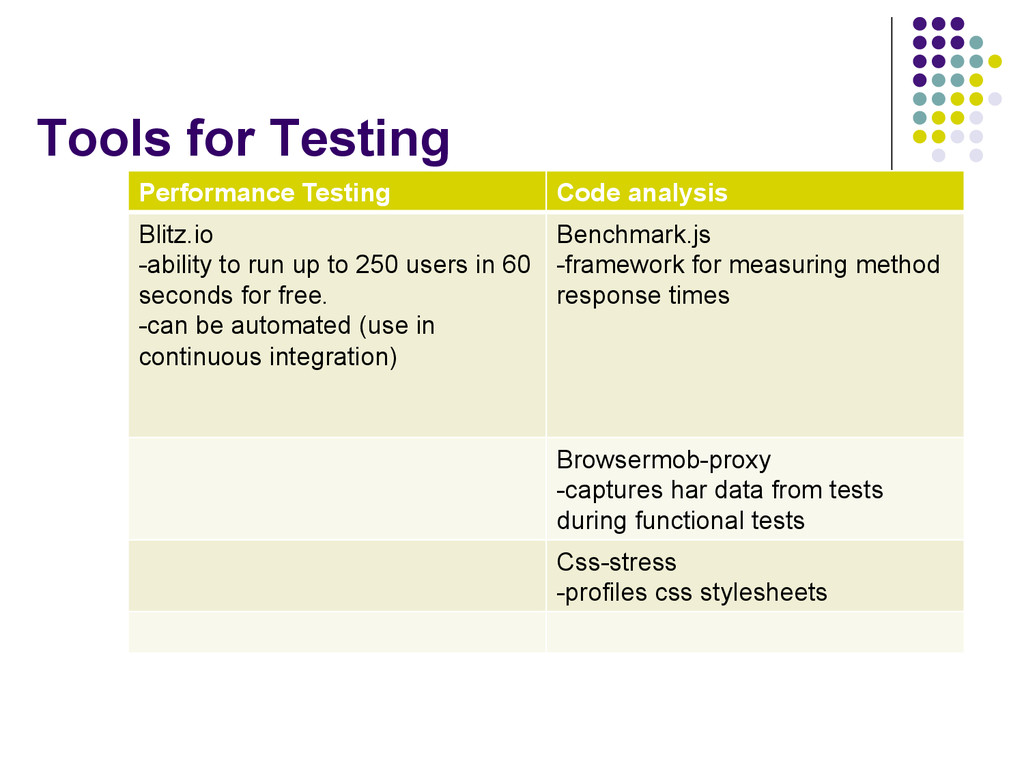
run up to 250 users in 60 seconds for free. -can be automated (use in continuous integration) Benchmark.js -framework for measuring method response times Browsermob-proxy -captures har data from tests during functional tests Css-stress -profiles css stylesheets
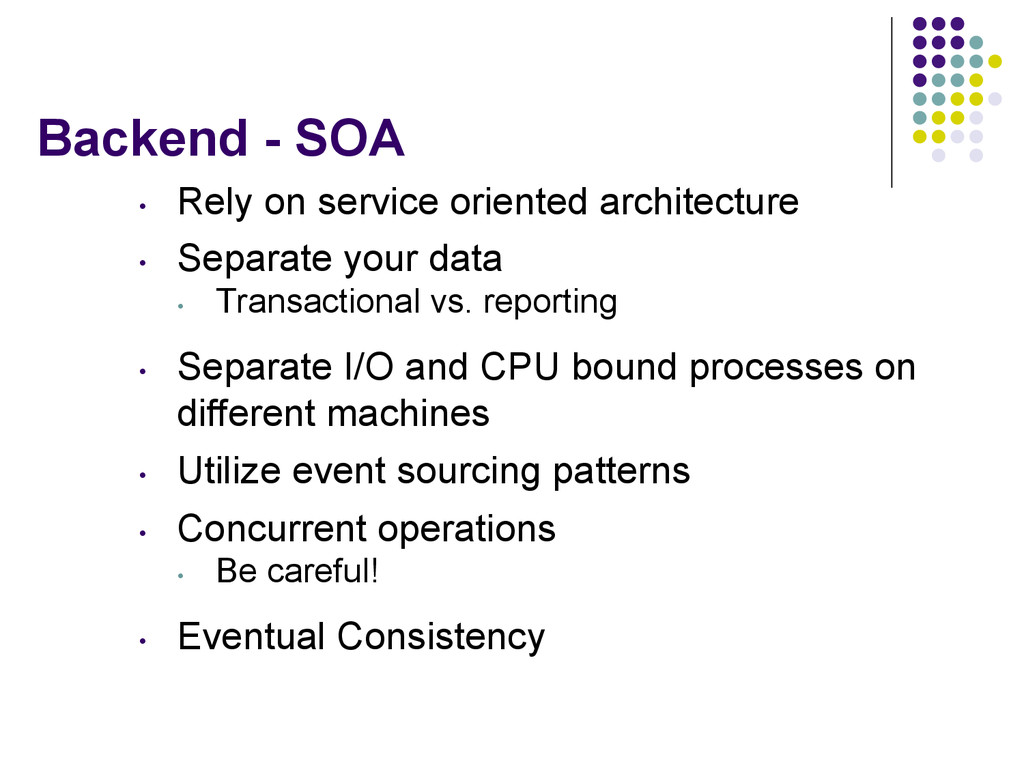
Separate your data • Transactional vs. reporting • Separate I/O and CPU bound processes on different machines • Utilize event sourcing patterns • Concurrent operations • Be careful! • Eventual Consistency
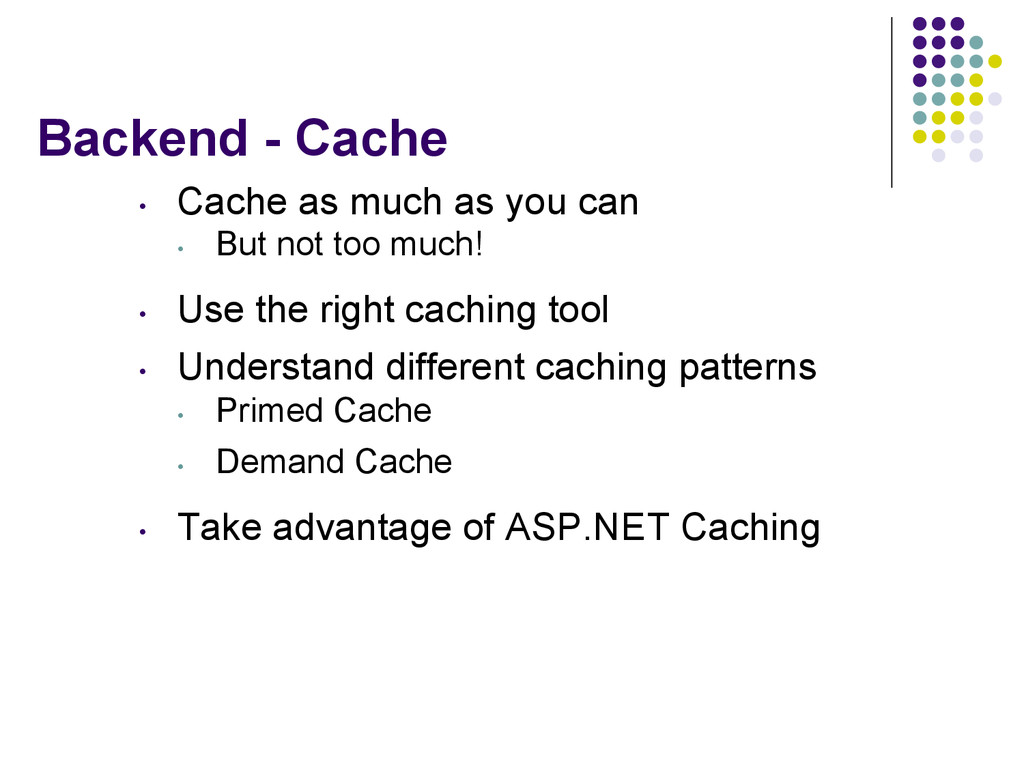
• But not too much! • Use the right caching tool • Understand different caching patterns • Primed Cache • Demand Cache • Take advantage of ASP.NET Caching
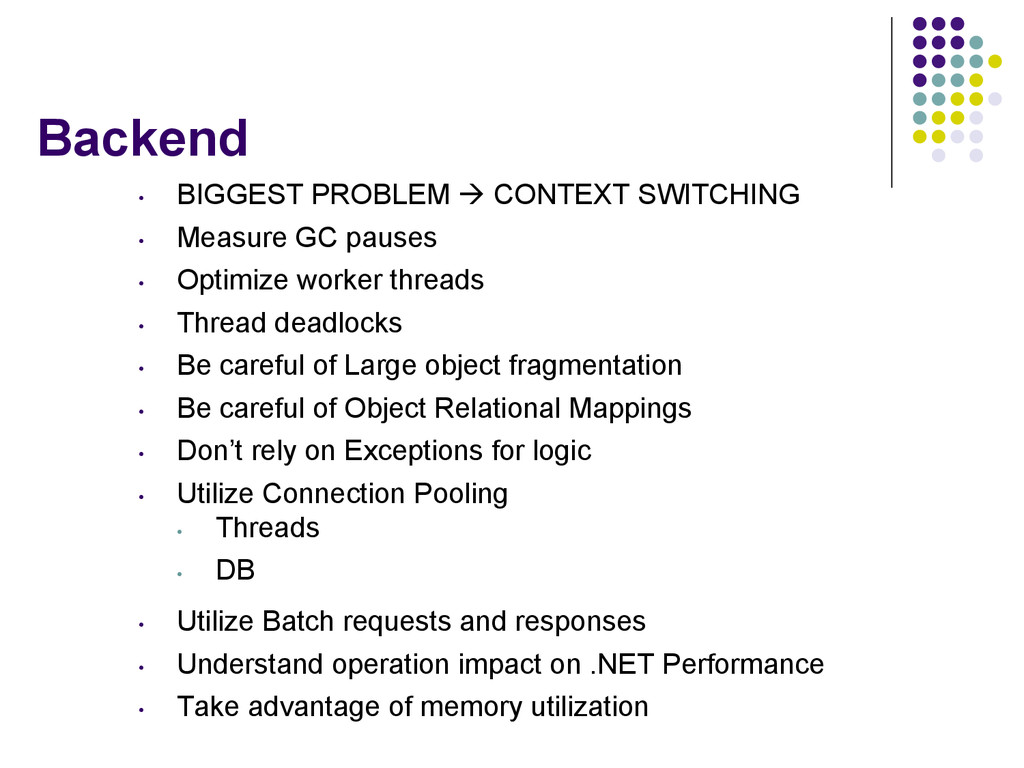
pauses • Optimize worker threads • Thread deadlocks • Be careful of Large object fragmentation • Be careful of Object Relational Mappings • Don’t rely on Exceptions for logic • Utilize Connection Pooling • Threads • DB • Utilize Batch requests and responses • Understand operation impact on .NET Performance • Take advantage of memory utilization
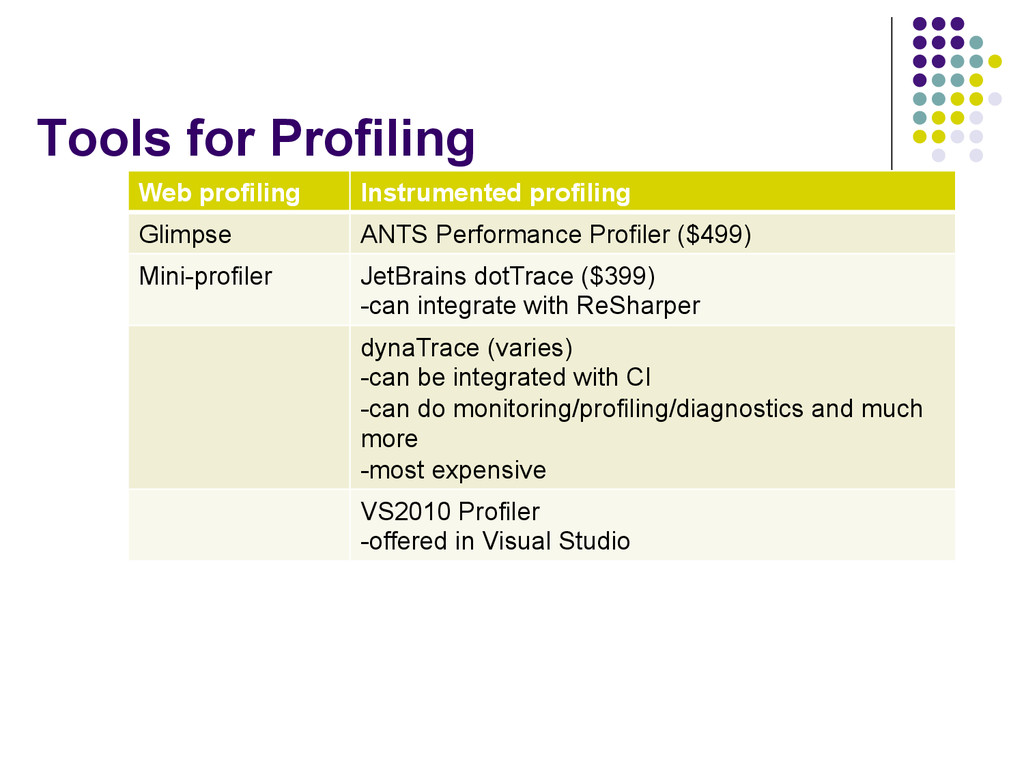
Profiler ($499) Mini-profiler JetBrains dotTrace ($399) -can integrate with ReSharper dynaTrace (varies) -can be integrated with CI -can do monitoring/profiling/diagnostics and much more -most expensive VS2010 Profiler -offered in Visual Studio
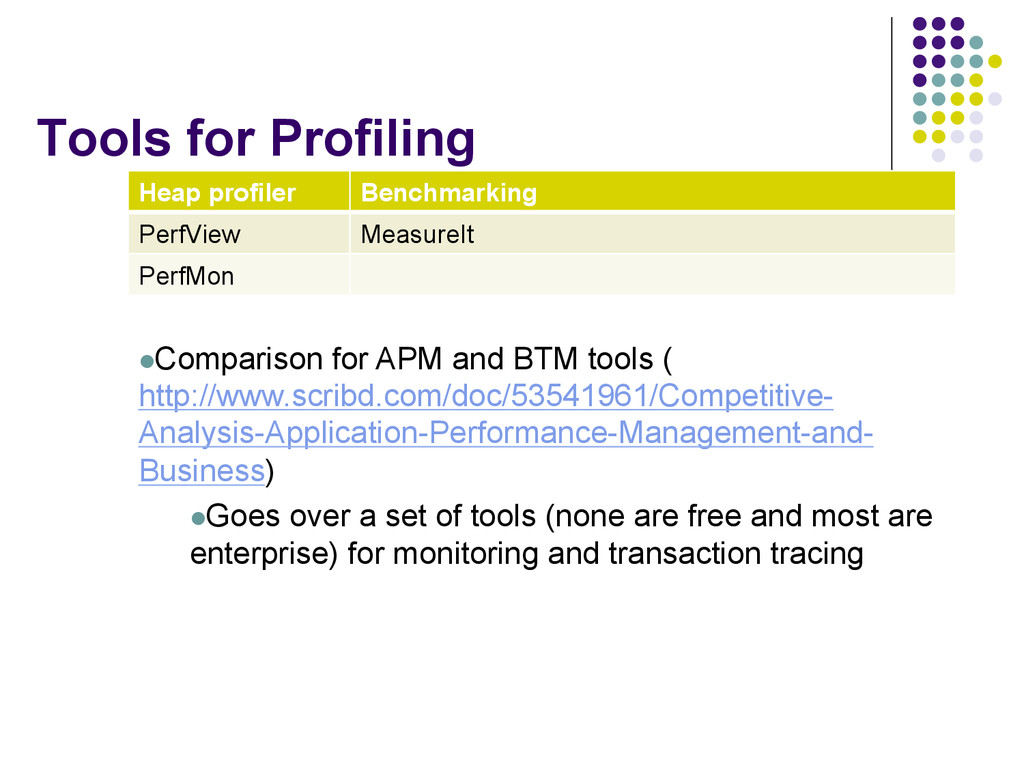
for APM and BTM tools ( http://www.scribd.com/doc/53541961/Competitive- Analysis-Application-Performance-Management-and- Business) l Goes over a set of tools (none are free and most are enterprise) for monitoring and transaction tracing
DO start with 3rd party tools but roll your own solutions if necessary for performance • DO NOT be afraid to modify standard solutions • DO go for the first bottleneck and always retest after • Follow “test à fix à retest” pattern
![Contact @dimtruck [email protected] http://dimitryushakov.com/codecamp2012/ presentation • Will have slides of](https://files.speakerdeck.com/presentations/179818303bc90132b7d4027c1edc7060/slide_26.jpg)