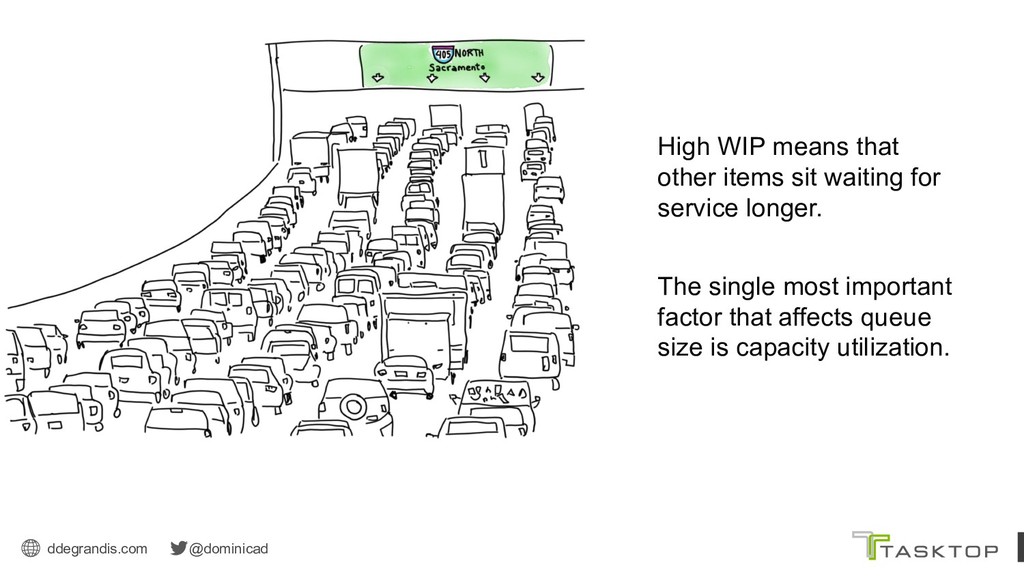
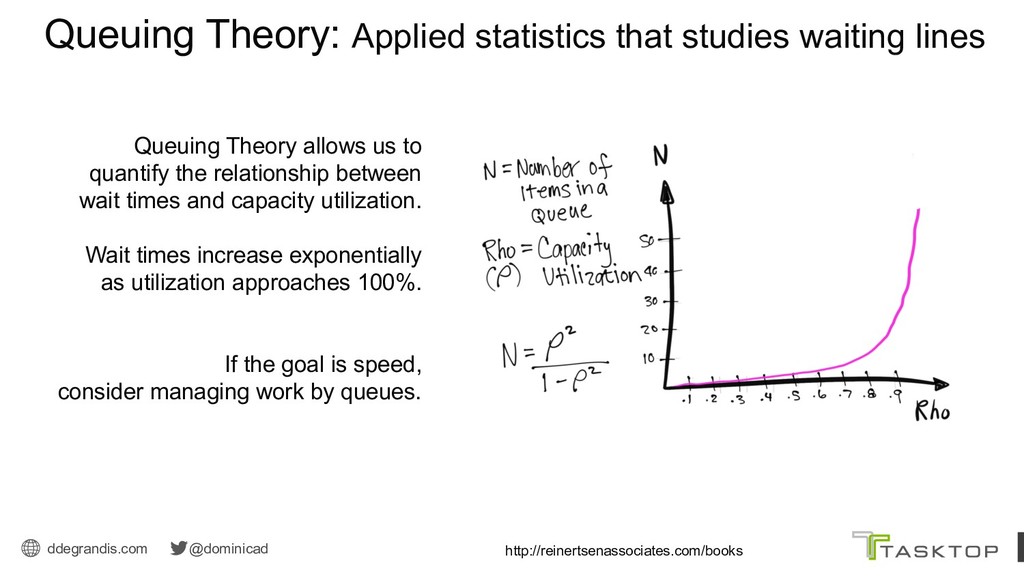
Theory allows us to quantify the relationship between wait times and capacity utilization. Wait times increase exponentially as utilization approaches 100%. Queuing Theory: Applied statistics that studies waiting lines If the goal is speed, consider managing work by queues. http://reinertsenassociates.com/books/
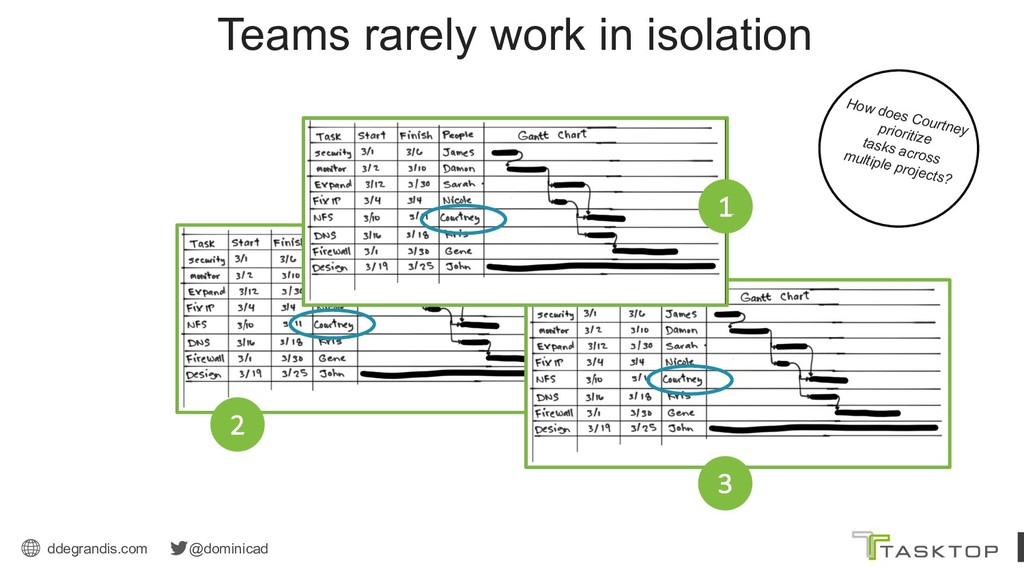
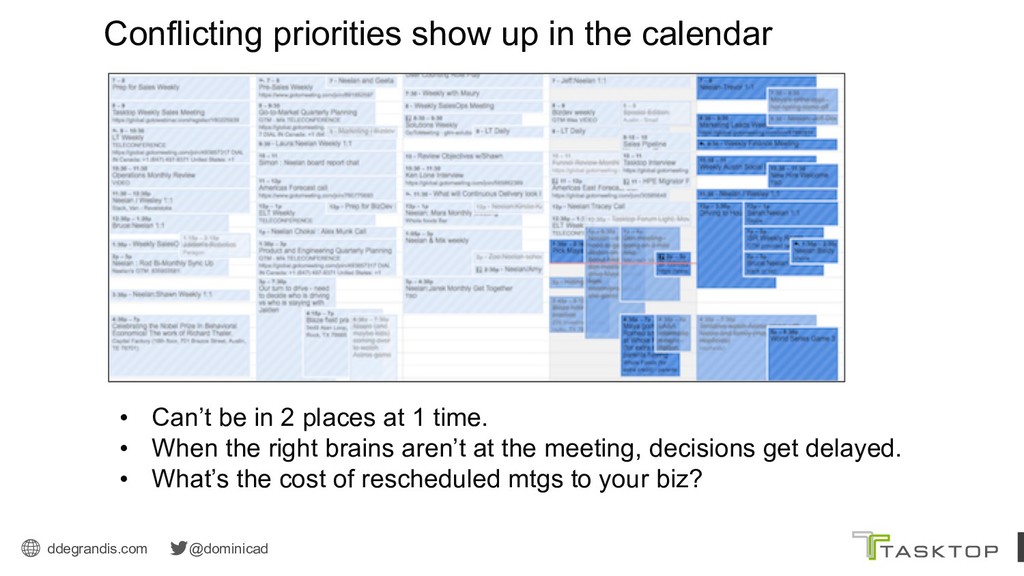
Can’t be in 2 places at 1 time. • When the right brains aren’t at the meeting, decisions get delayed. • What’s the cost of rescheduled mtgs to your biz?
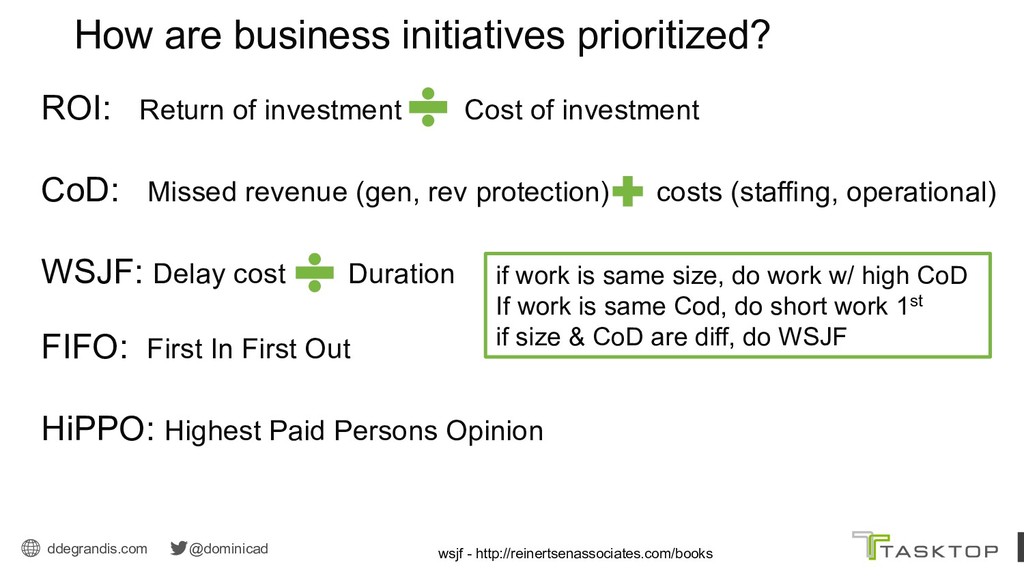
investment Cost of investment CoD: Missed revenue (gen, rev protection) costs (staffing, operational) WSJF: Delay cost Duration FIFO: First In First Out HiPPO: Highest Paid Persons Opinion wsjf - http://reinertsenassociates.com/books/ if work is same size, do work w/ high CoD If work is same Cod, do short work 1st if size & CoD are diff, do WSJF
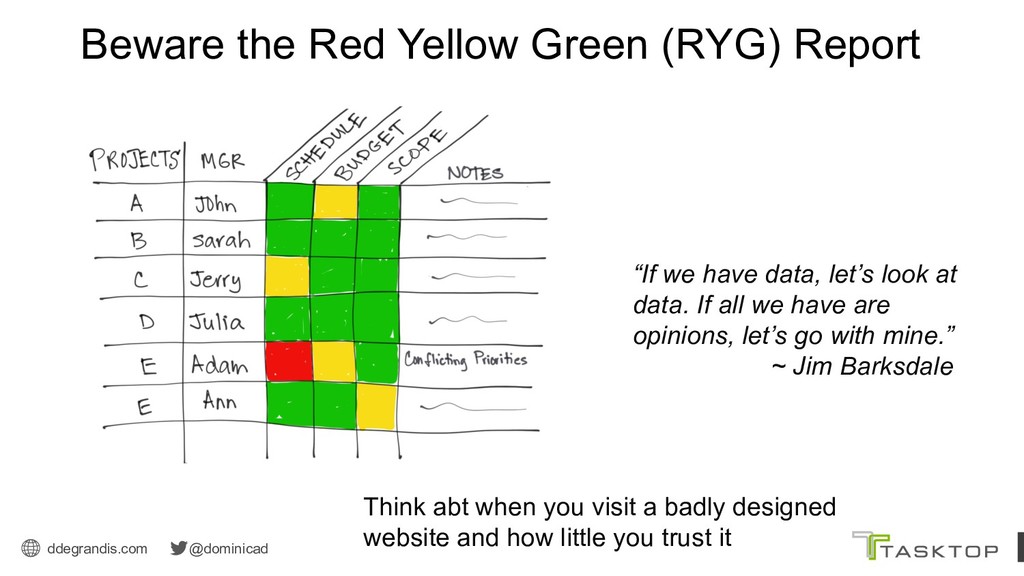
we have data, let’s look at data. If all we have are opinions, let’s go with mine.” ~ Jim Barksdale Think abt when you visit a badly designed website and how little you trust it
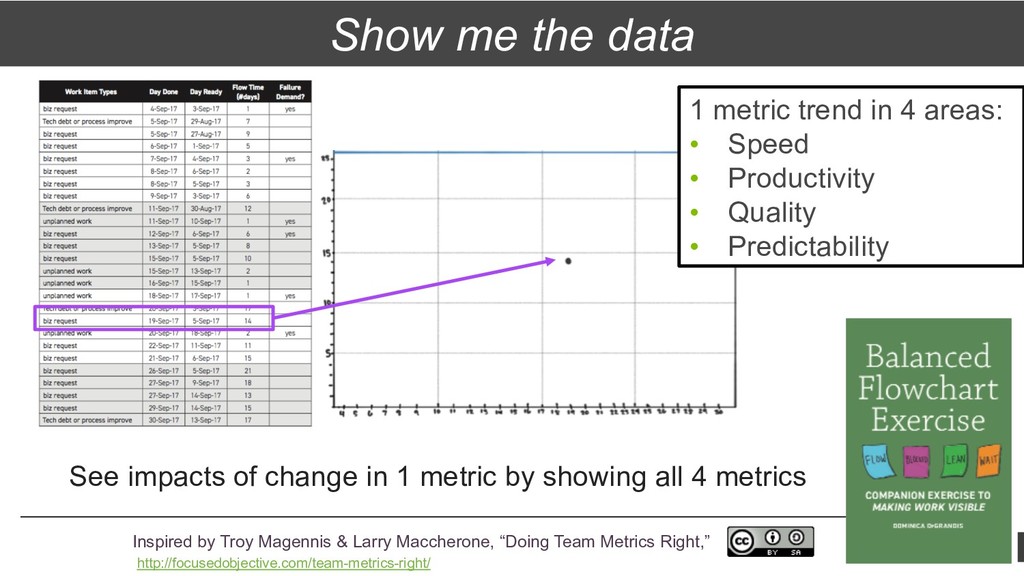
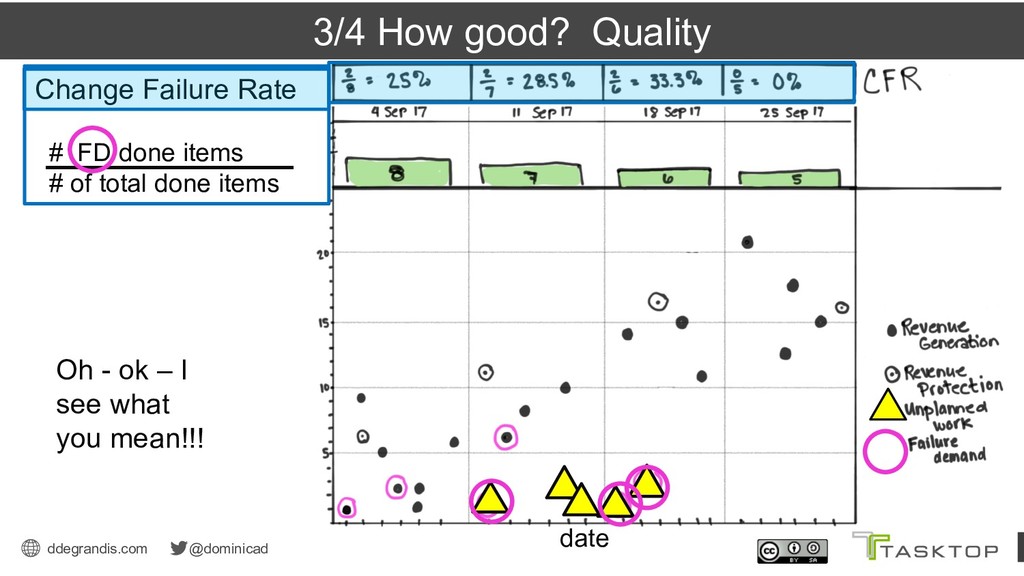
4 areas: • Speed • Productivity • Quality • Predictability See impacts of change in 1 metric by showing all 4 metrics Inspired by Troy Magennis & Larry Maccherone, “Doing Team Metrics Right,” http://focusedobjective.com/team-metrics-right/
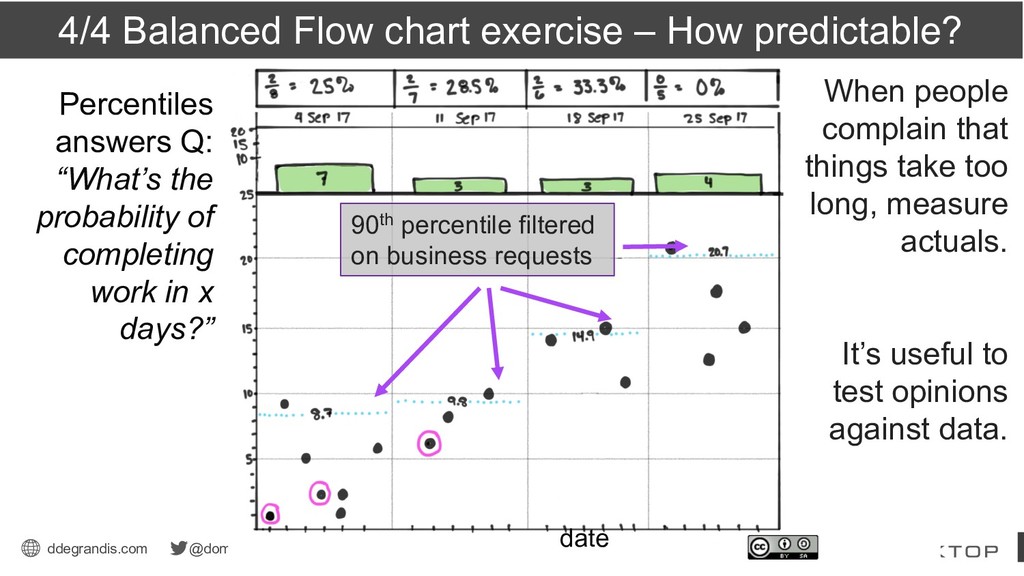
measure actuals. It’s useful to test opinions against data. 90th percentile filtered on business requests 4/4 Balanced Flow chart exercise – How predictable? date Percentiles answers Q: “What’s the probability of completing work in x days?”
measure actuals. It’s useful to test opinions against data. 90th percentile filtered on business requests 4/4 Balanced Flow chart exercise – How predictable? date Percentiles answers Q: “What’s the probability of completing work in x days?”
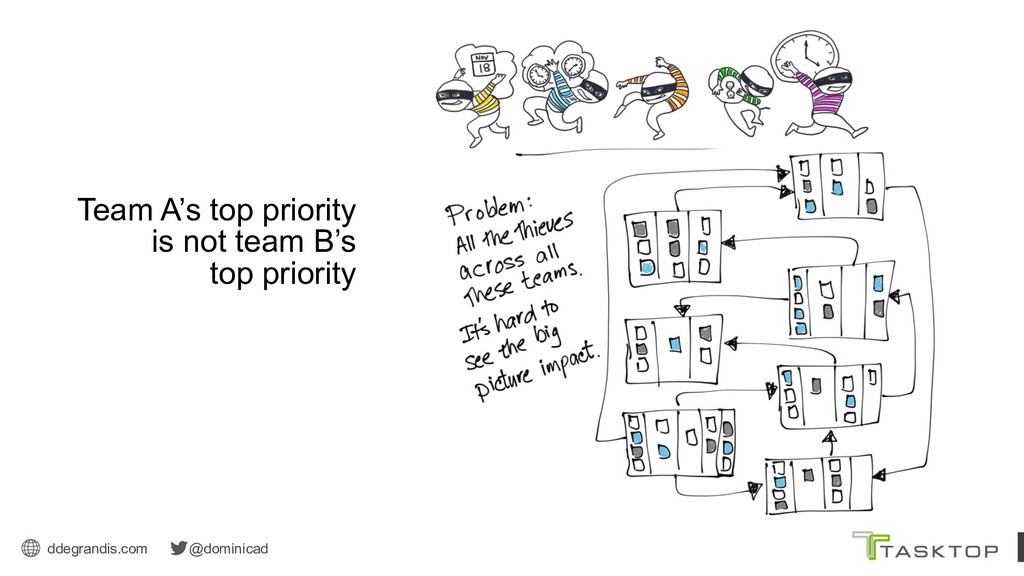
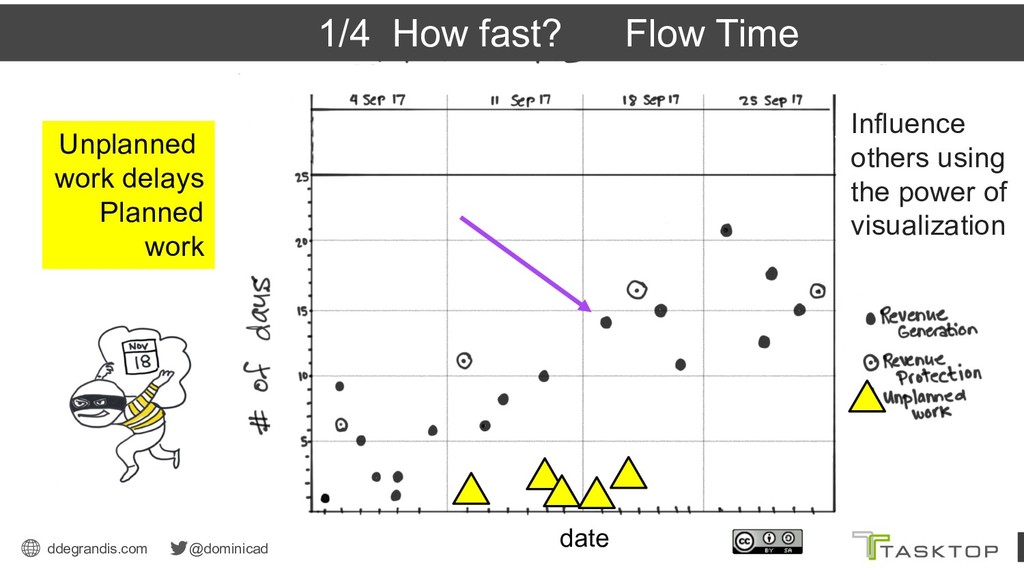
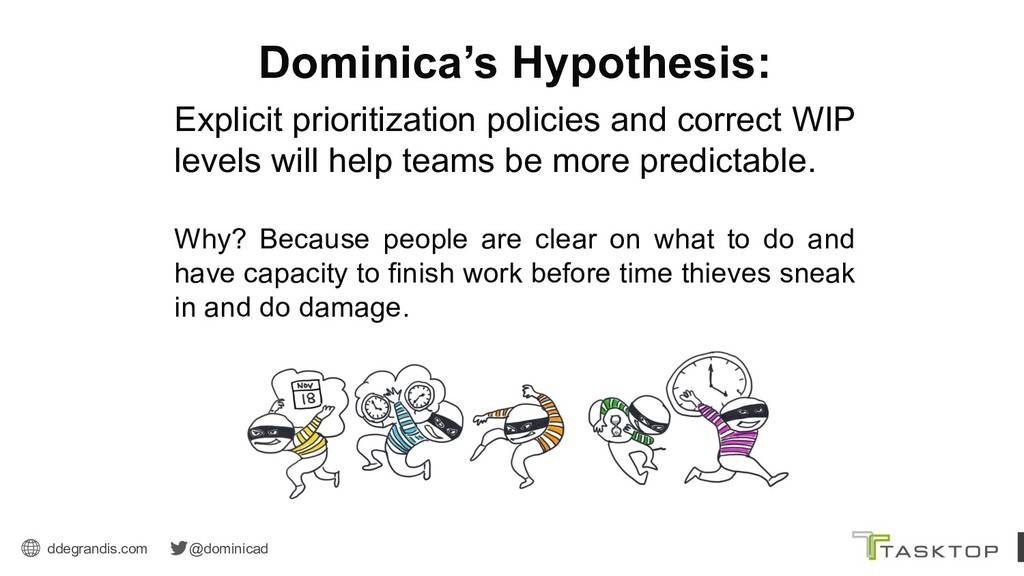
levels will help teams be more predictable. Why? Because people are clear on what to do and have capacity to finish work before time thieves sneak in and do damage.
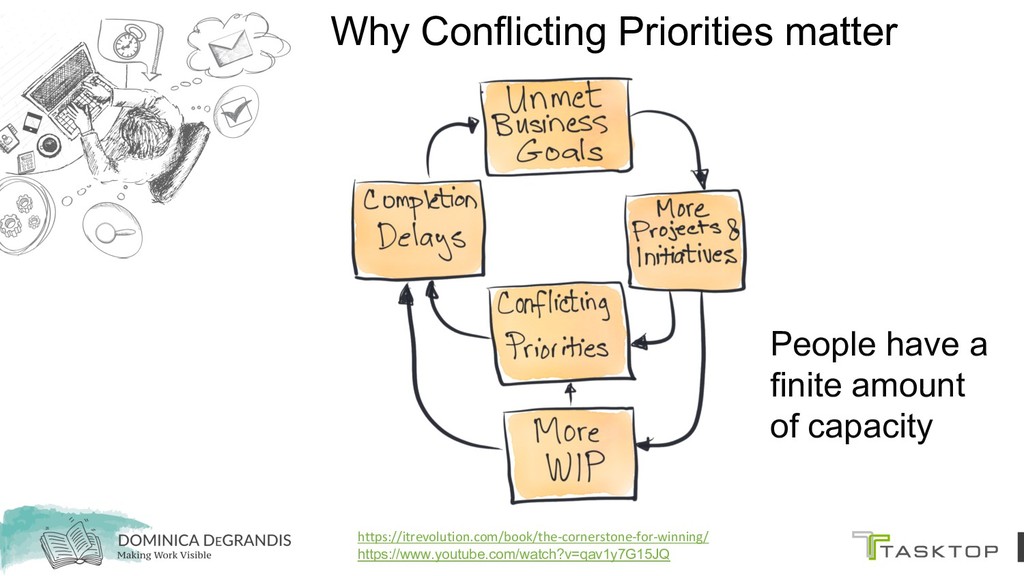
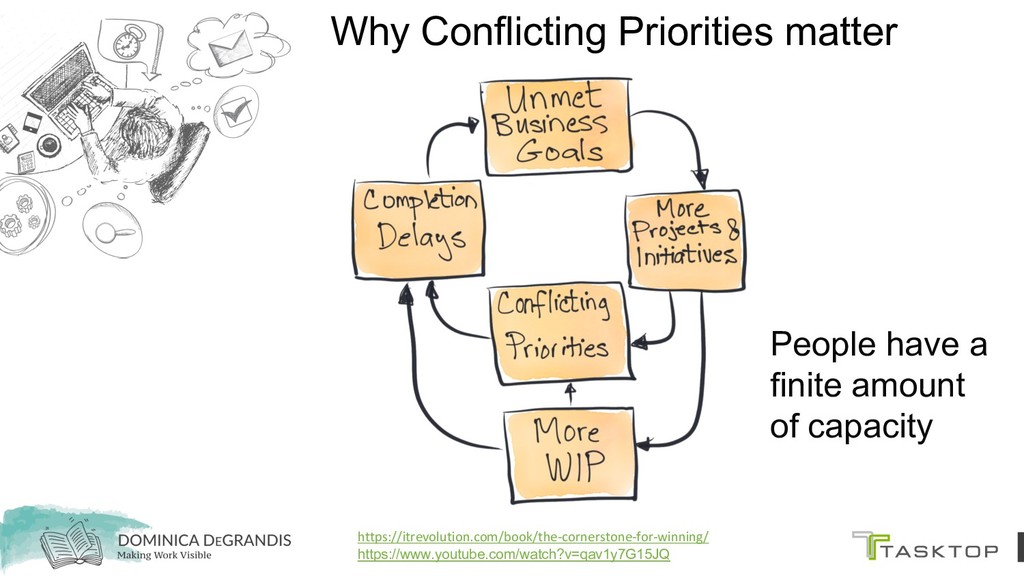
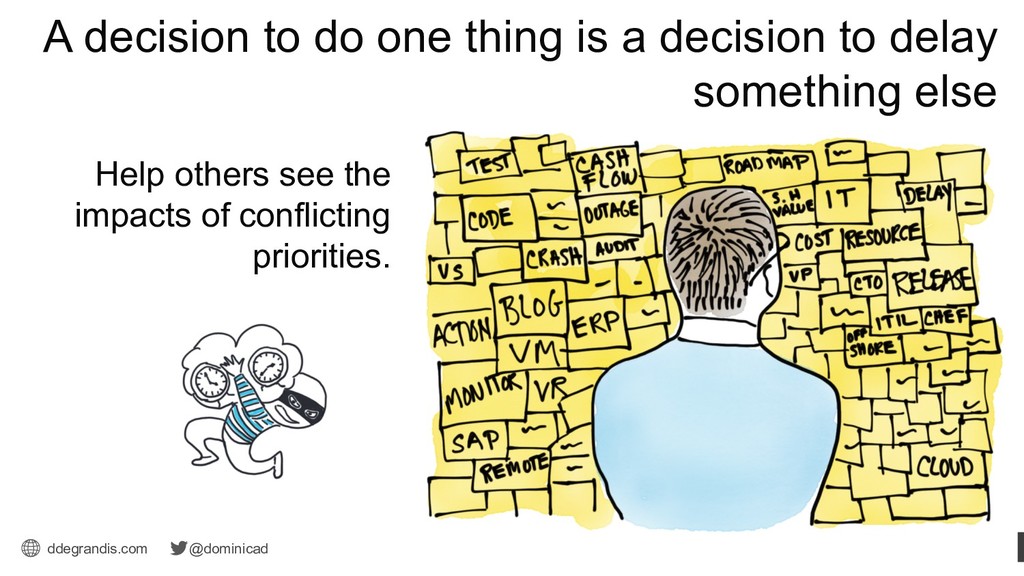
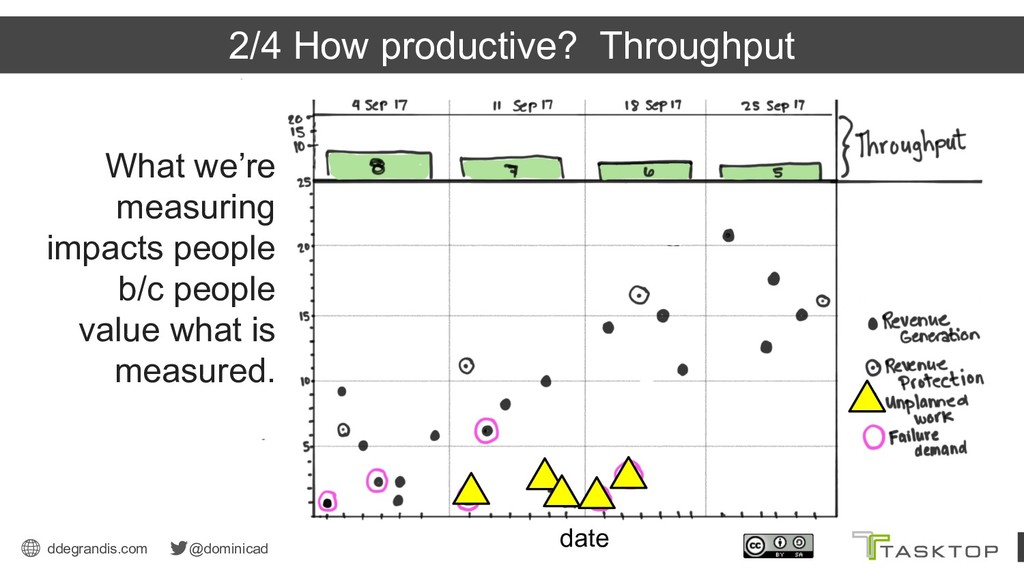
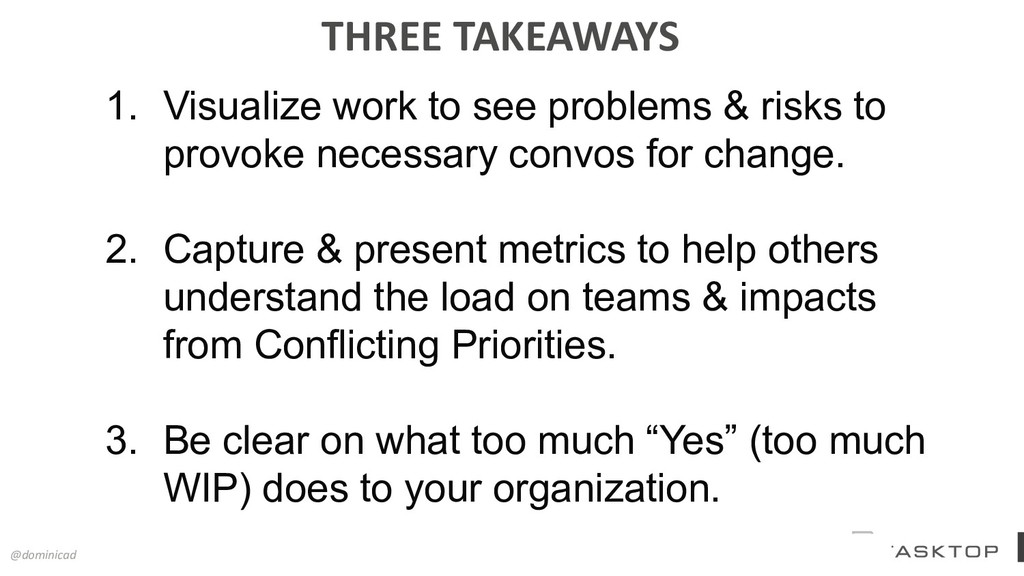
problems & risks to provoke necessary convos for change. 2. Capture & present metrics to help others understand the load on teams & impacts from Conflicting Priorities. 3. Be clear on what too much “Yes” (too much WIP) does to your organization.
of this presentation deck • excerpts of Making Work Visible • Tasktop video on TFS/SN tool integration • Forrester article: Agile-Plus-DevOps With Value Stream Management


 dominicad
 prog893
 pfn
pfn
 raspython3
 teamlab
 satoshi7
 namiki64
 kaminashi
 koukihosaka
 glaforge
 endonanana
 shuta13
 erikaheidi
 davidcarrasco
 cassininazir
 inesmontani
 sabderemane
 ivargrimstad
 skipperchong
 axbom
axbom
 signer
 lfama
lfama
 zakiyama
![ddegrandis.com @dominicad Email: [email protected] Subject: flow To receive: • copy](https://files.speakerdeck.com/presentations/3d84f9010aeb4b2896ce97f8d7befbcb/slide_26.jpg)