Upgrade to Pro — share decks privately, control downloads, hide ads and more …

Identifying Potential Sources of Data and Metaphors for Learning Analytics and Dashboards

Identifying Potential Sources of Data and Metaphors for Learning Analytics and Dashboards

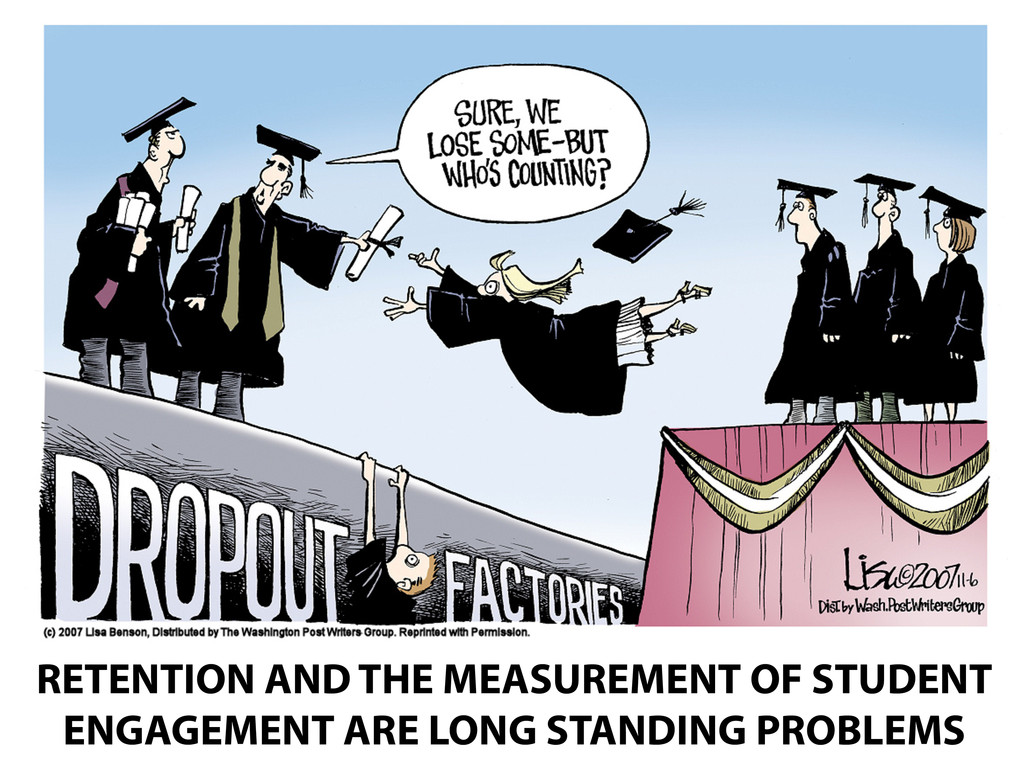
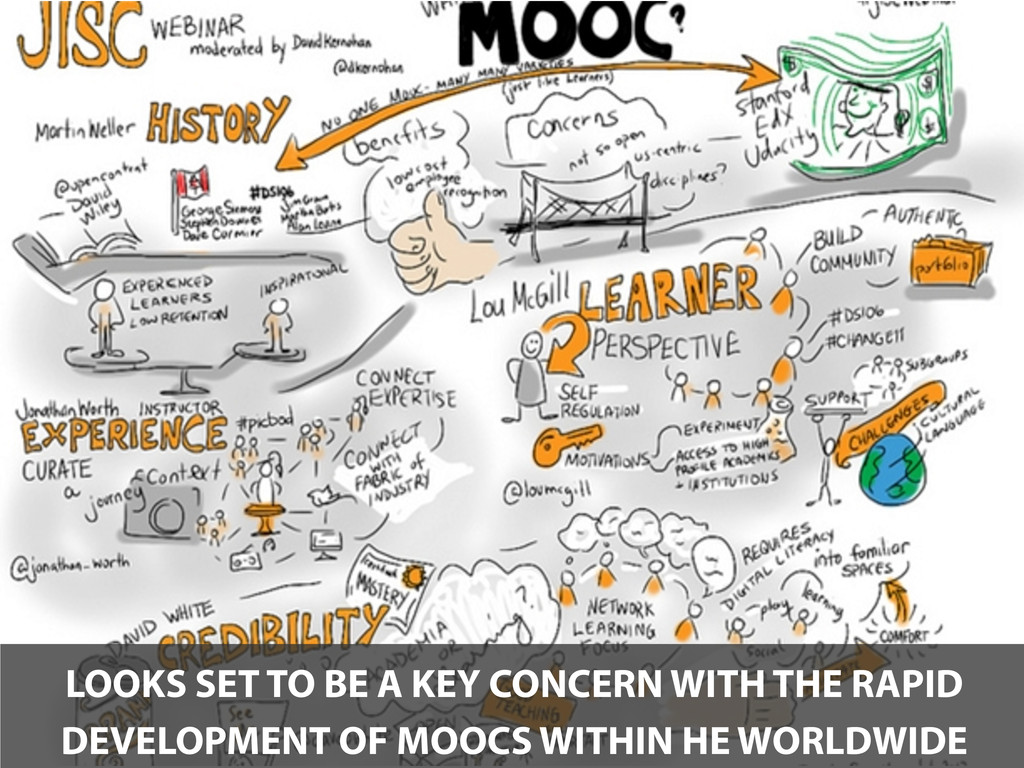
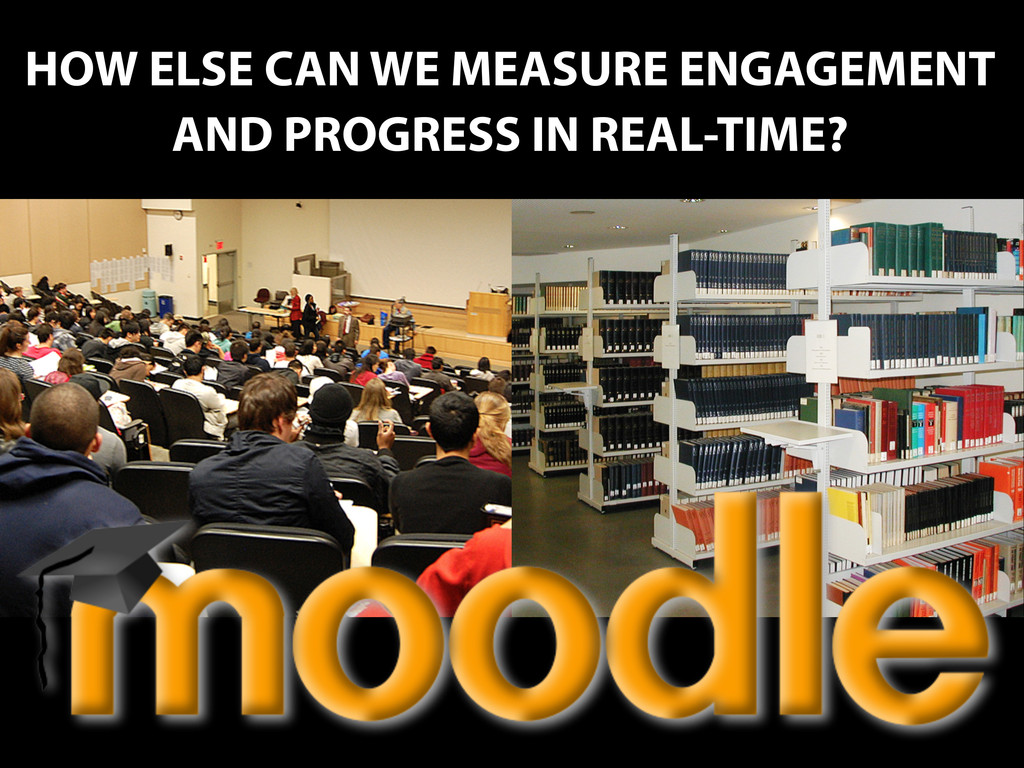
Retention and the measurement of student engagement are long standing problems within HE (Jones, 2008). A number of studies have investigated how students at risk of failing or withdrawing from University courses can be identified (e.g. Rugg et al.) but the issue still remains, and looks set to be a key concern with the rapid development of MOOCs within HE worldwide (Yuan and Powel, 2013). One area of research in this field that is receiving increased interest is the use of implicit data collection and analysis, commonly known as Learning Analytics (LA).

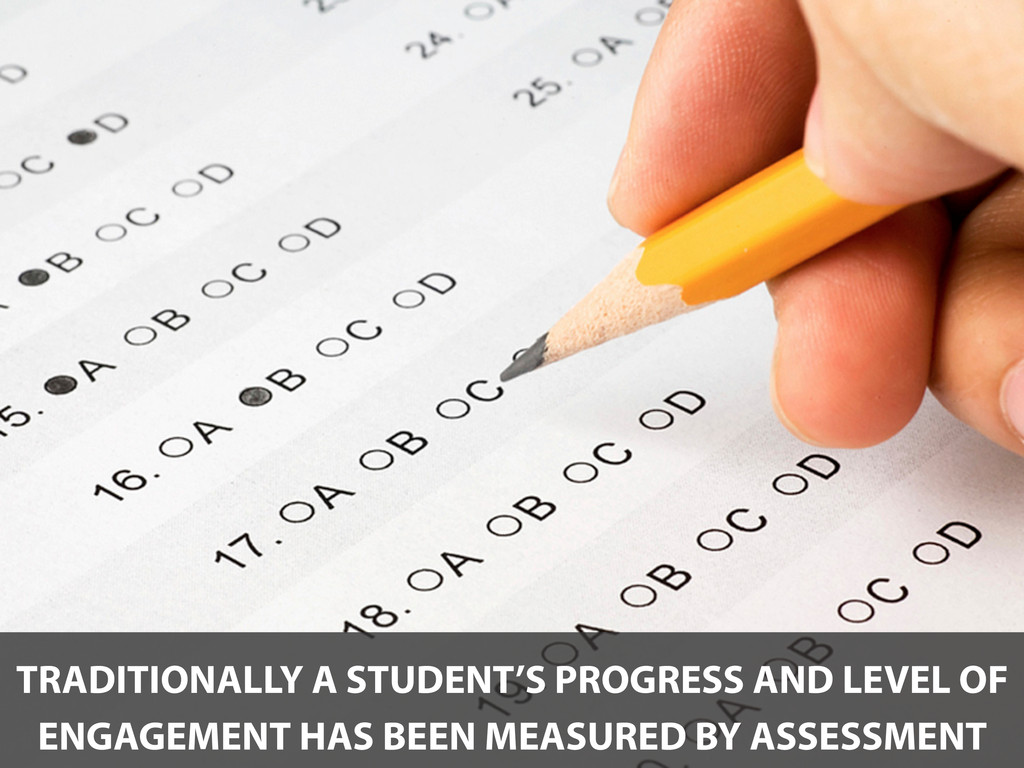
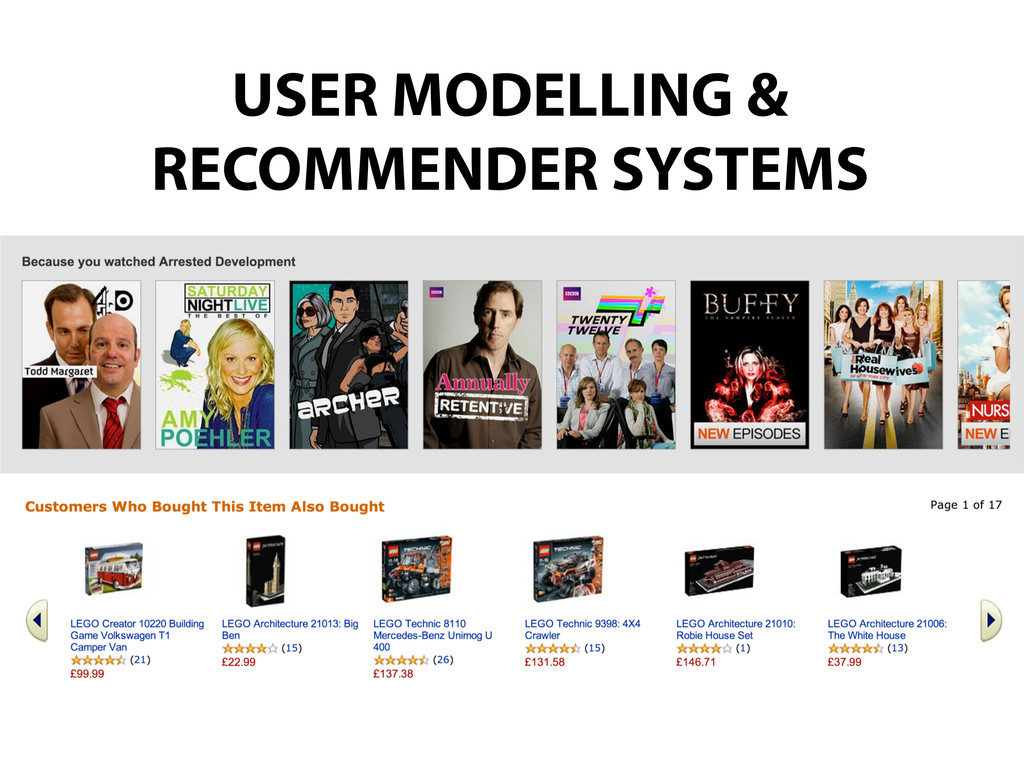
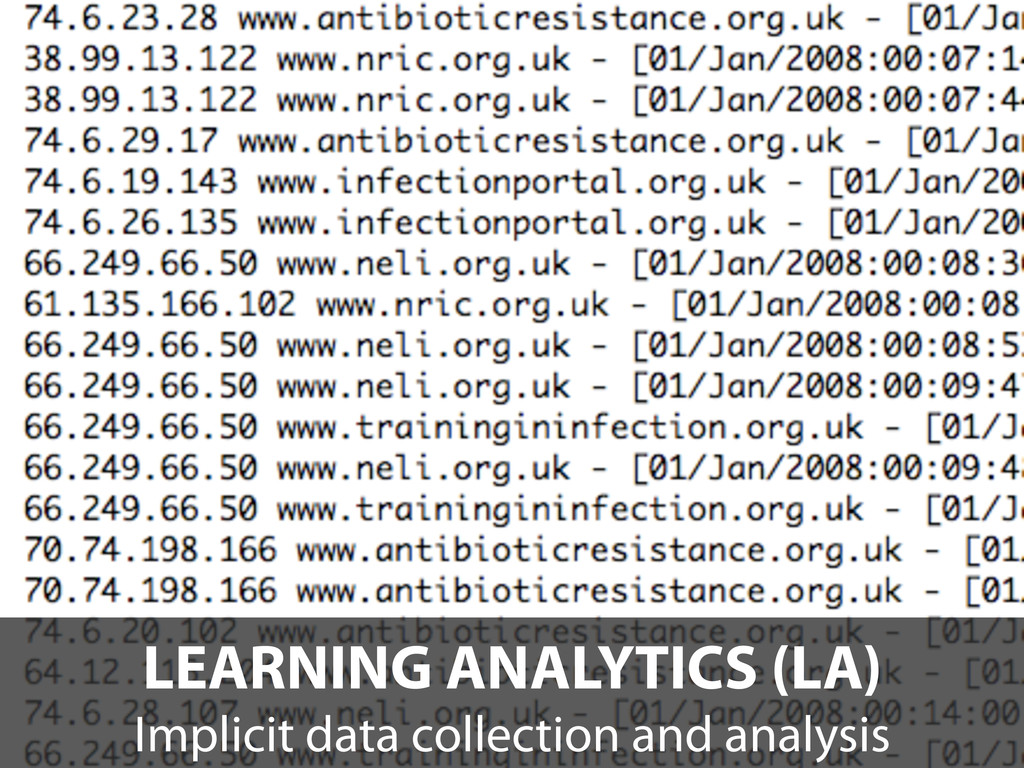
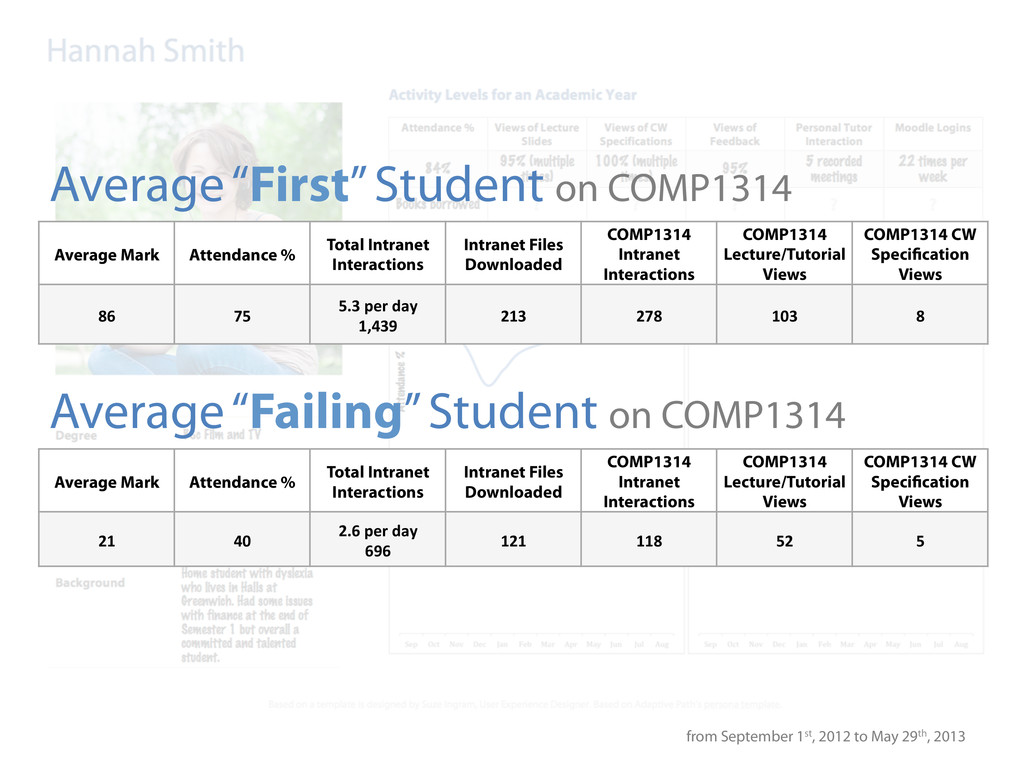
LA has been defined as a method for “deciphering trends and patterns from educational big data … to further the advancement of a personalized, supportive system of higher education." (Johnson et al., 2013). Traditionally a student’s progress and level of engagement has been measured by assessment. However, in a student’s day-to-day interactions with a University, other real-time measures are being generated that are currently not being fully utilised e.g. attendance, VLE server log data, library usage data, Web 2.0/social media usage.

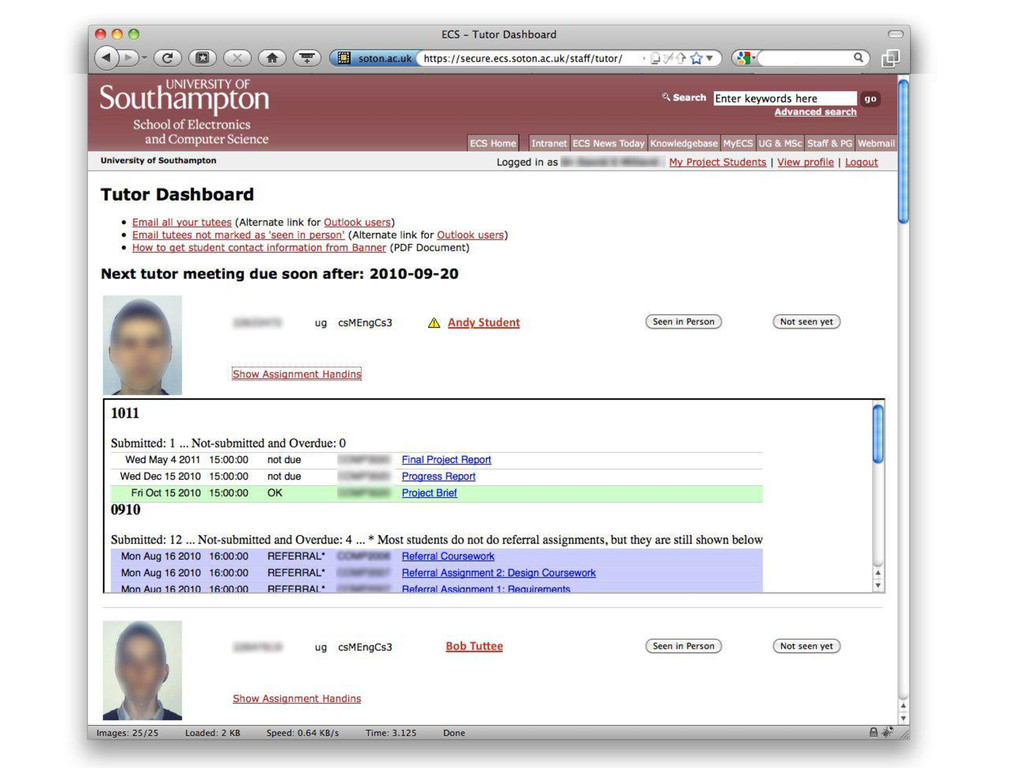
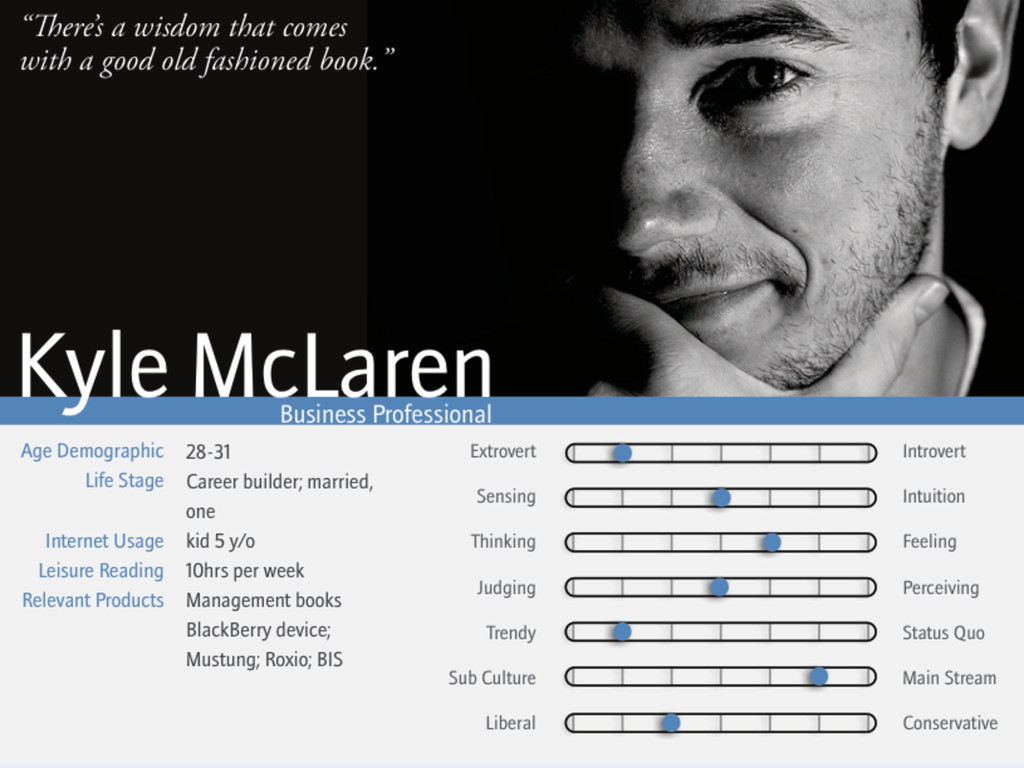
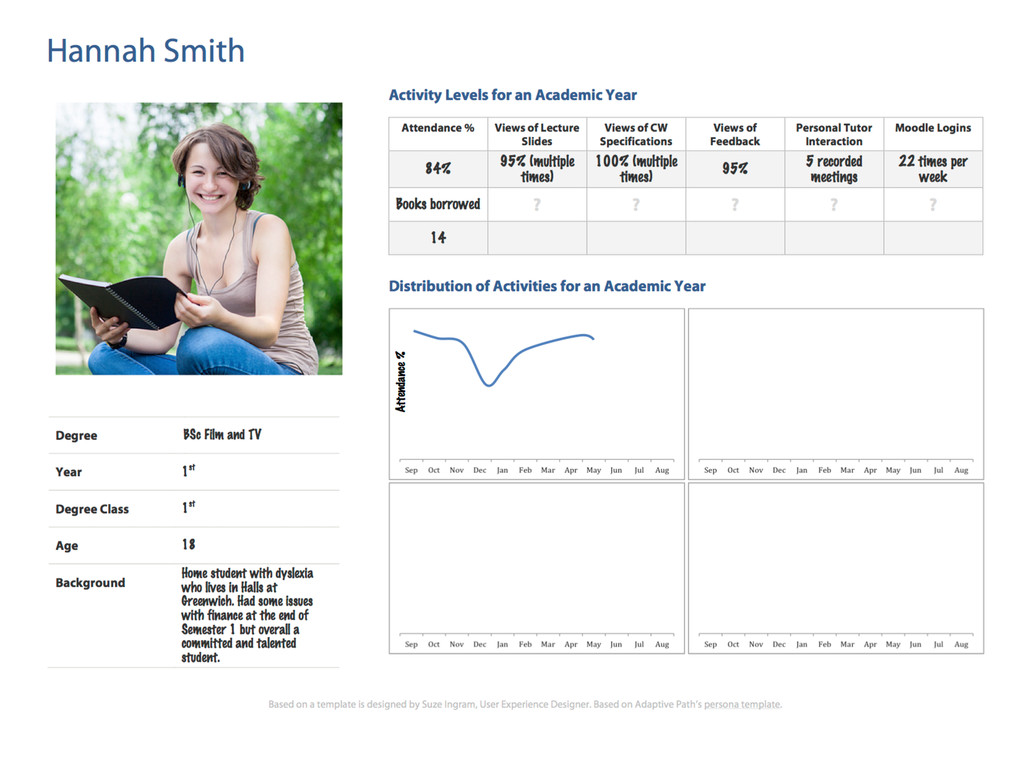
Increasingly, student data is being aggregated and presented to tutors in the form of a Dashboard e.g. the University of Southampton’s “Student Dashboard” (JISC, 2011) but a further problem is that the representations being used are often based upon the ability of the developer to extract information from disparate sources and not on the types of data and interpretive needs of the user, usually falling far short of their potential (Few, 2006).

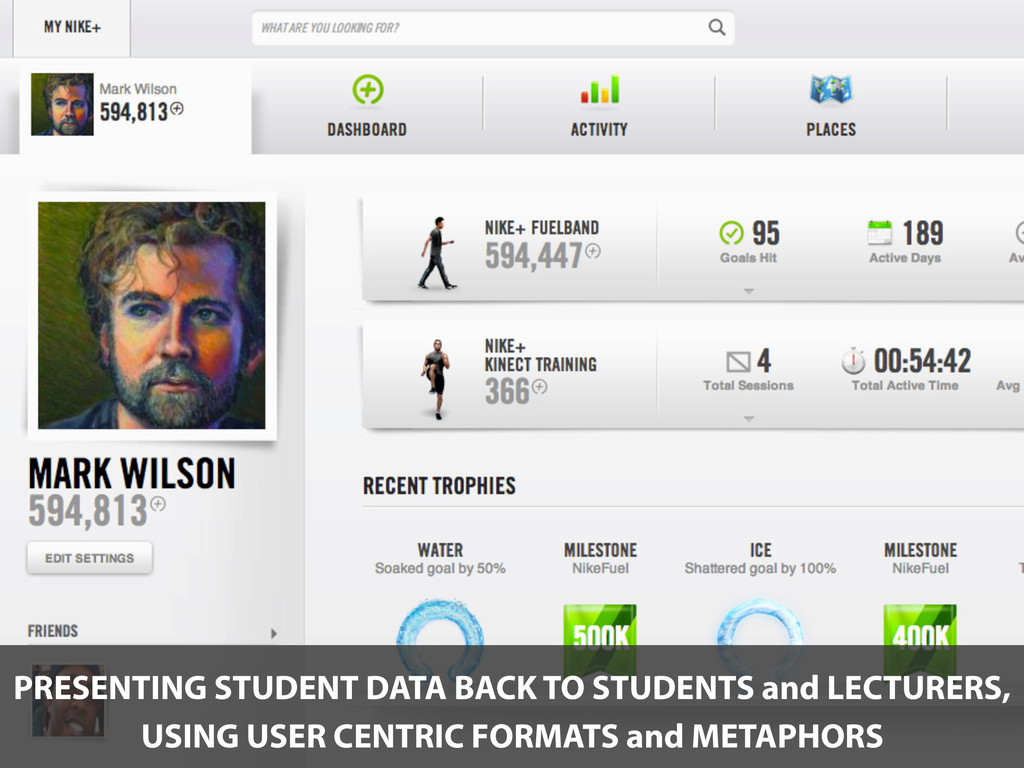
Making information available and transparent to tutors is only the first step however. Presenting student data back to students, using student centric formats and metaphors could tackle students’ inability to access a composite, over arching view of their current learning activity which can impact on a student’s ability to develop creative divergent thinking skills (Rugg and Gerrard, 2009). A related issue that is frequently reported is students’ inability to link skills that they are being taught on different courses together and how that impacts on both their employability and financial outlook.

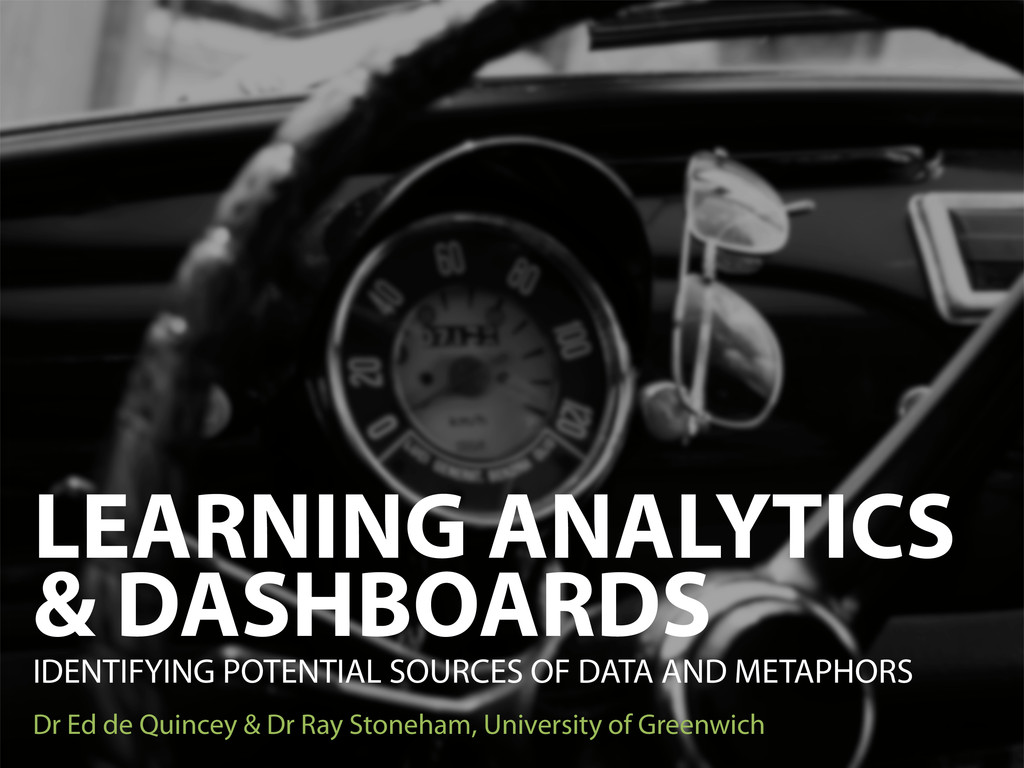
This workshop therefore intends to explore the potential sources of data that represent a student’s level of engagement and progress from both an academic and employers’ perspective and to then identify potential ways of aggregating and representing that data in the form of dashboards.

(Cartoon on slide 2 from http://www.all4ed.org/files/DF_01_1.jpg)
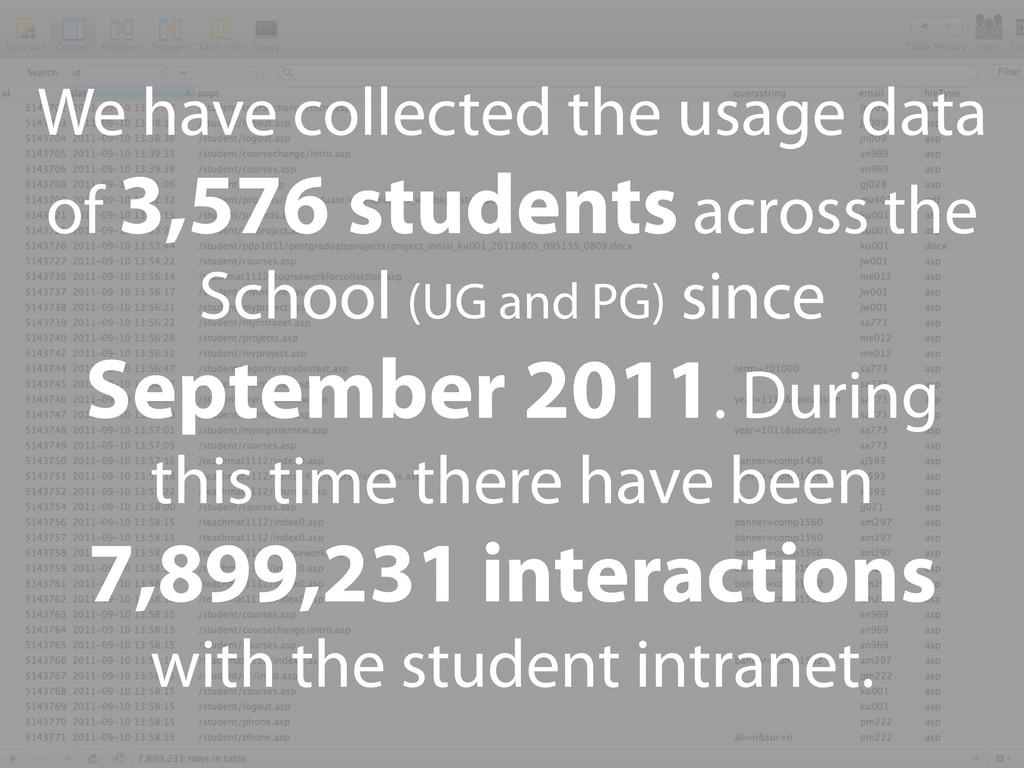
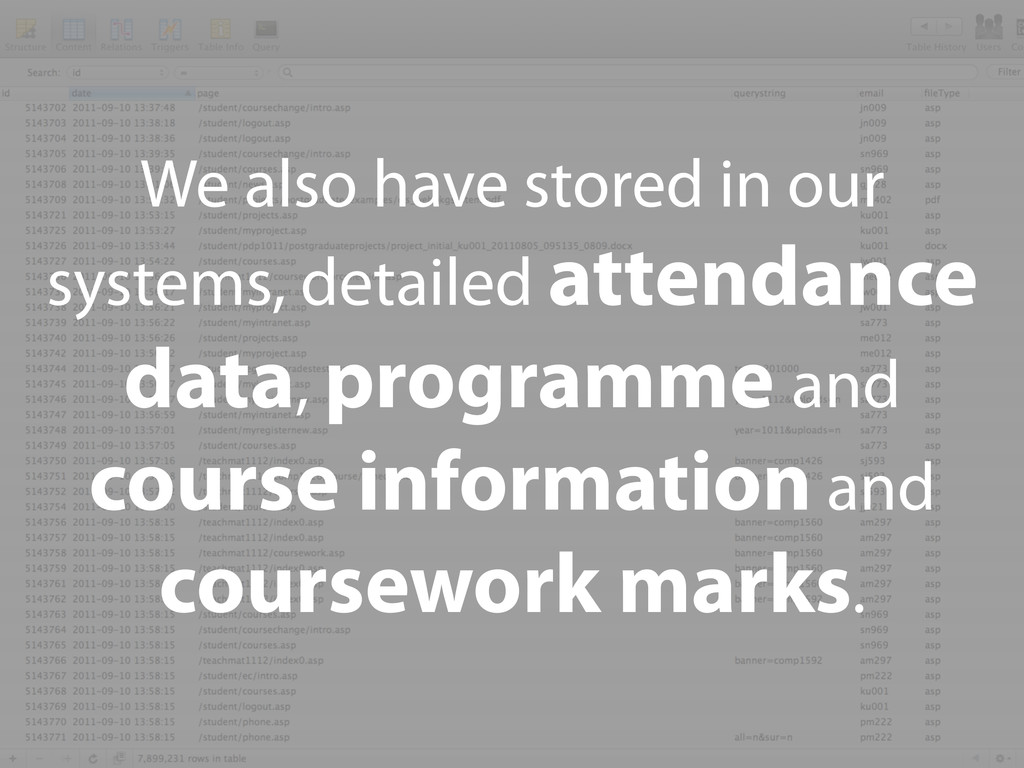
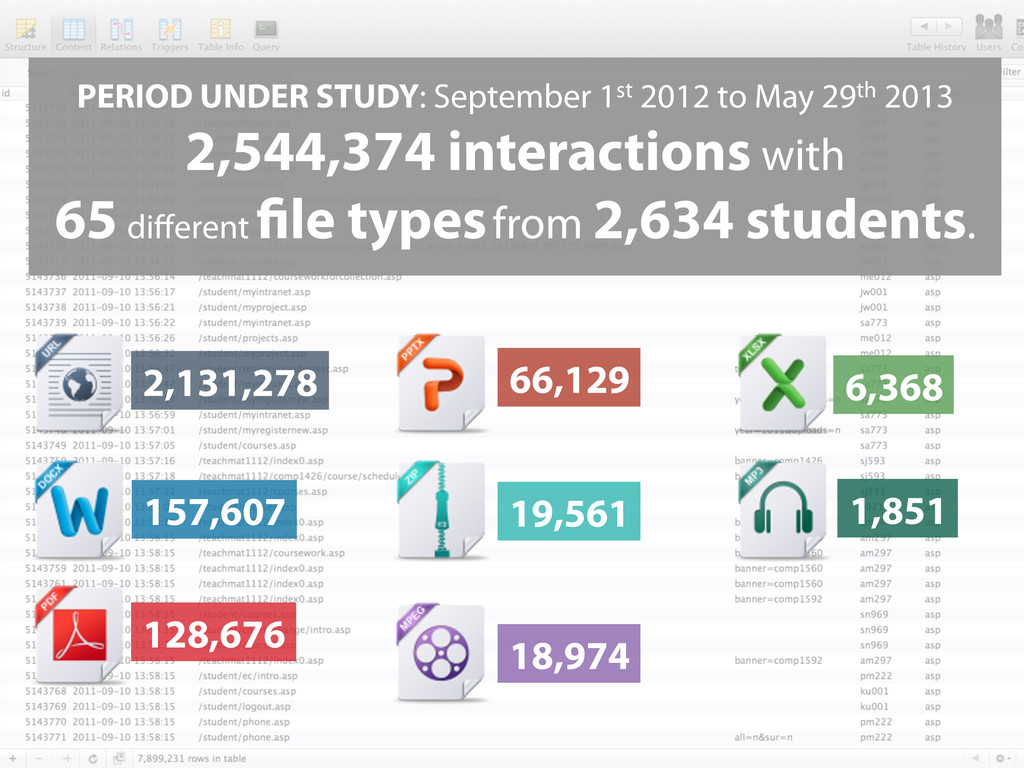
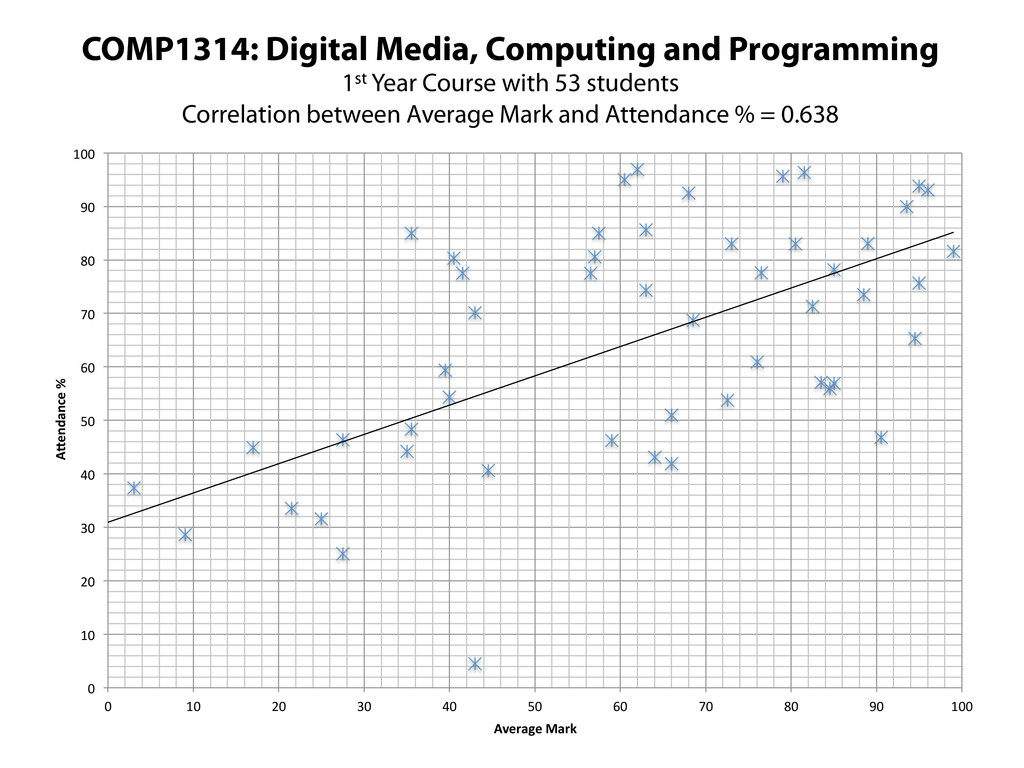
Ed de Quincey

July 02, 2013
Tweet

More Decks by Ed de Quincey

Other Decks in Education

Transcript

  1. LEARNING ANALYTICS
    & DASHBOARDS
    IDENTIFYING POTENTIAL SOURCES OF DATA AND METAPHORS
    Dr Ed de Quincey & Dr Ray Stoneham, University of Greenwich

    View Slide

  2. RETENTION AND THE MEASUREMENT OF STUDENT
    ENGAGEMENT ARE LONG STANDING PROBLEMS

    View Slide

  3. LOOKS SET TO BE A KEY CONCERN WITH THE RAPID
    DEVELOPMENT OF MOOCS WITHIN HE WORLDWIDE

    View Slide

  4. TRADITIONALLY A STUDENT’S PROGRESS AND LEVEL OF
    ENGAGEMENT HAS BEEN MEASURED BY ASSESSMENT

    View Slide

  5. EXPLICIT vs IMPLICIT METHODS

    View Slide

  6. USER MODELLING &
    RECOMMENDER SYSTEMS

    View Slide

  7. View Slide

  8. HOW ELSE CAN WE MEASURE ENGAGEMENT
    AND PROGRESS IN REAL-TIME?

    View Slide

  9. LEARNING ANALYTICS (LA)
    Implicit data collection and analysis

    View Slide

  10. Learning Analytics
    has been de ned as a method for
    “deciphering trends
    and patterns from
    educational big data
    … to further the
    advancement of a
    personalized,
    supportive system
    of higher education.”
    (Johnson et al., 2013)
    Co-authorship network map of physicians publishing on hepatitis C (detail)
    Source: http://www. ickr.com/photos/speedo ife/8274993170/

    View Slide

  11. View Slide

  12. PRESENTING STUDENT DATA BACK TO STUDENTS and LECTURERS,
    USING USER CENTRIC FORMATS and METAPHORS

    View Slide

  13. OVERVIEW of the CMS INTRANET
    WHAT DATA are we COLLECTING?

    View Slide

  14. Outline of the Workshop
    1.  Presentation of an ongoing study within the School
    of Computing and Mathematical Sciences which has
    analysed the attendance and Intranet usage of
    students and compared it to achievement levels.
    2.  Discussion and identi cation of other potential
    sources of data that represent student
    engagement levels from an academic and employer
    perspective.
    If time…
    3.  Discussion and identi cation of suitable metaphors and interfaces that
    represent student engagement levels from an academic and student
    perspective using a User Centered Design (UCD) methodology.
    4.  Discussion of how LA can be used to reinforce graduate skills and digital
    literacies for enhancing employability.

    View Slide

  15. Outline of the Workshop
    1.  Presentation of an ongoing study within the School
    of Computing and Mathematical Sciences which has
    analysed the attendance and Intranet usage of
    students and compared it to achievement levels.
    2.  Discussion and identi cation of other potential
    sources of data that represent student
    engagement levels from an academic and employer
    perspective.
    If time…
    3.  Discussion and identi cation of suitable metaphors and interfaces that
    represent student engagement levels from an academic and student
    perspective using a User Centered Design (UCD) methodology.
    4.  Discussion of how LA can be used to reinforce graduate skills and digital
    literacies for enhancing employability.

    View Slide

  16. View Slide

  17. View Slide

  18. We have collected the usage data
    of 3,576 students across the
    School (UG and PG) since
    September 2011. During
    this time there have been
    7,899,231 interactions
    with the student intranet.

    View Slide

  19. We also have stored in our
    systems, detailed attendance
    data, programme and
    course information and
    coursework marks.

    View Slide

  20. PERIOD UNDER STUDY: September 1st 2012 to May 29th 2013
    2,544,374 interactions with
    65 different le types from 2,634 students.
    2,131,278
    18,974
    157,607
    128,676
    6,368
    66,129
    1,851
    19,561

    View Slide

  21. COMP1314: Digital Media, Computing and Programming
    1st Year Course with 53 students
    Correlation between Average Mark and Attendance % = 0.638
    0  
    10  
    20  
    30  
    40  
    50  
    60  
    70  
    80  
    90  
    100  
    0   10   20   30   40   50   60   70   80   90   100  
    A"endance  %  
    Average  Mark  

    View Slide

  22. COMP1314: Digital Media, Computing and Programming
    1st Year Course with 53 students
    Correlation between Average Mark and Intranet Activity = 0.601
    0  
    500  
    1000  
    1500  
    2000  
    2500  
    3000  
    3500  
    0   10   20   30   40   50   60   70   80   90   100  
    Number  of  interac7ons  with  Intranet  
    Average  Mark  

    View Slide

  23. COMP1314: Digital Media, Computing and Programming
    1st Year Course with 53 students
    Correlation
    Intranet  interac4ons/Average  mark 0.601614385
    Overall  [email protected]/Average  mark 0.637771689
    Intranet  interac4ons/Overall  [email protected] 0.438059389
    COMP1314  Intranet  interac4ons/Average  mark 0.627753051
    Lecture/tutorial  slide  views/Average  mark 0.480171638
    Lecture  slide/tutorial  views/Overall  [email protected] 0.45670929
    Coursework  specifica4on  views/Average  mark 0.229025047

    View Slide

  24. COMP1640: Enterprise Web Software Development
    3rd Year Course with 109 students
    Correlation
    Intranet  interac4ons/Average  mark 0.168484881
    Overall  [email protected]/Average  mark 0.418583626
    Intranet  interac4ons/Overall  [email protected] 0.234846724
    COMP1640  Intranet  interac4ons/Average  mark 0.188256752
    Lecture/tutorial  slide  views/Average  mark -0.067577432
    Lecture  slide/tutorial  views/Overall  [email protected] 0.183237816
    Coursework  specifica4on  views/Average  mark 0.378425564

    View Slide

  25. Outline of the Workshop
    1.  Presentation of an ongoing study within the School
    of Computing and Mathematical Sciences which has
    analysed the attendance and Intranet usage of
    students and compared it to achievement levels.
    2.  Discussion and identi cation of other potential
    sources of data that represent student
    engagement levels from an academic and employer
    perspective.
    If time…
    3.  Discussion and identi cation of suitable metaphors and interfaces that
    represent student engagement levels from an academic and student
    perspective using a User Centered Design (UCD) methodology.
    4.  Discussion of how LA can be used to reinforce graduate skills and digital
    literacies for enhancing employability.

    View Slide

  26. What Is a Persona?
    A persona represents a cluster of
    users who exhibit similar
    behavioral patterns in their
    purchasing decisions, use of
    technology or products, customer
    service preferences, lifestyle choices,
    and the like. Behaviors, attitudes,
    and motivations are common to a
    "type" regardless of age, gender,
    education, and other typical
    demographics. In fact, personas
    vastly span demographics.
    (O’Connor, 2011)
    http://uxmag.com/articles/personas-the-foundation-of-a-great-user-experience

    View Slide

  27. View Slide

  28. View Slide

  29. USDA Senior Manager Gatekeepers
    Matthew Johnson
    Program Staff Director, USDA
    Matthew is 51-year-old married father of three children and
    one grandchild. He has a Ph.D. in Agricultural Economics
    who spends his work time requesting and reviewing research
    reports, preparing memos and briefs for agency heads, and
    supervising staff efforts in food safety and inspection. He is
    focused, goal-oriented within a strong leadership role. One of
    his concerns is maintaining quality across all output of
    programs. He is comfortable using a computer and refers to
    himself as an intermediate Internet user. He is connected via
    a T1 connection at work and dial-up at home. He uses email
    extensively and uses the web about 1.5 hours during his work
    day. He is most likely heard saying: “Can you get me that staff
    analysis by Tuesday?”
    http://www.usability.gov/methods/analyze_current/personas.html

    View Slide

  30. View Slide

  31. Average Mark Attendance %
    Total Intranet
    Interactions
    Intranet Files
    Downloaded
    COMP1314
    Intranet
    Interactions
    COMP1314
    Lecture/Tutorial
    Views
    COMP1314 CW
    Speci cation
    Views
    86   75  
    5.3  per  day  
    1,439  
    213   278   103   8  
    Average “First” Student on COMP1314
    Average Mark Attendance %
    Total Intranet
    Interactions
    Intranet Files
    Downloaded
    COMP1314
    Intranet
    Interactions
    COMP1314
    Lecture/Tutorial
    Views
    COMP1314 CW
    Speci cation
    Views
    21   40  
    2.6  per  day  
    696  
    121   118   52   5  
    Average “Failing” Student on COMP1314
    from September 1st, 2012 to May 29th, 2013

    View Slide

  32. “First” Students vs “Failing” Students
    COMP1314 Average Intranet Interactions  
    0  
    10  
    20  
    30  
    40  
    50  
    60  
    Sep   Oct   Nov   Dec   Jan   Feb   Mar   Apr   May  
    Average  Number  of  Intranet  Interac7ons  
    First  Logs  
    Fail  Logs  

    View Slide