Upgrade to Pro — share decks privately, control downloads, hide ads and more …

BDX.io: Managing your Black Friday Logs

Elastic Co
November 10, 2017

BDX.io: Managing your Black Friday Logs

Monitoring an entire application is not a simple task, but with the right tools it is not a hard task either. However, events like Black Friday can push your application to the limit, and even cause crashes. As the system is stressed, it generates a lot more logs, which may crash the monitoring system as well. In this talk I will walk through the best practices when using the Elastic Stack to centralize and monitor your logs. I will also share some tricks to help you with the huge increase of traffic typical in Black Fridays.
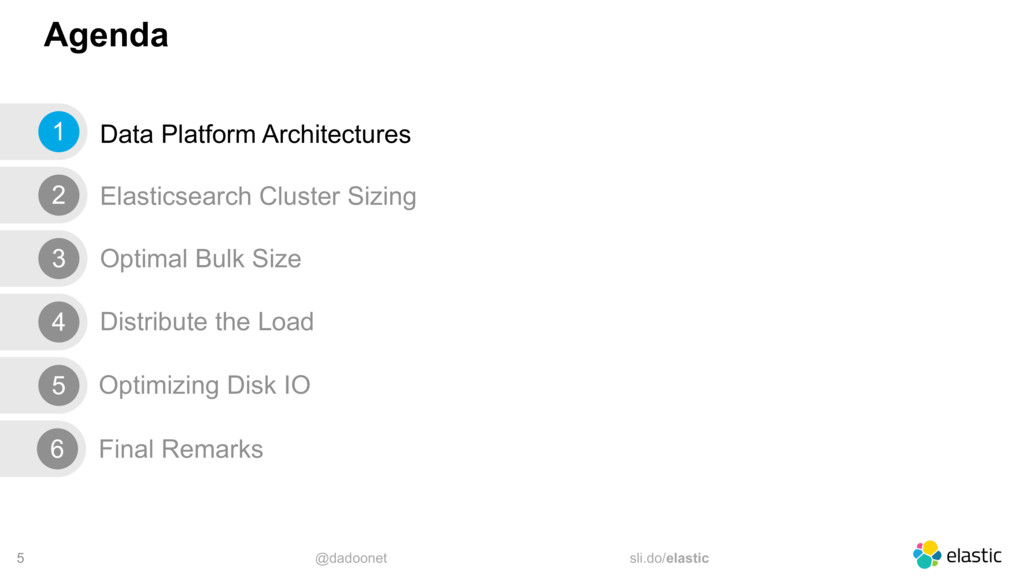
Topics include:

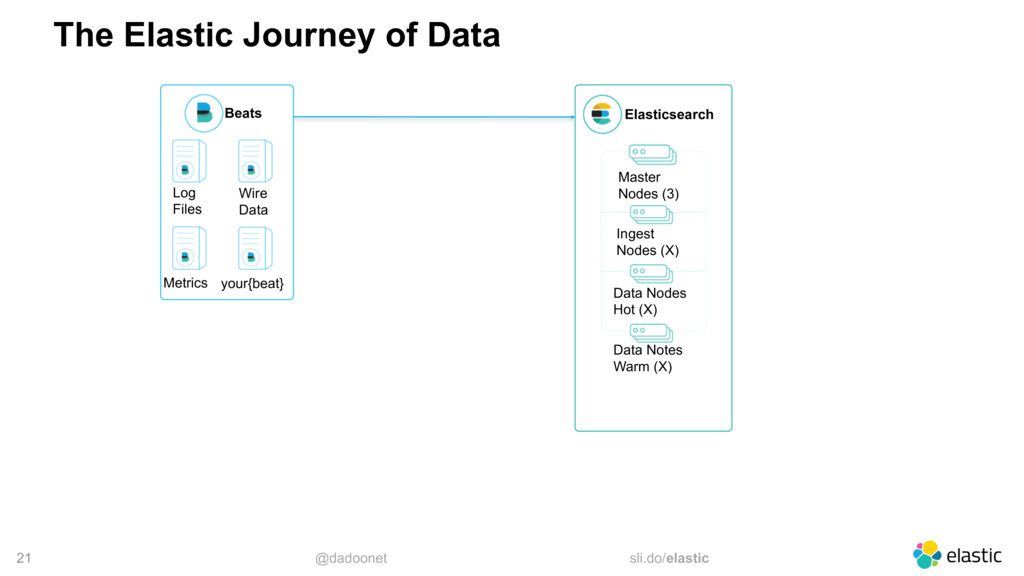
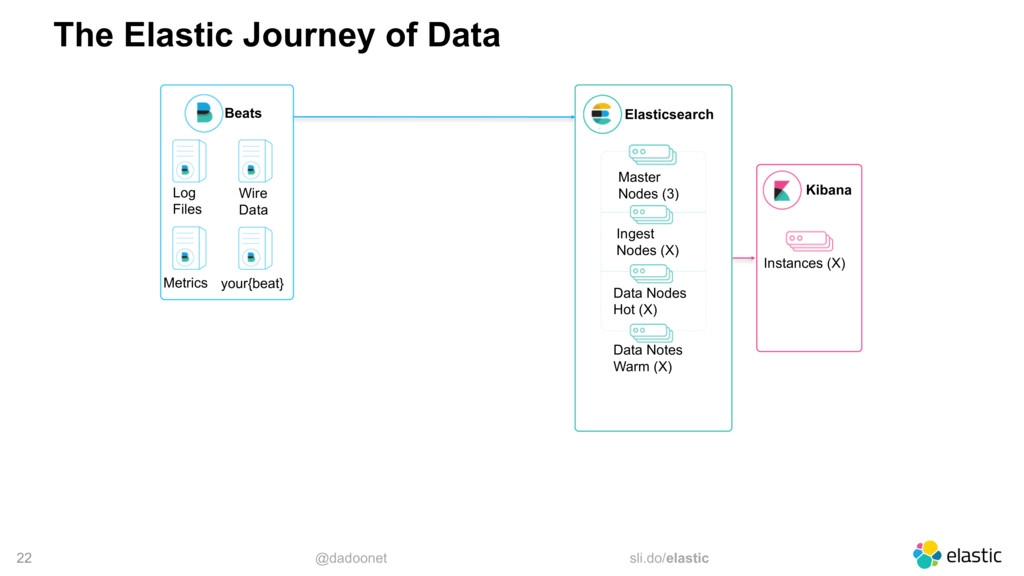
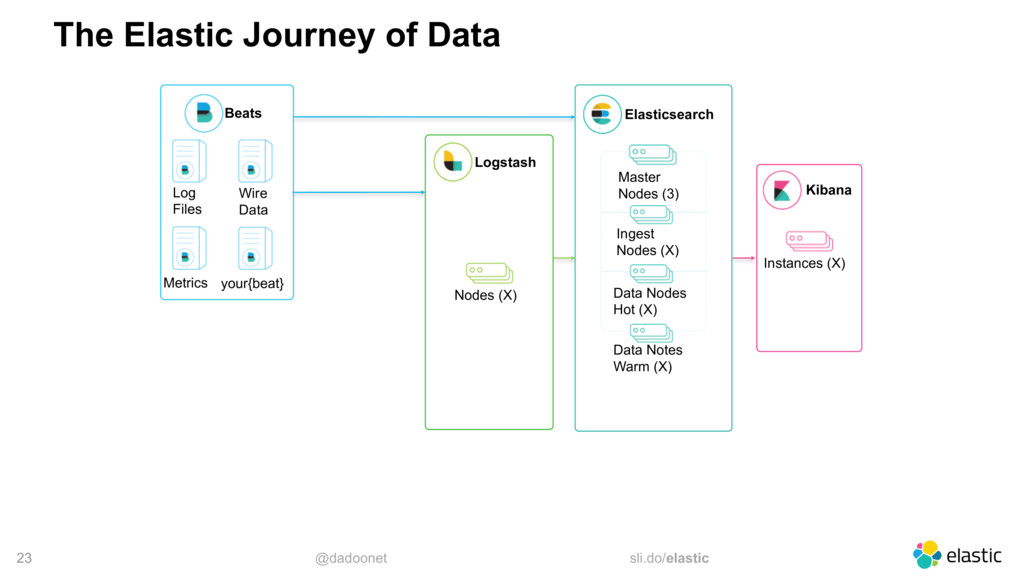
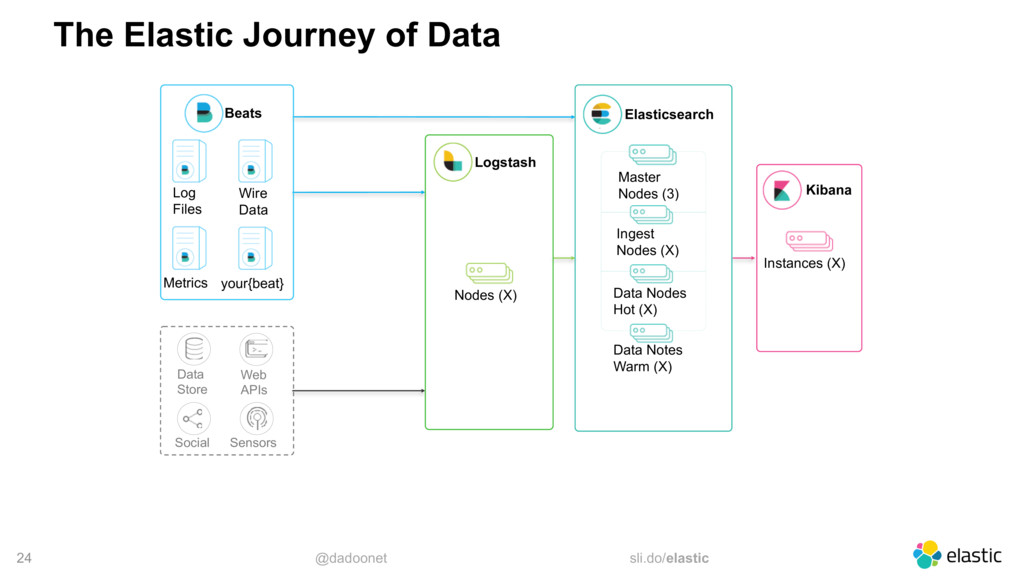
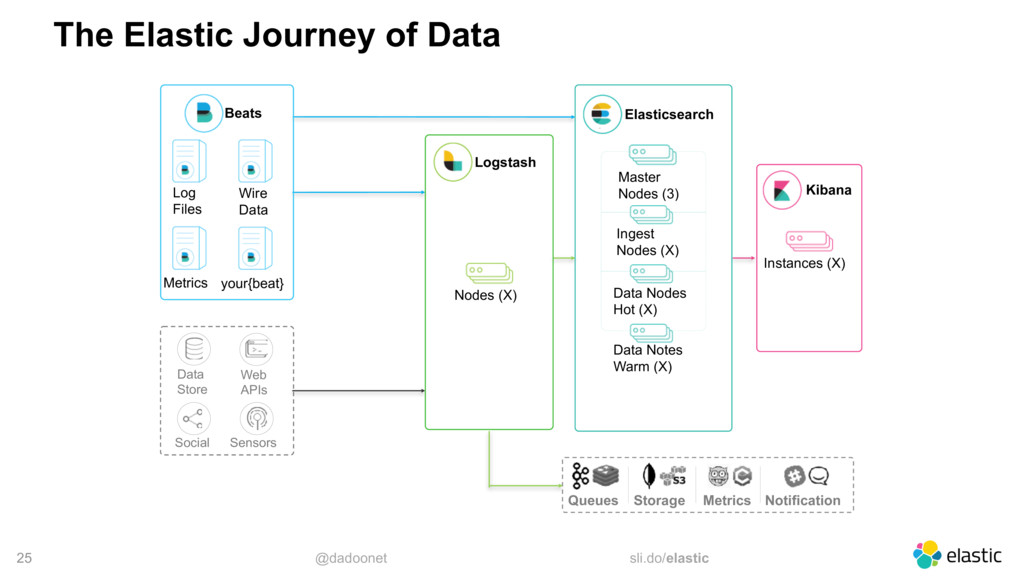
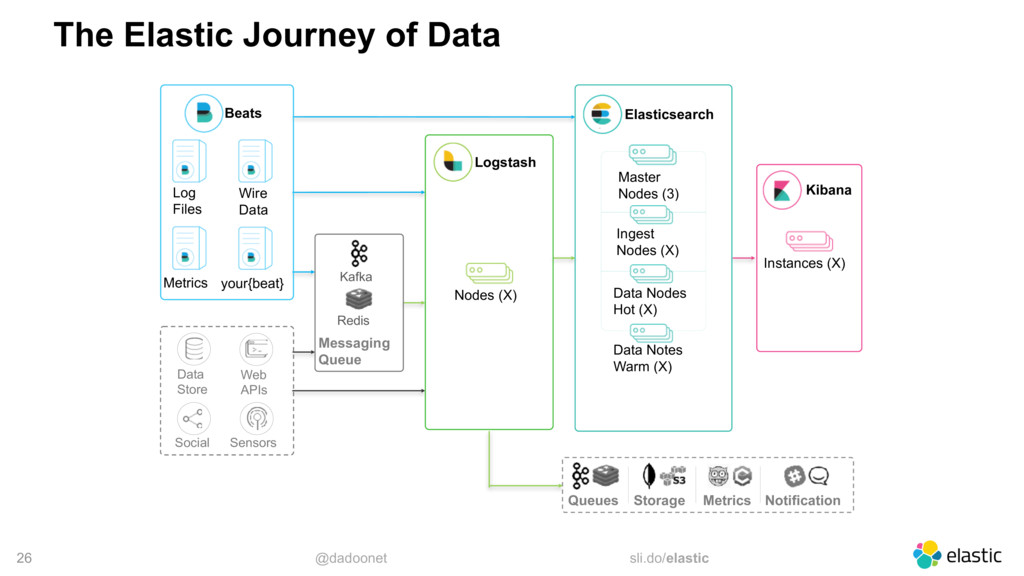
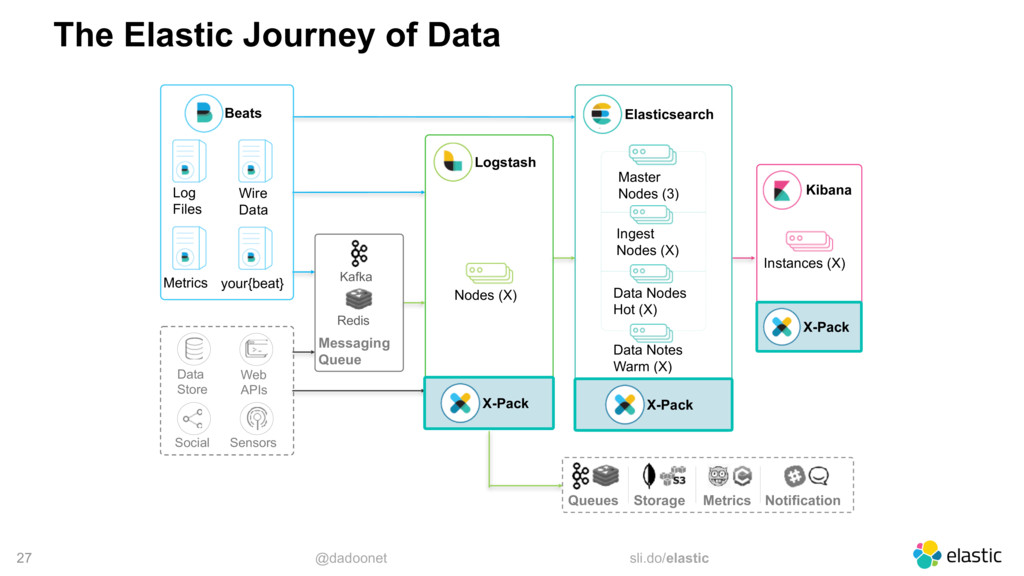
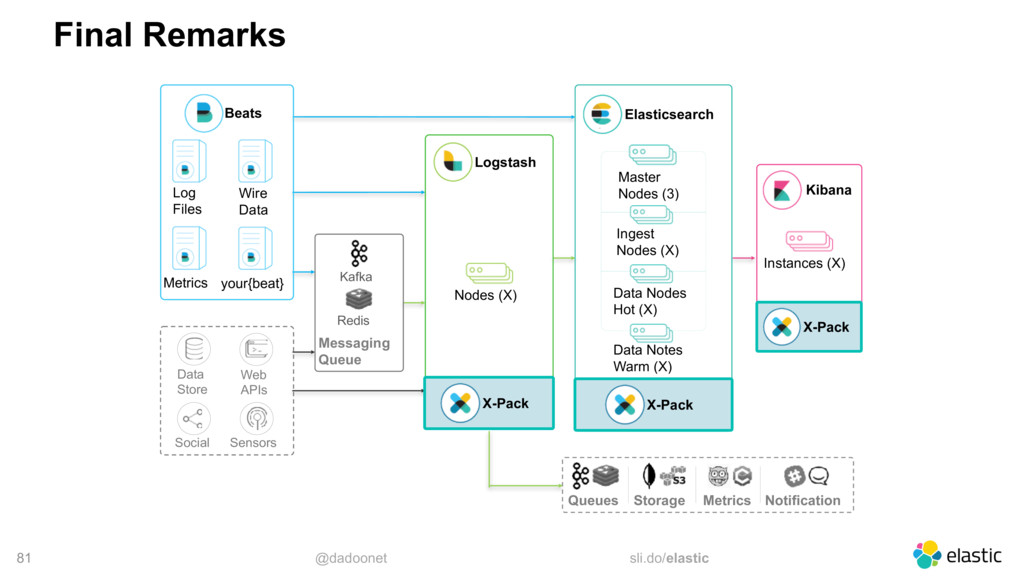
monitoring architectures
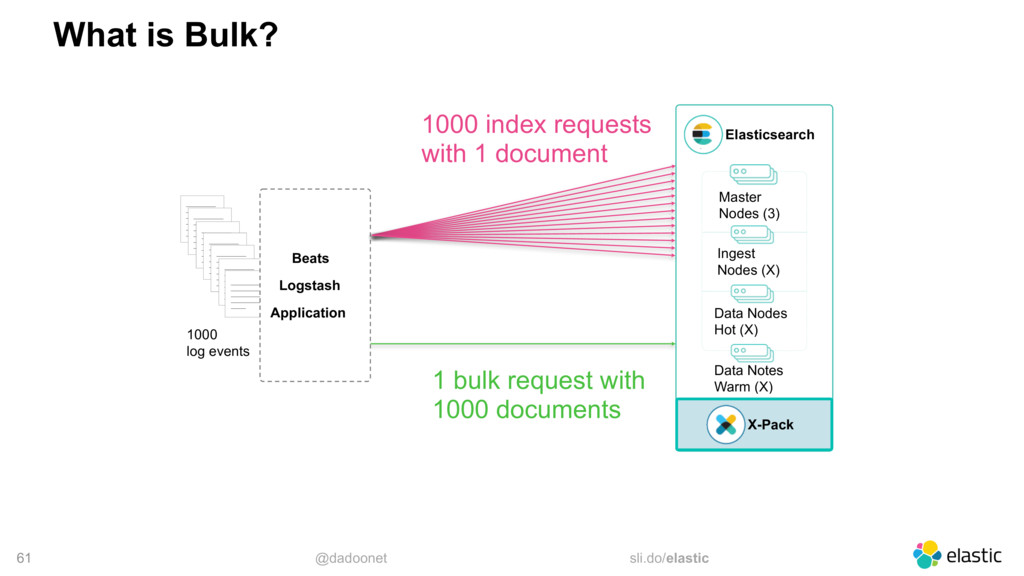
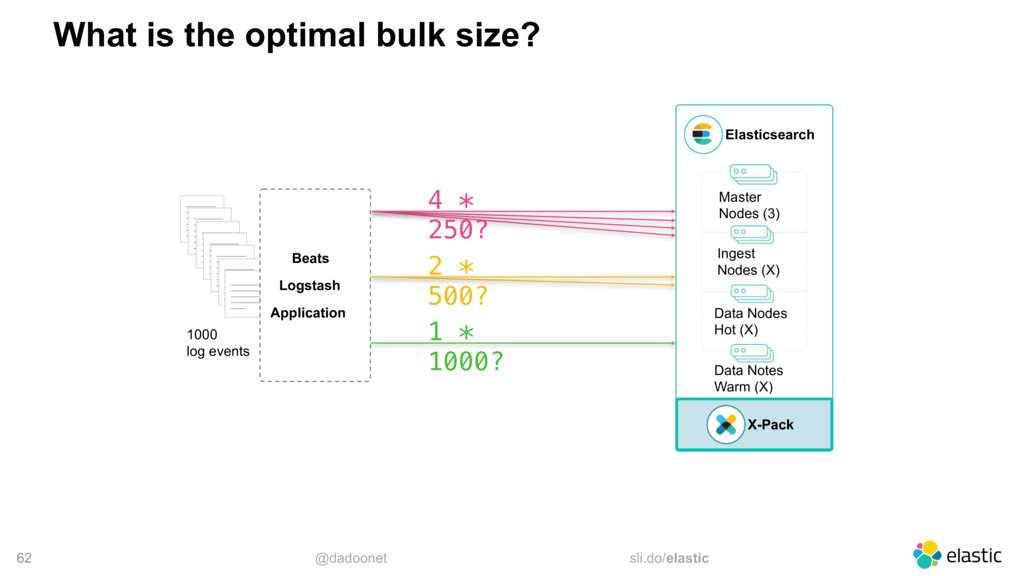
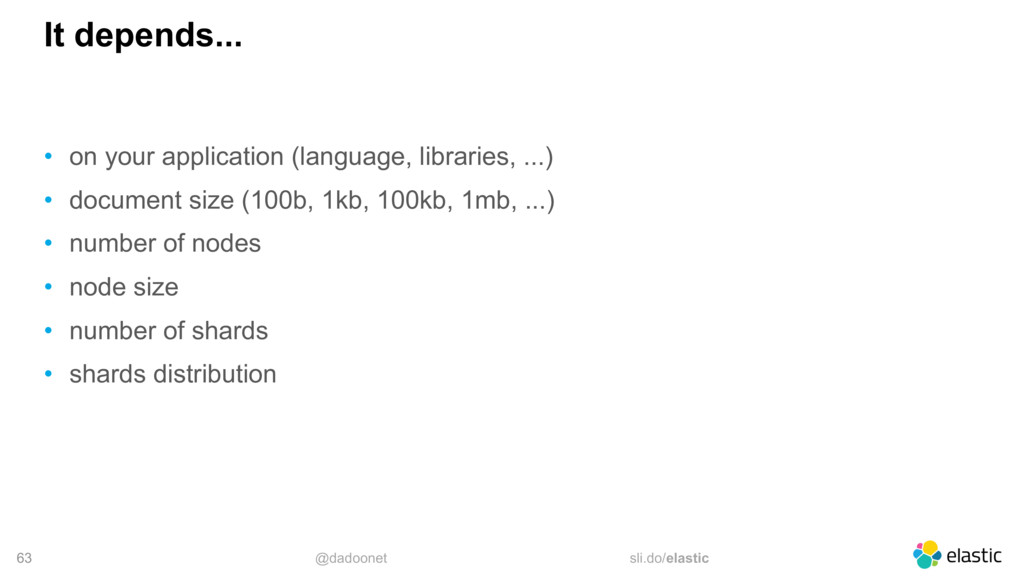
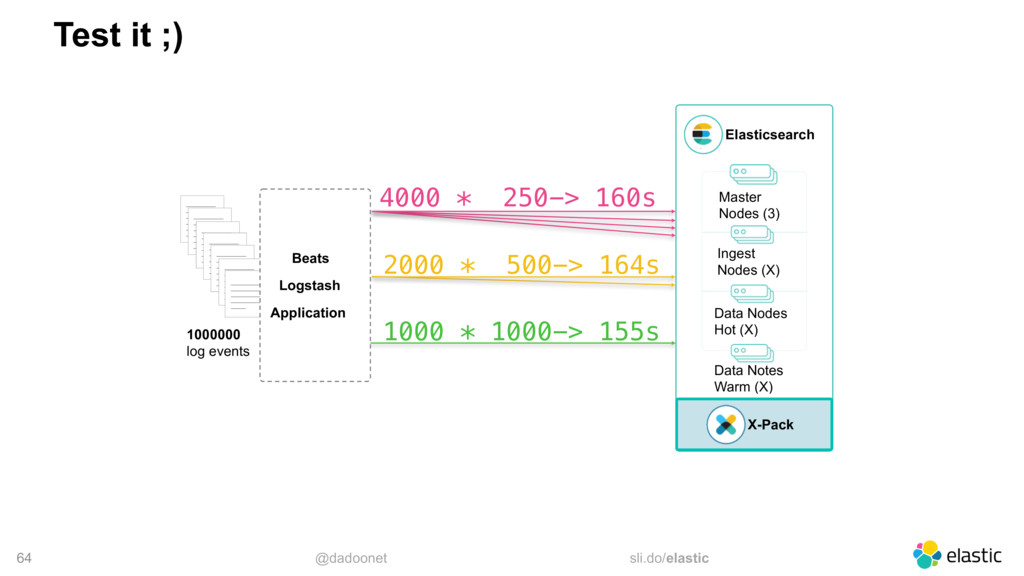
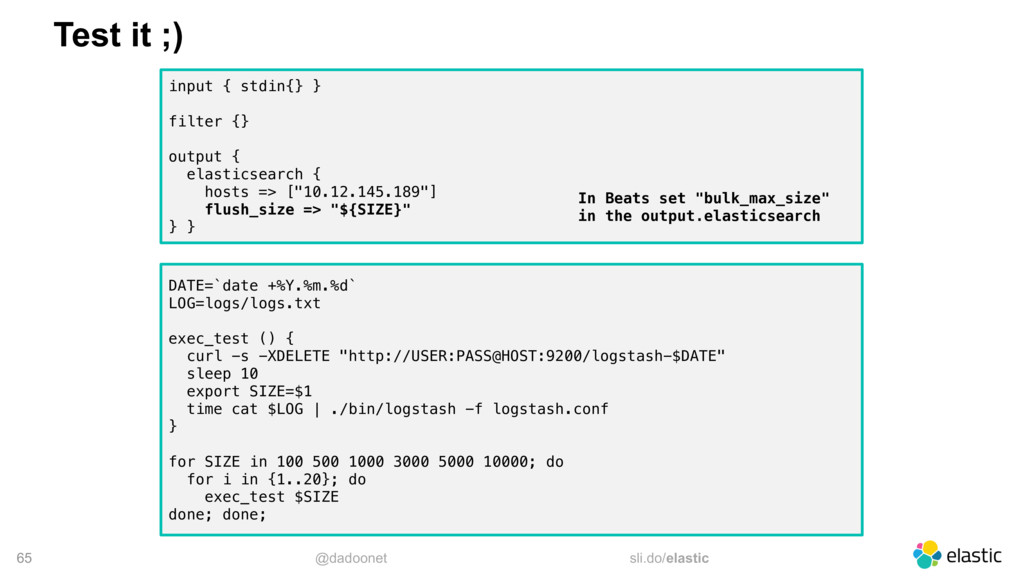
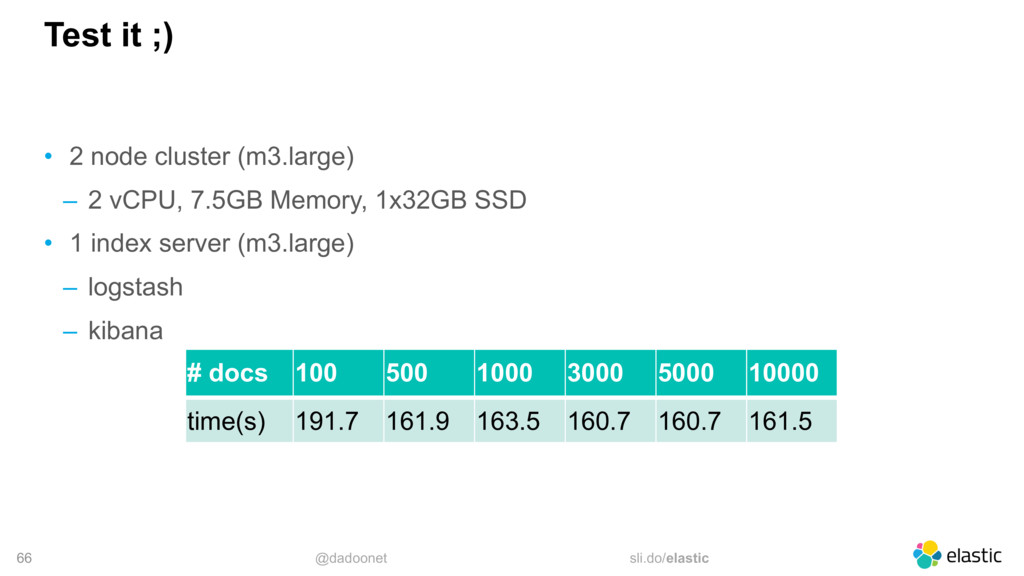
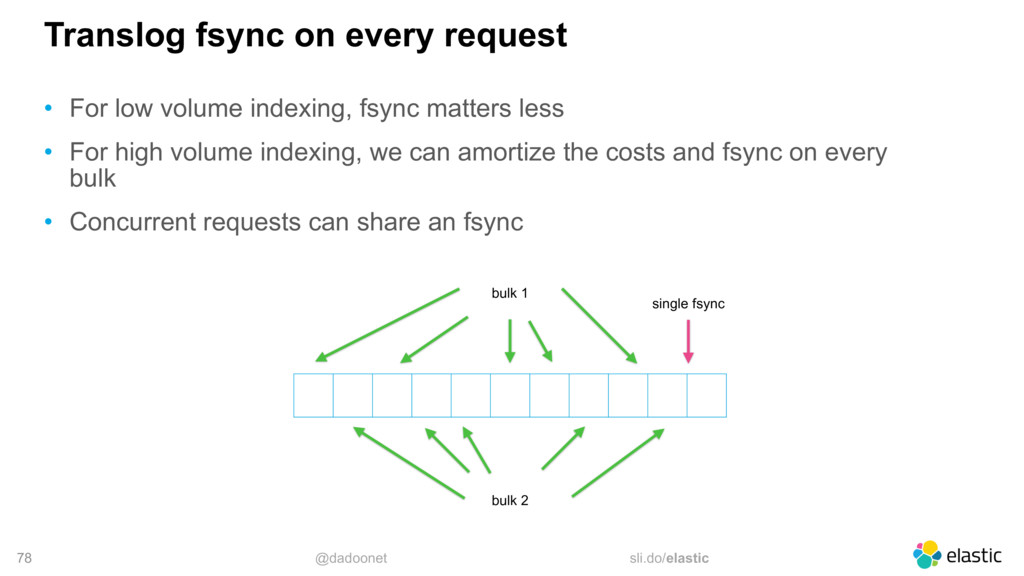
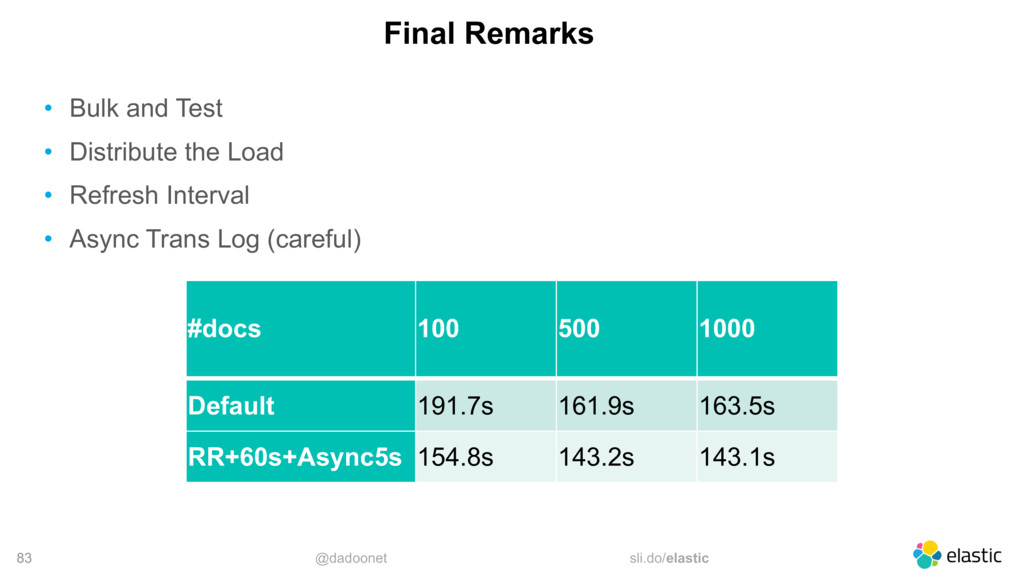
optimal bulk size
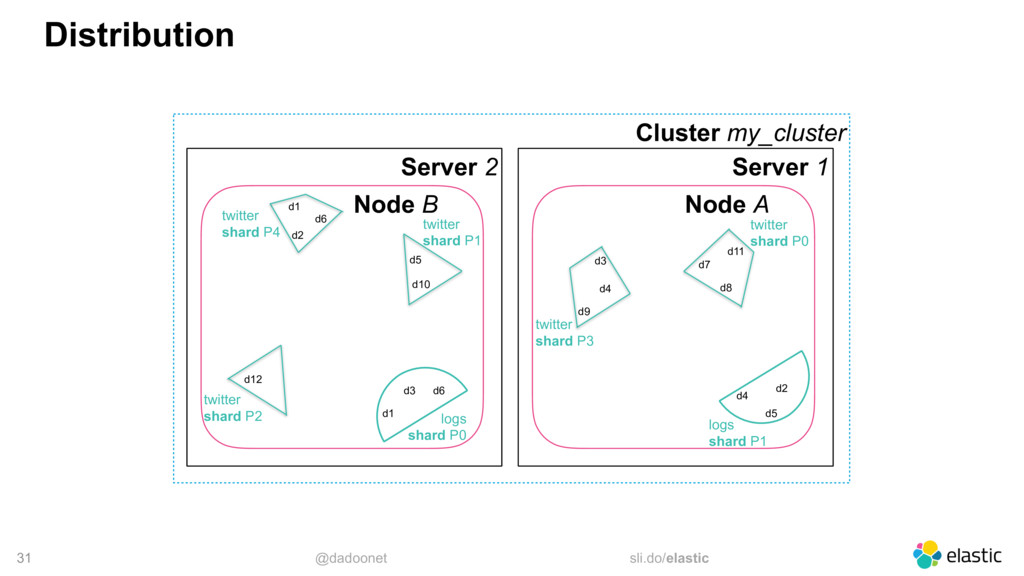
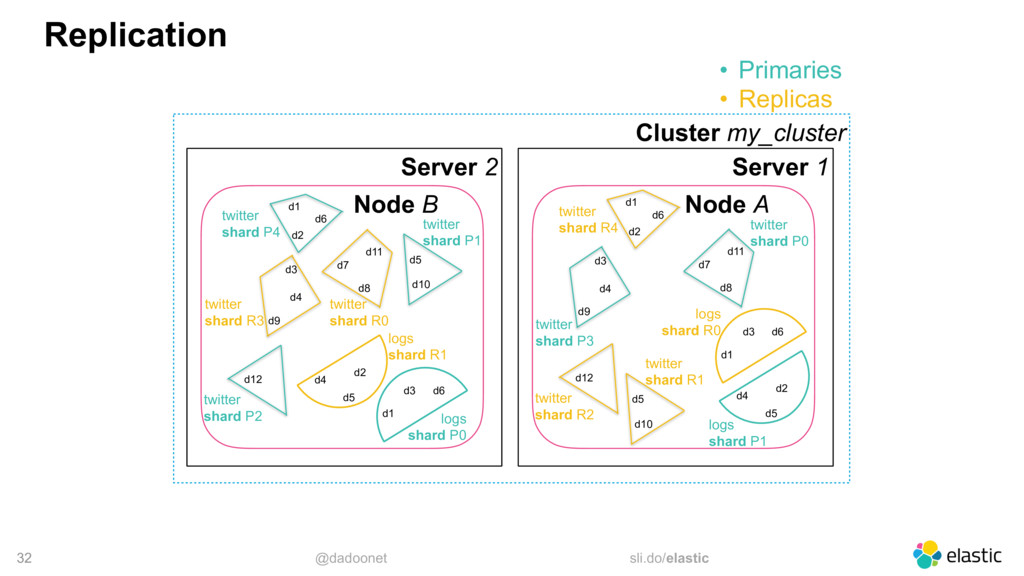
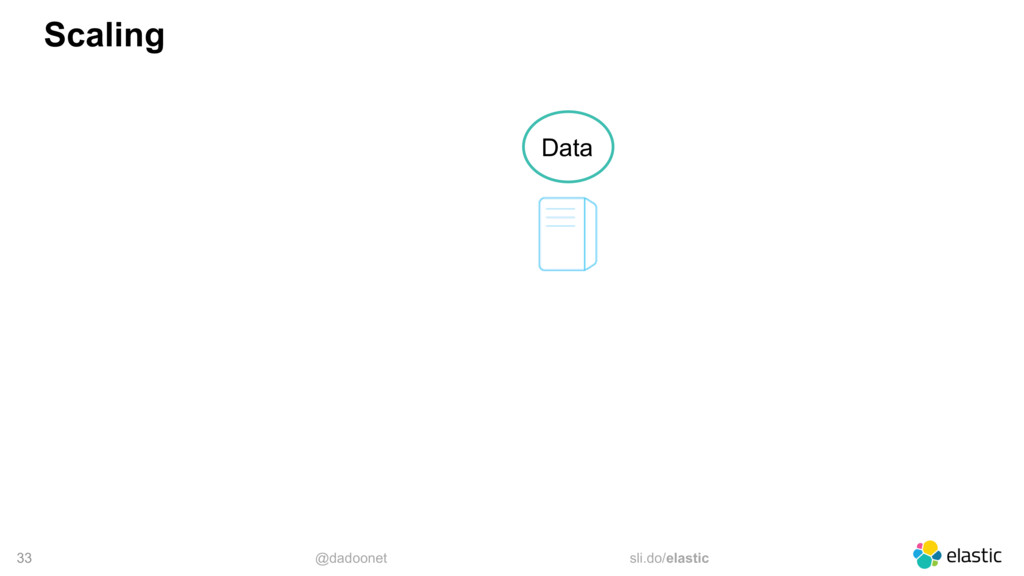
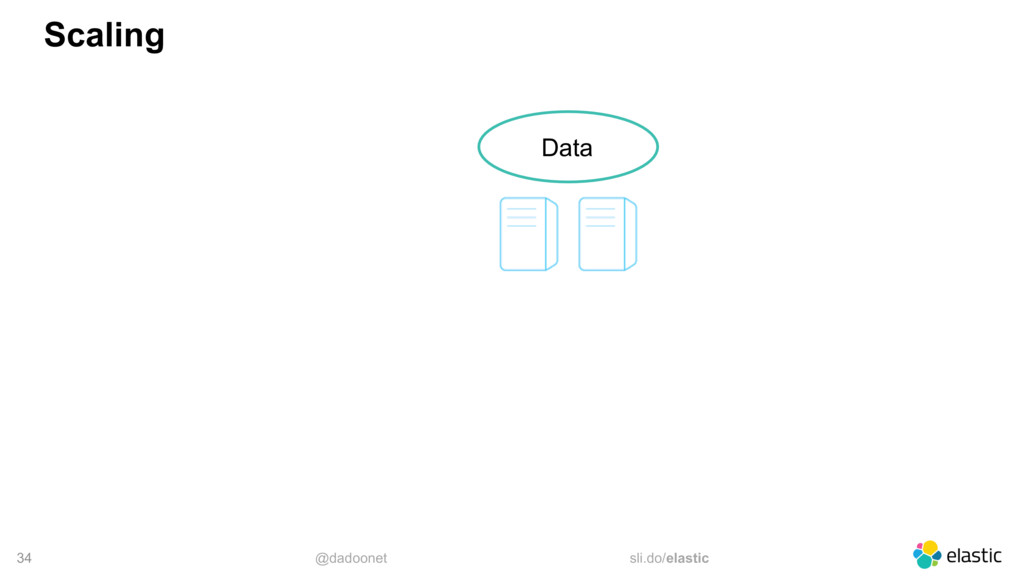
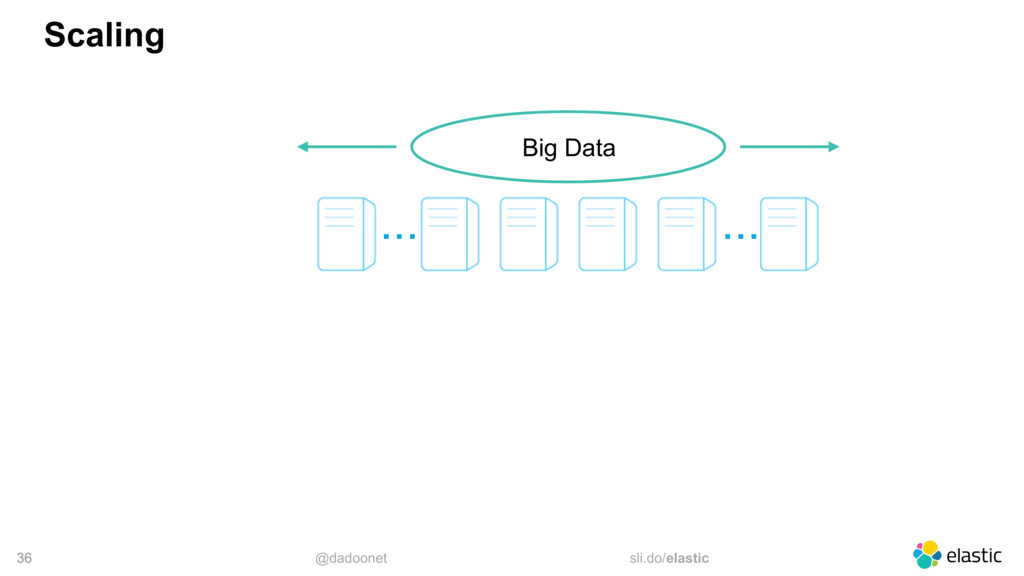
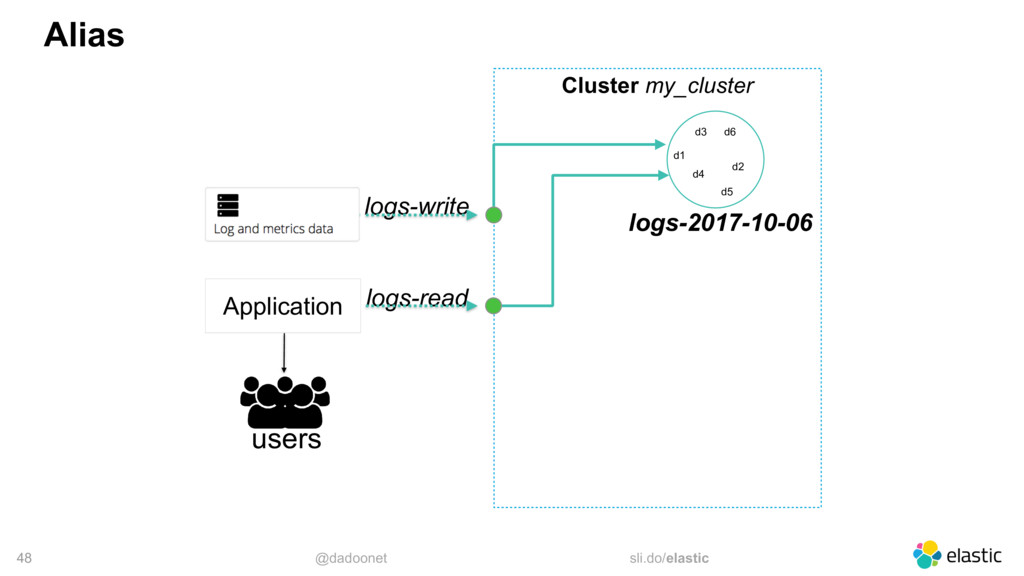
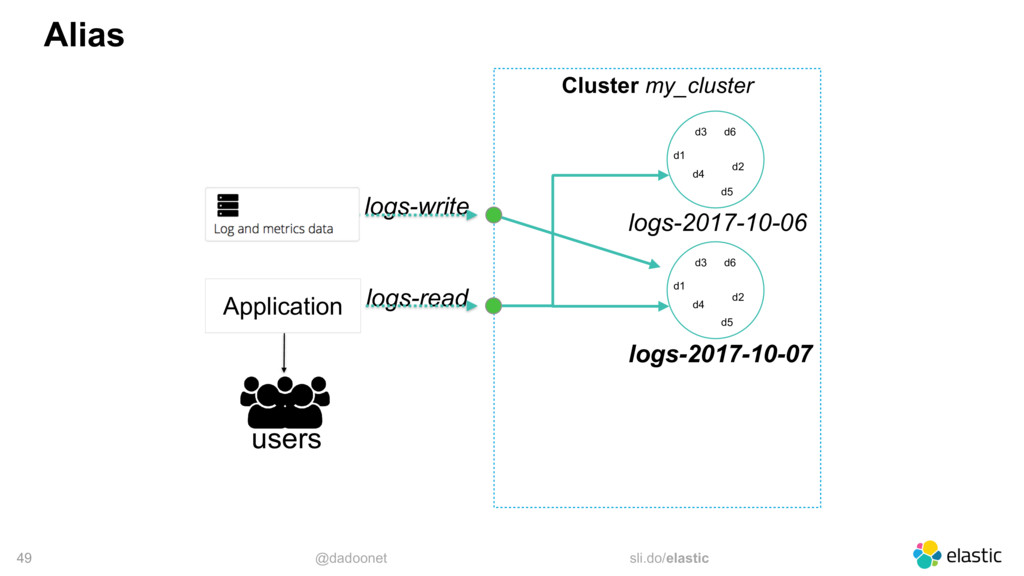
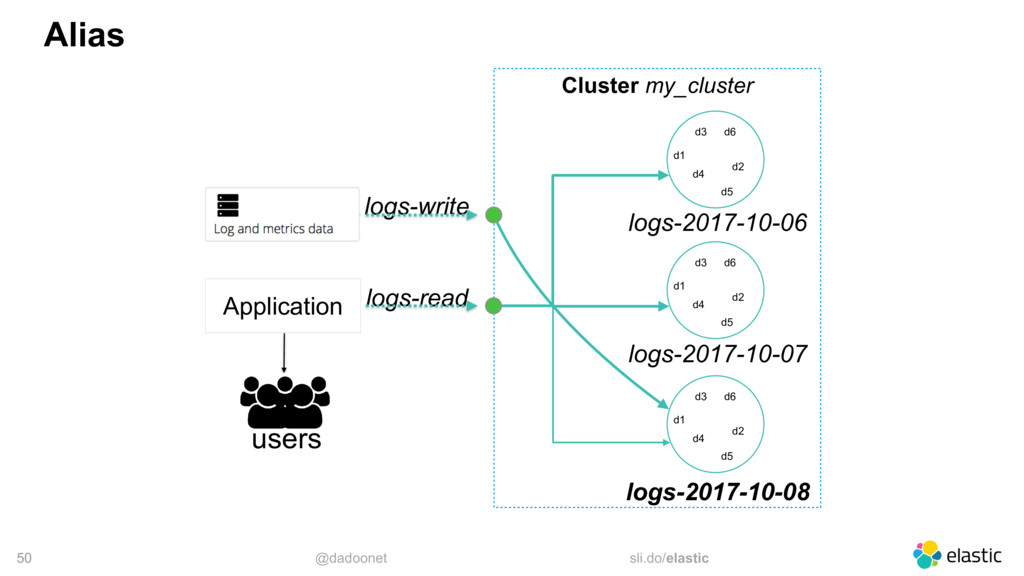
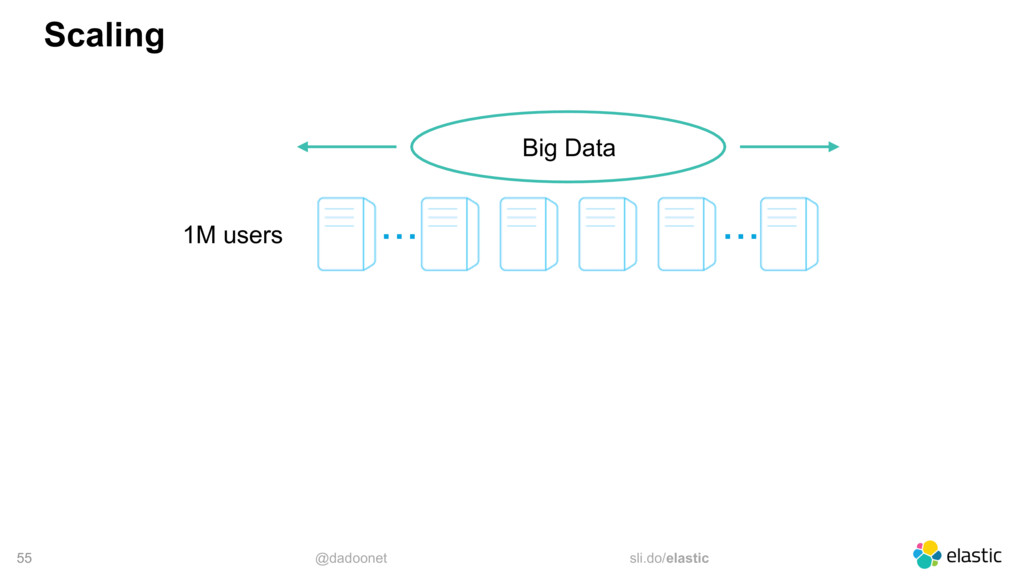
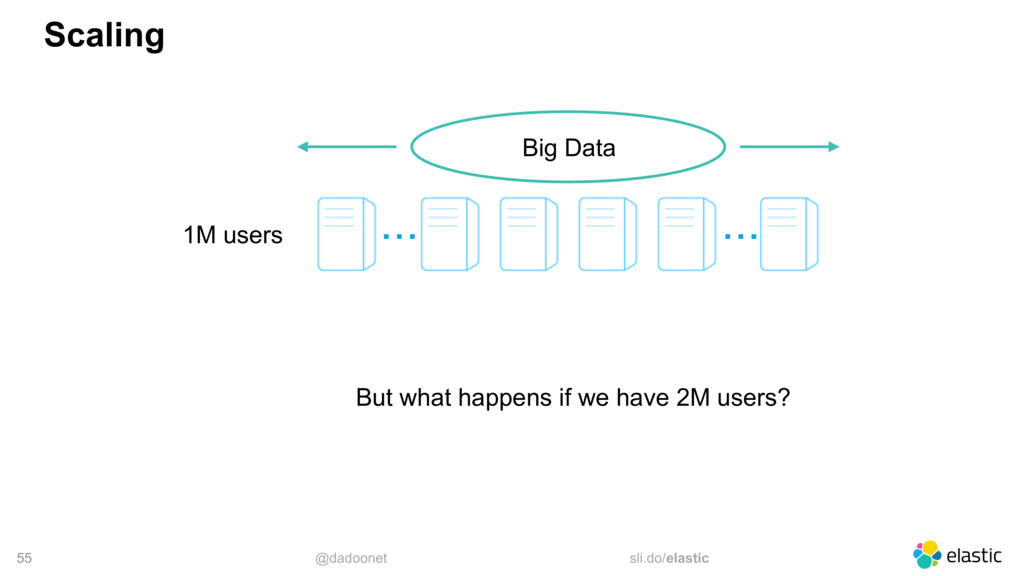
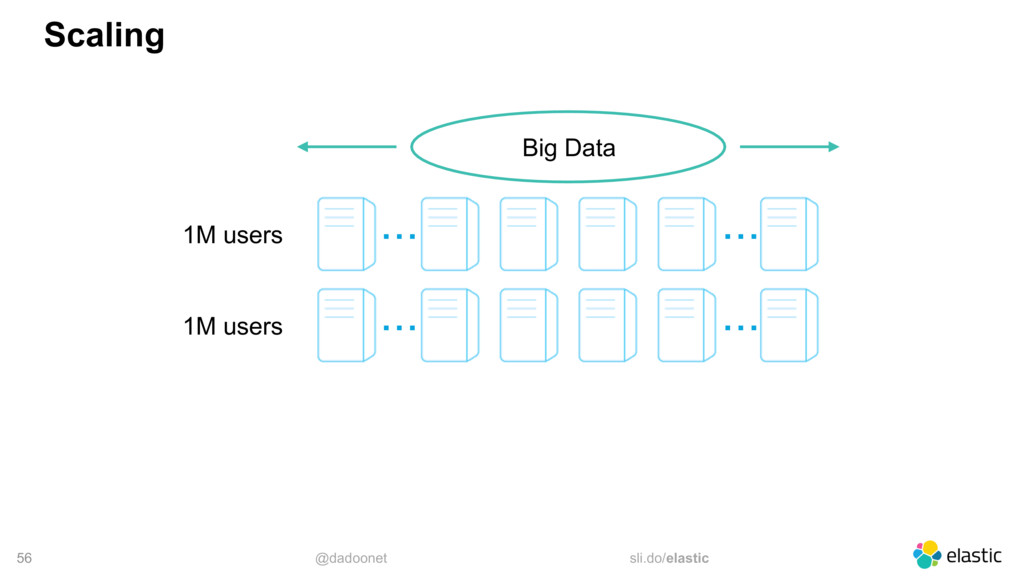
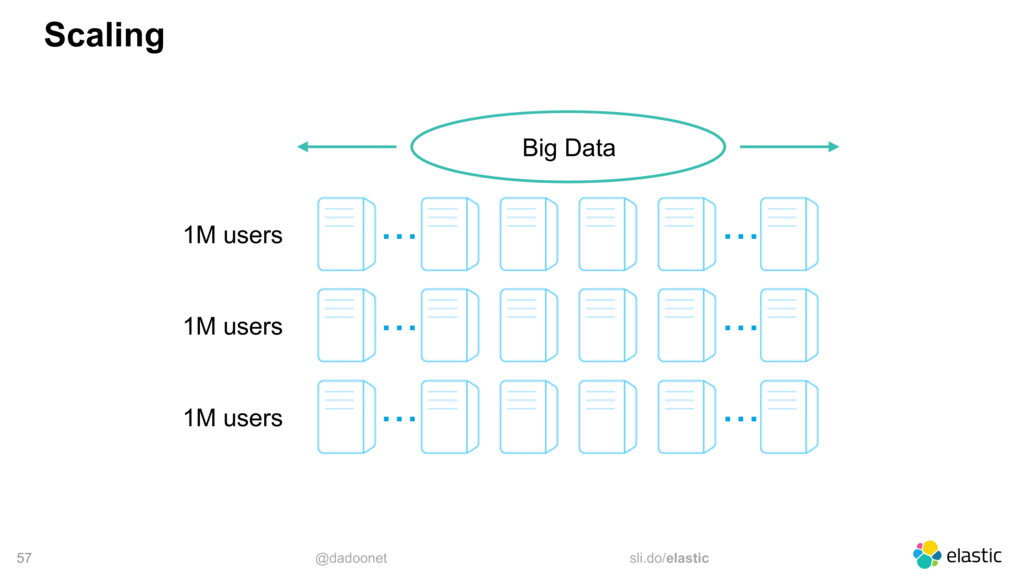
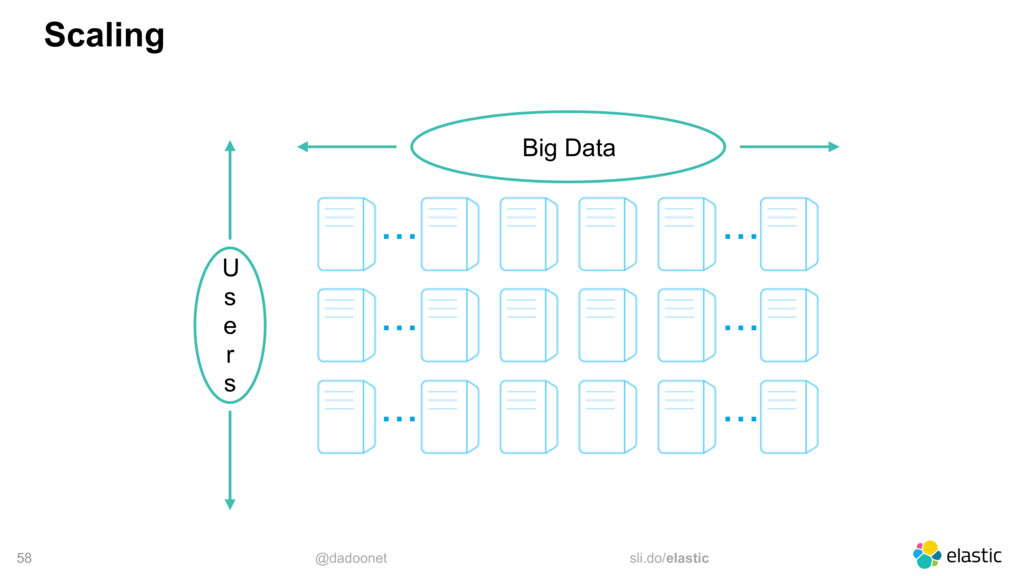
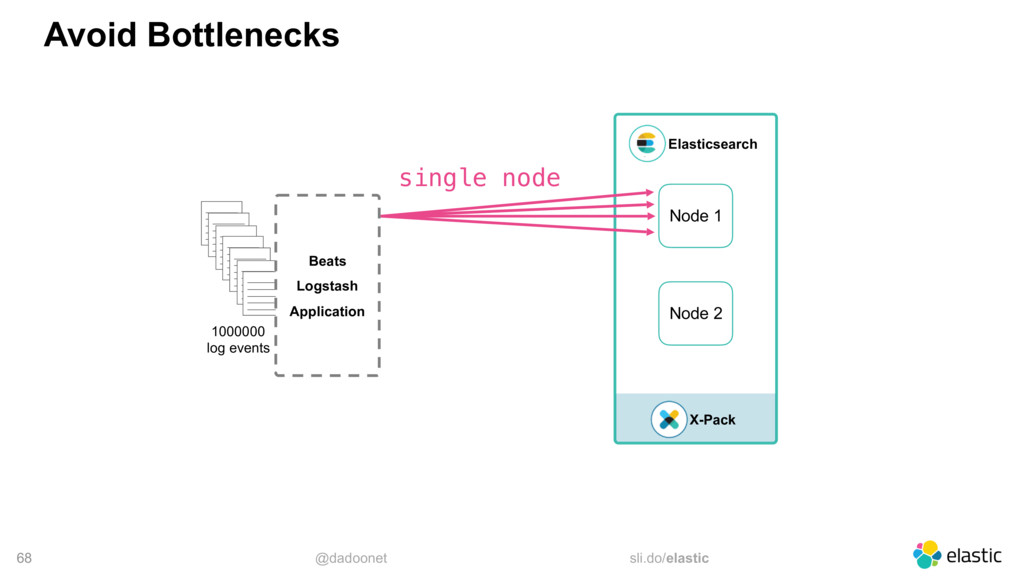
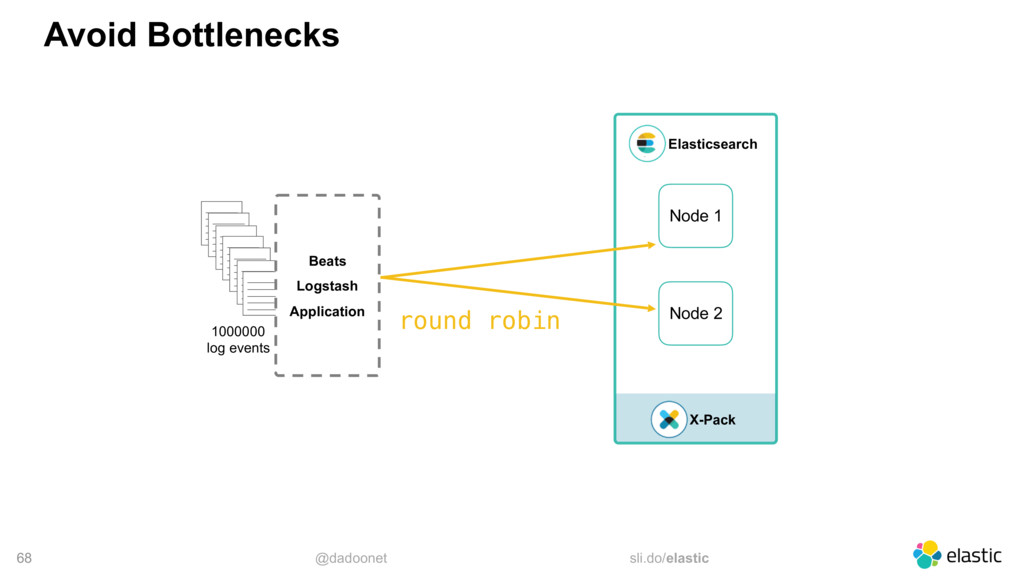
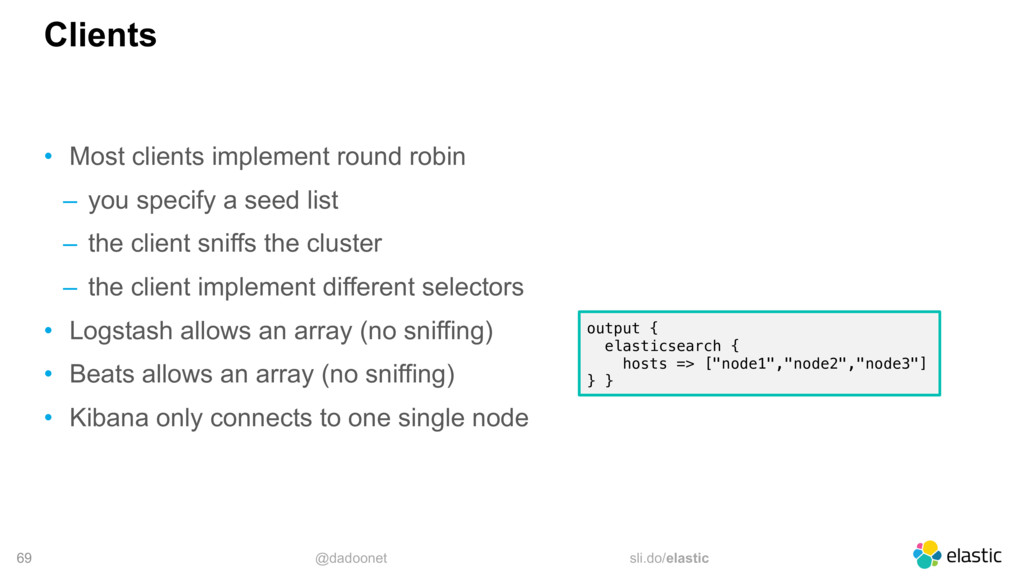
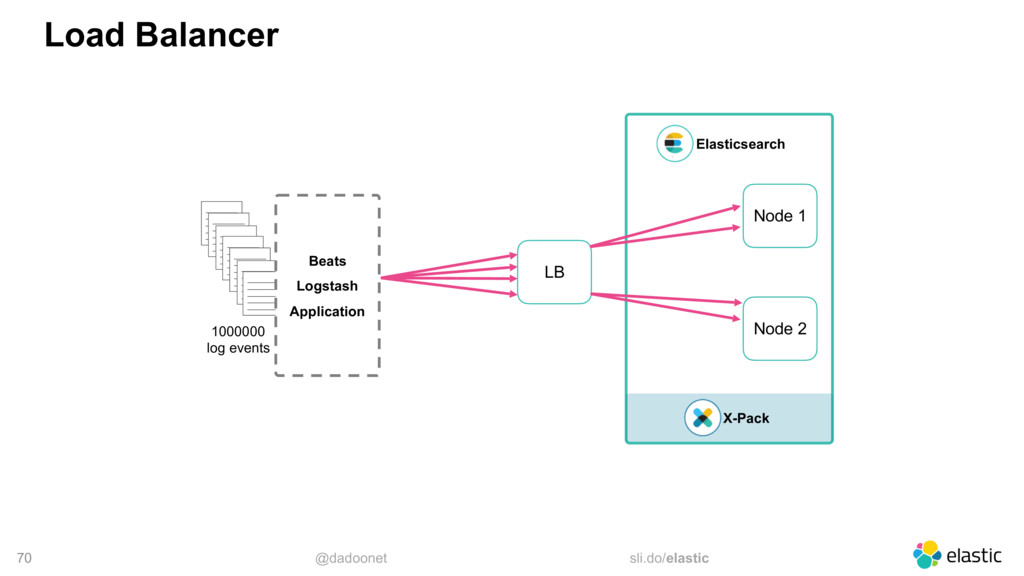
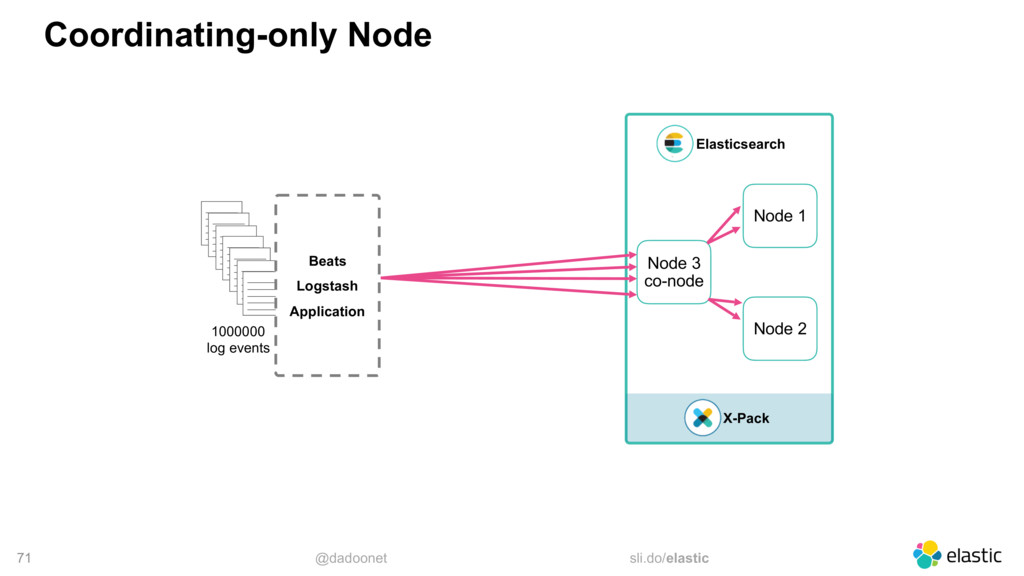
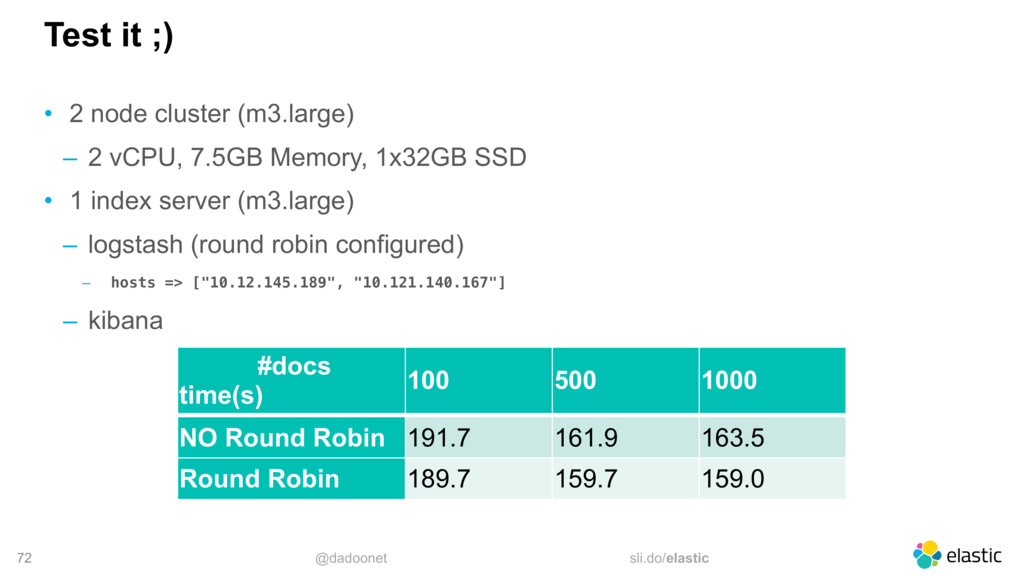
distributing the load
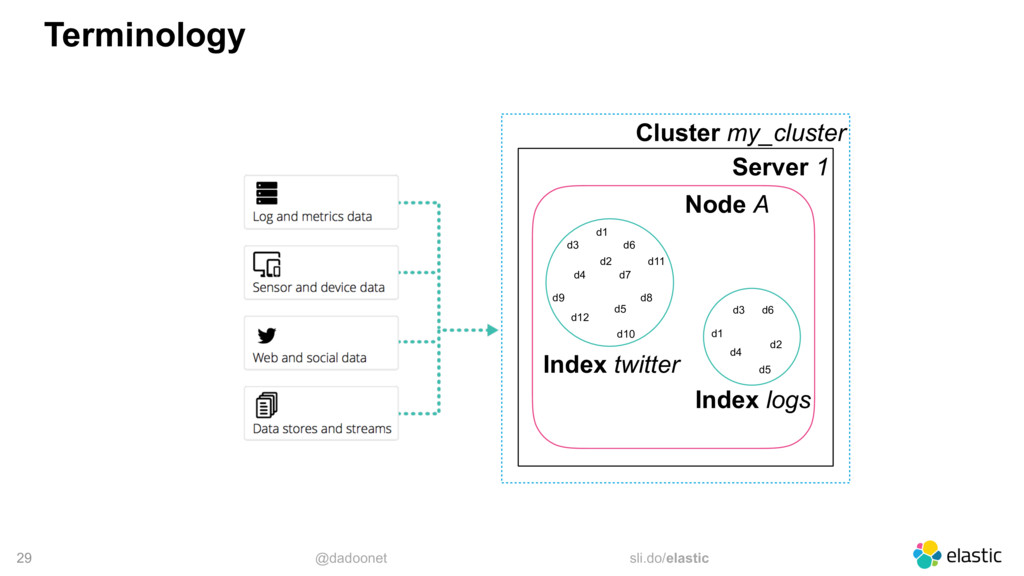
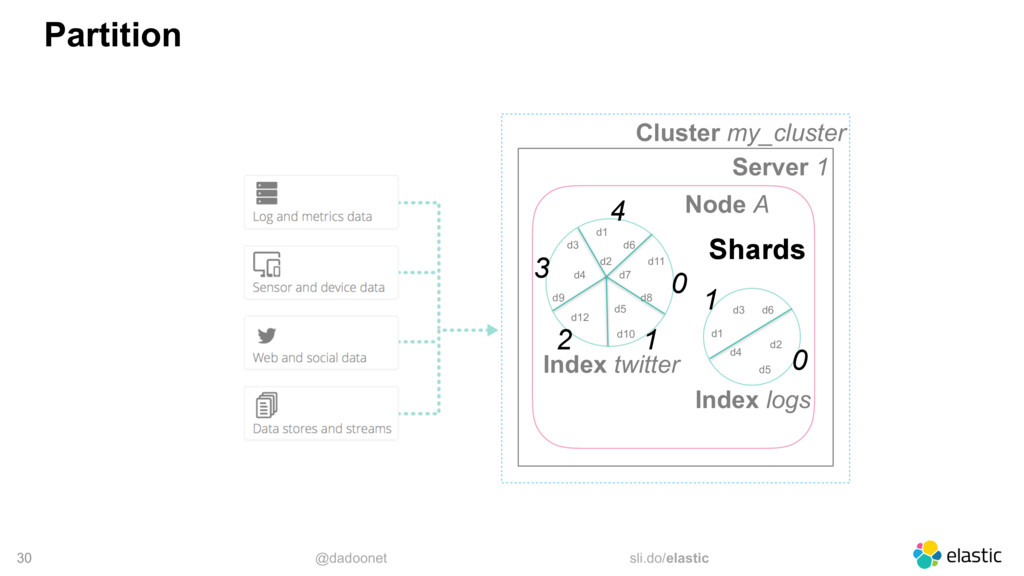
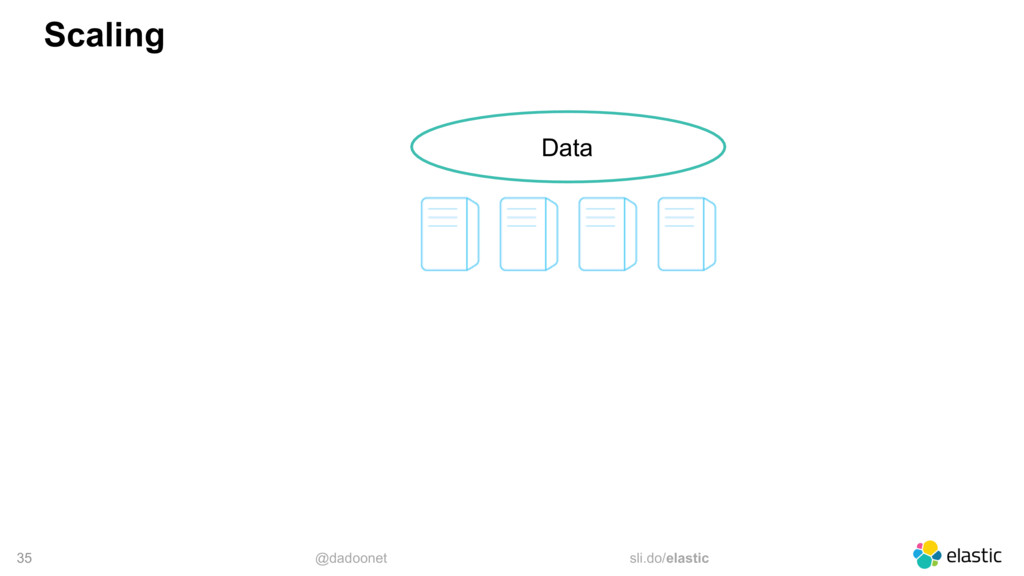
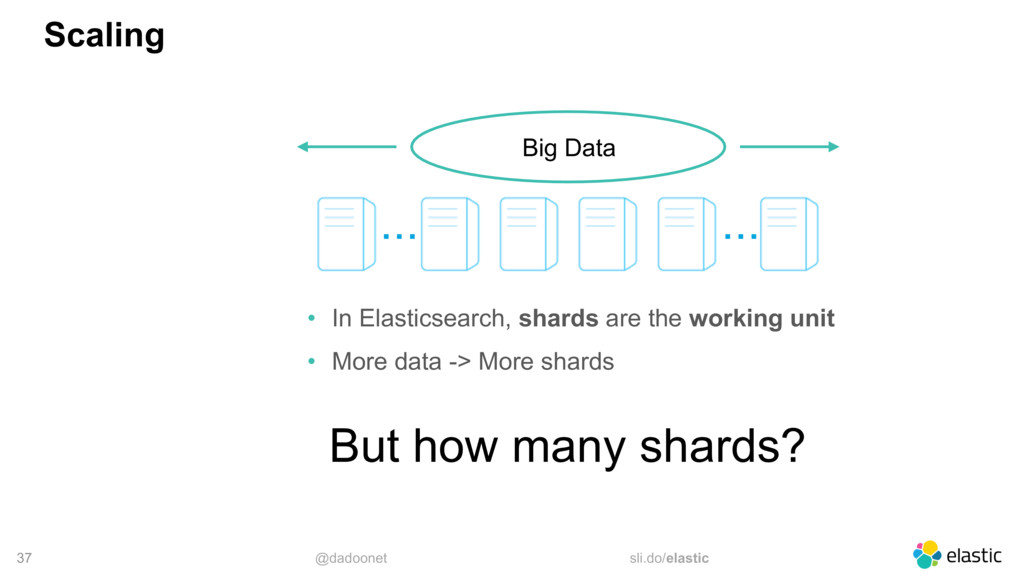
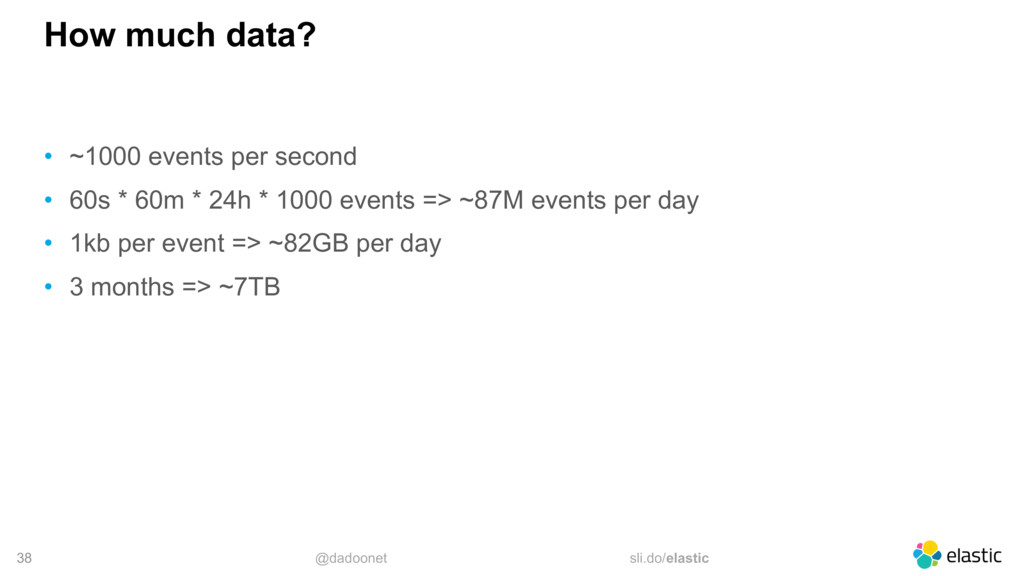
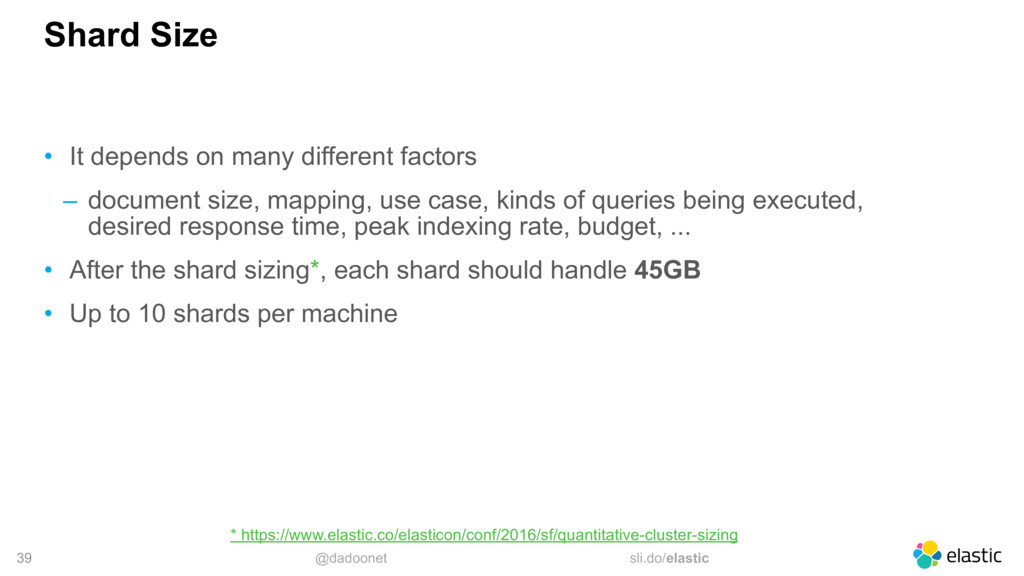
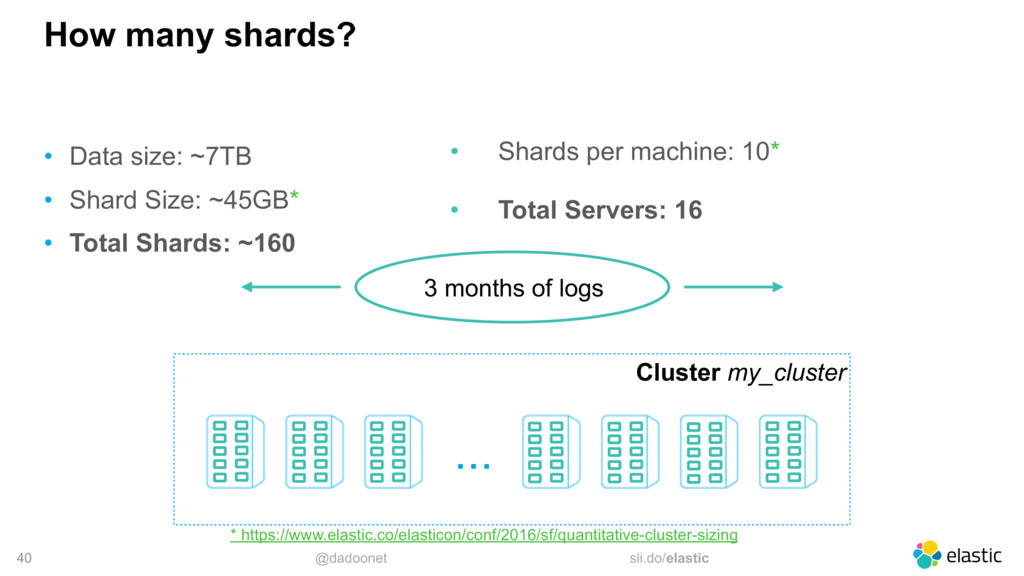
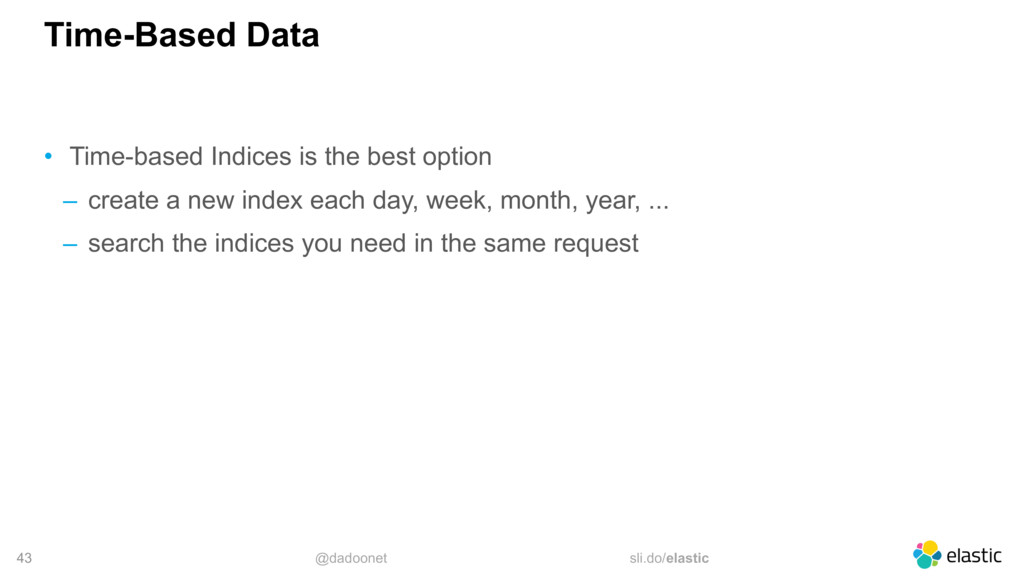
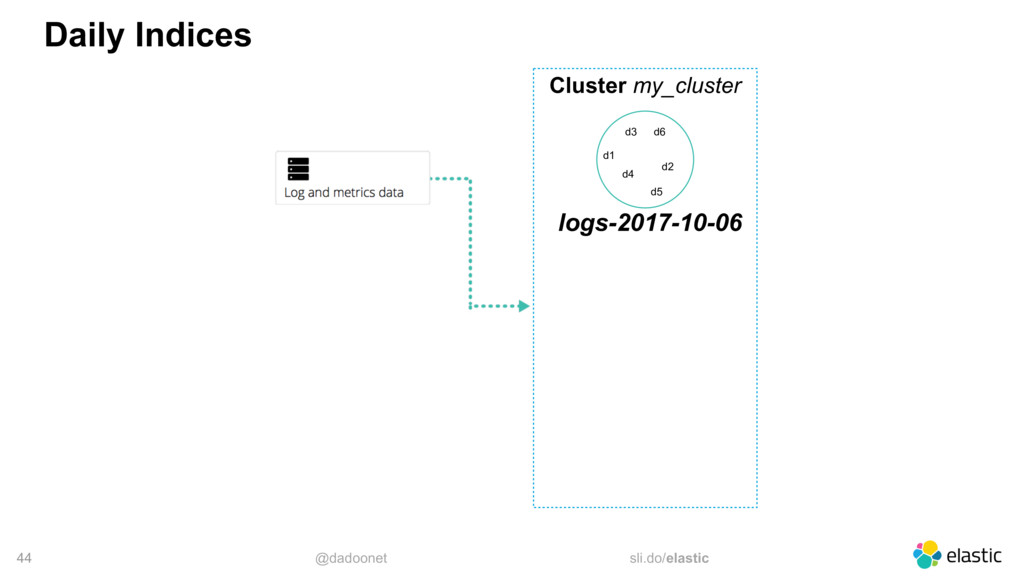
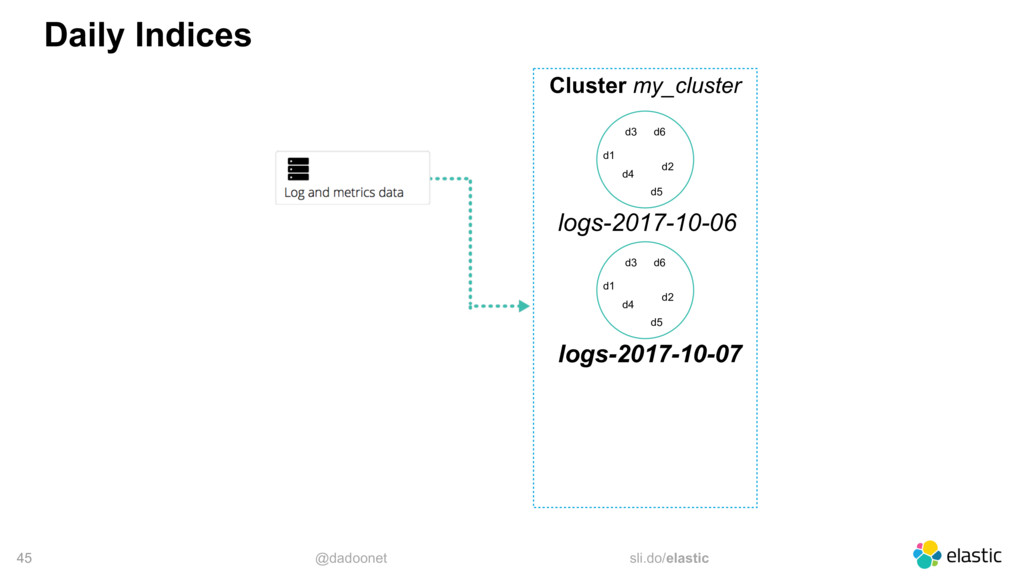
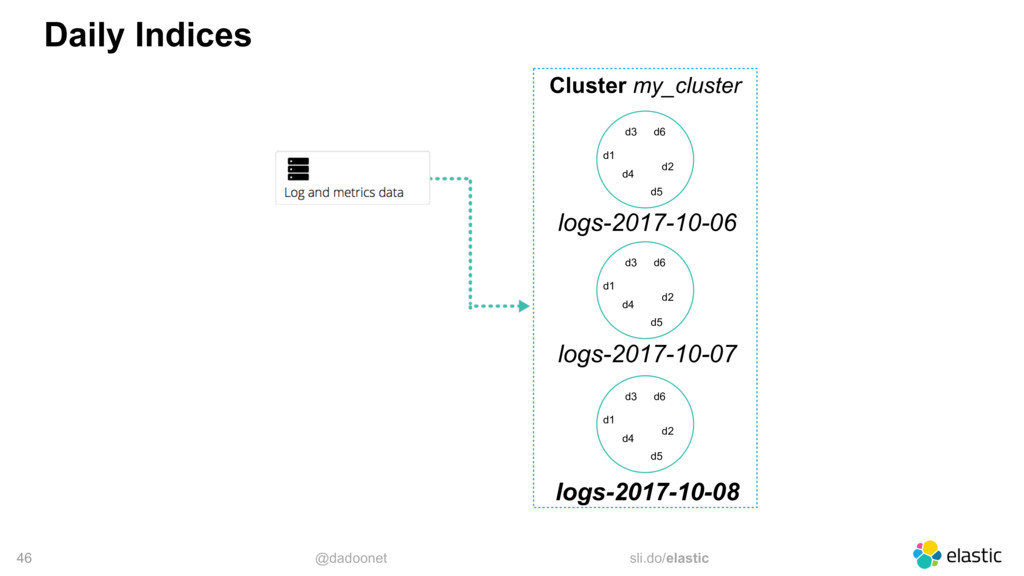
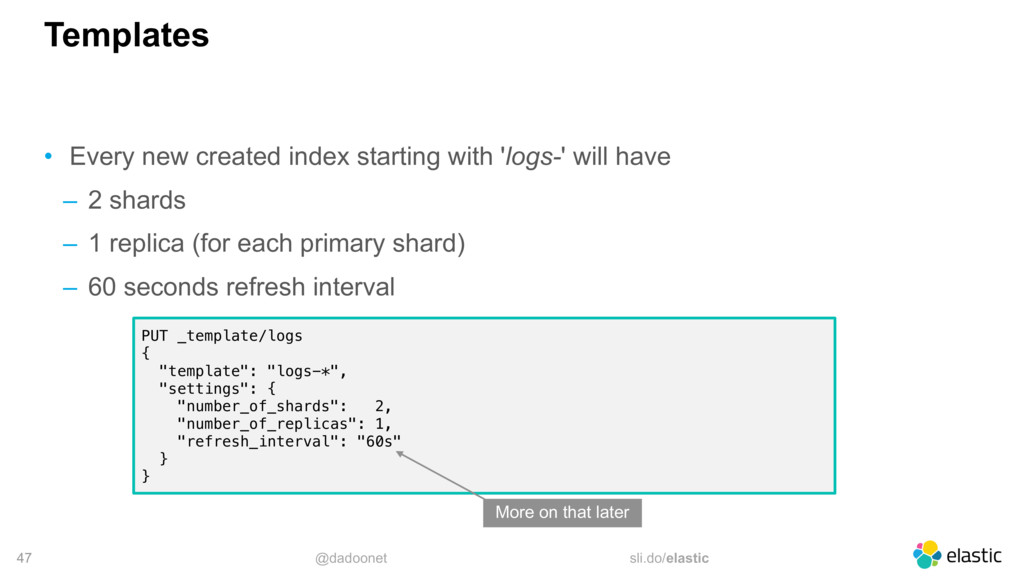
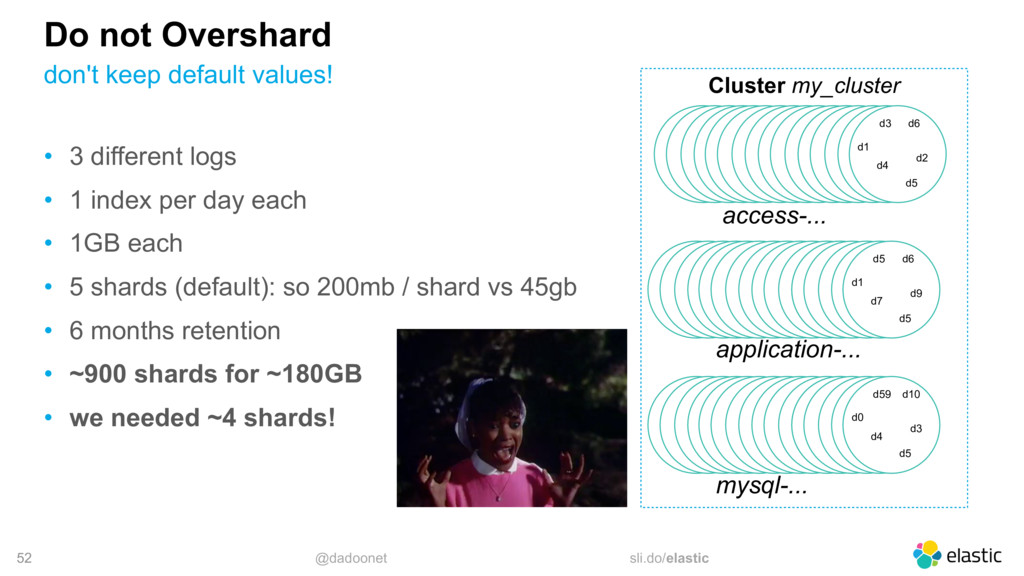
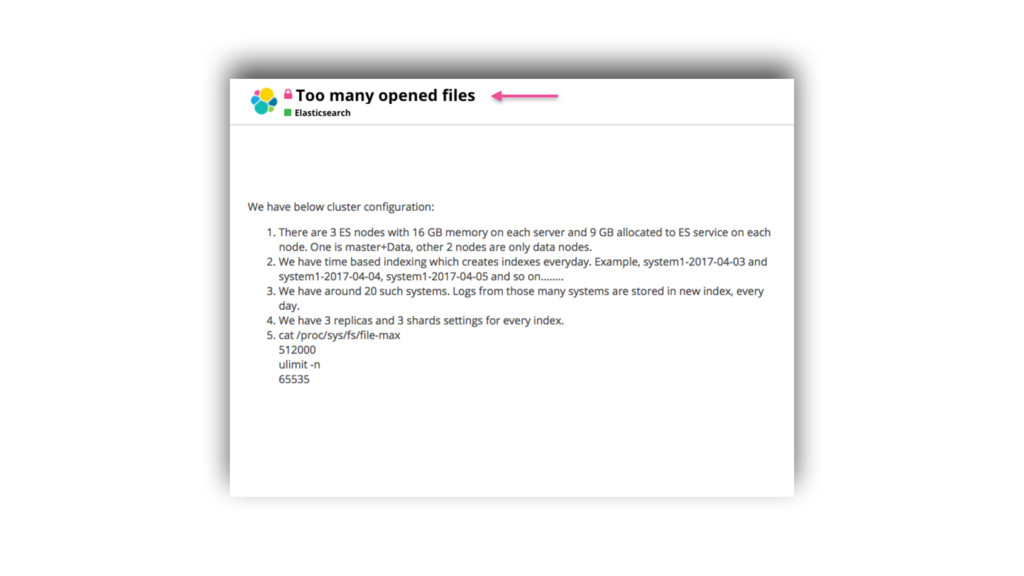
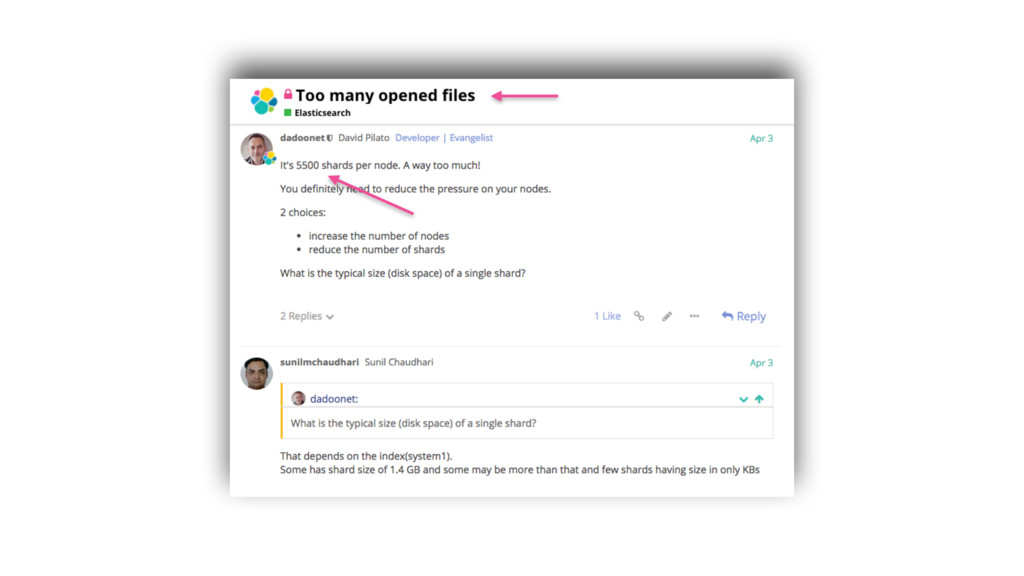
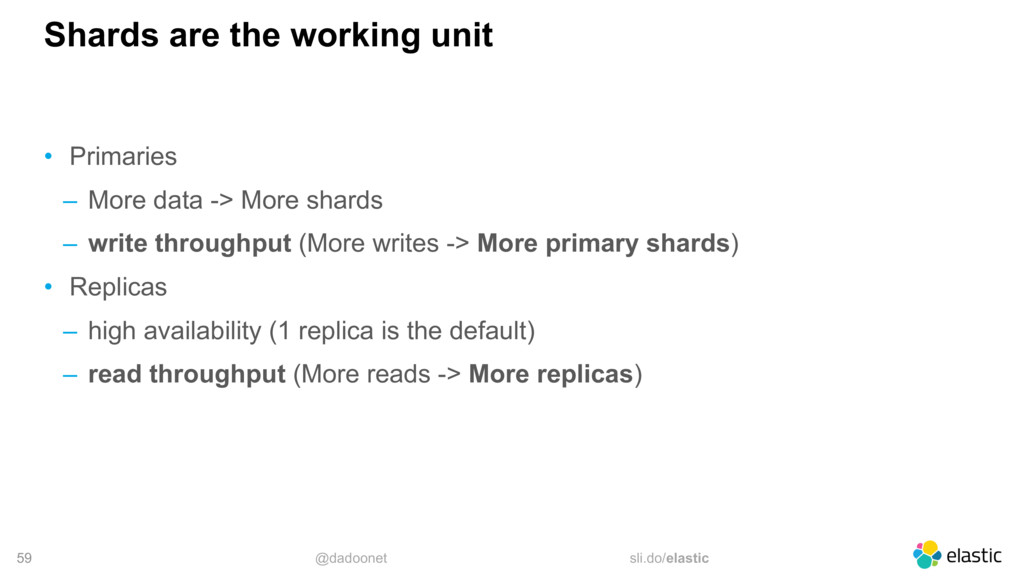
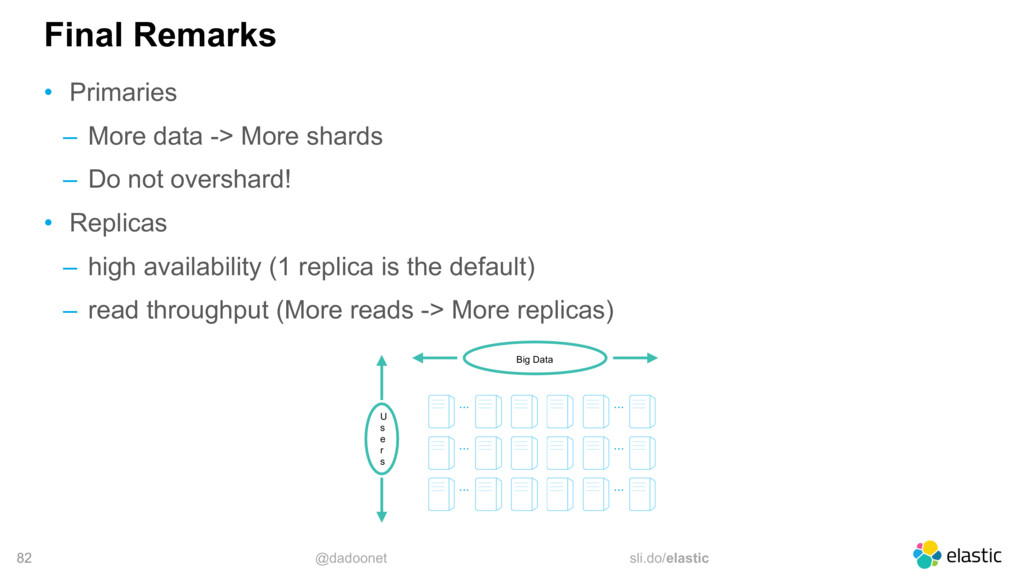
index and shard size
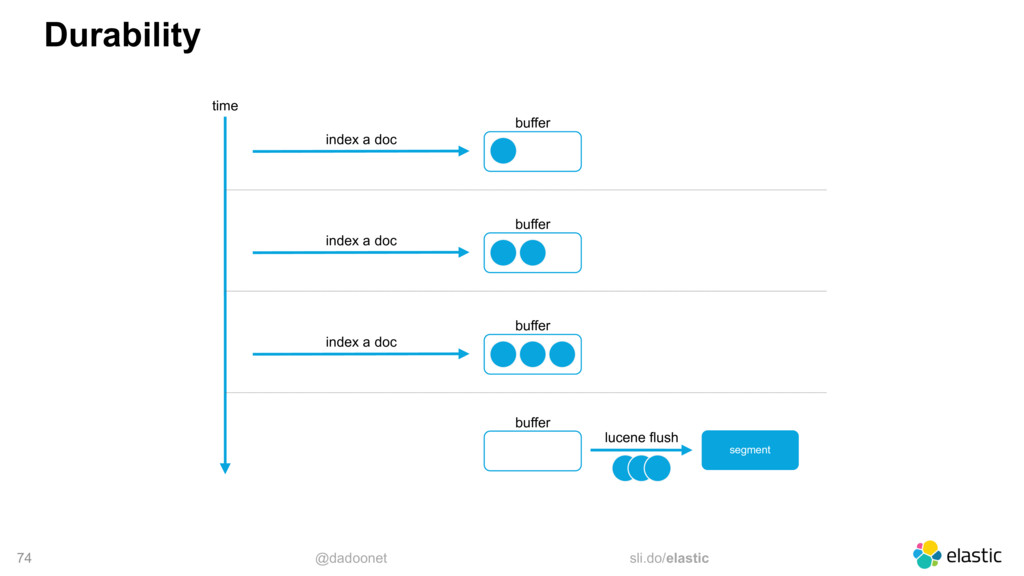
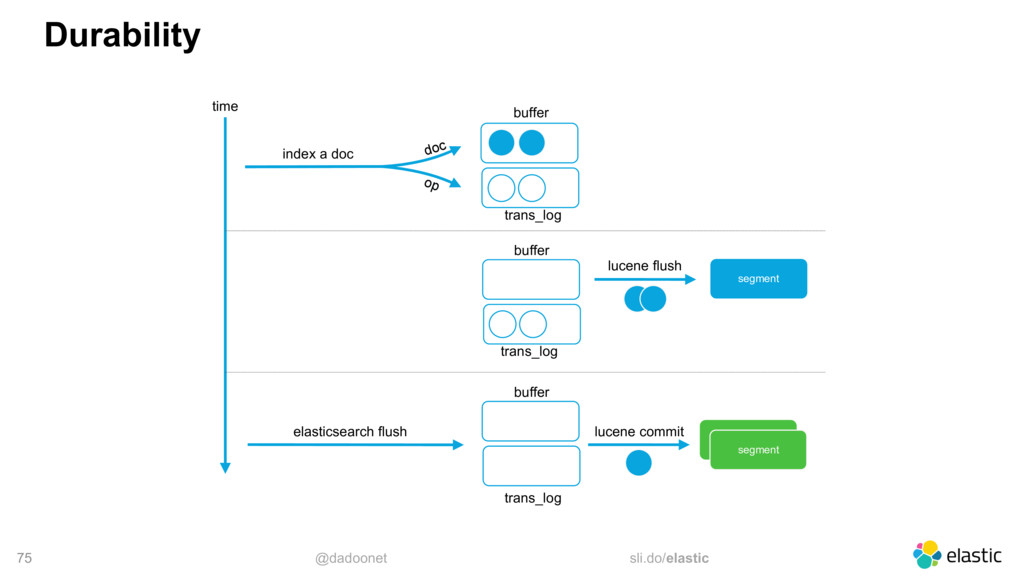
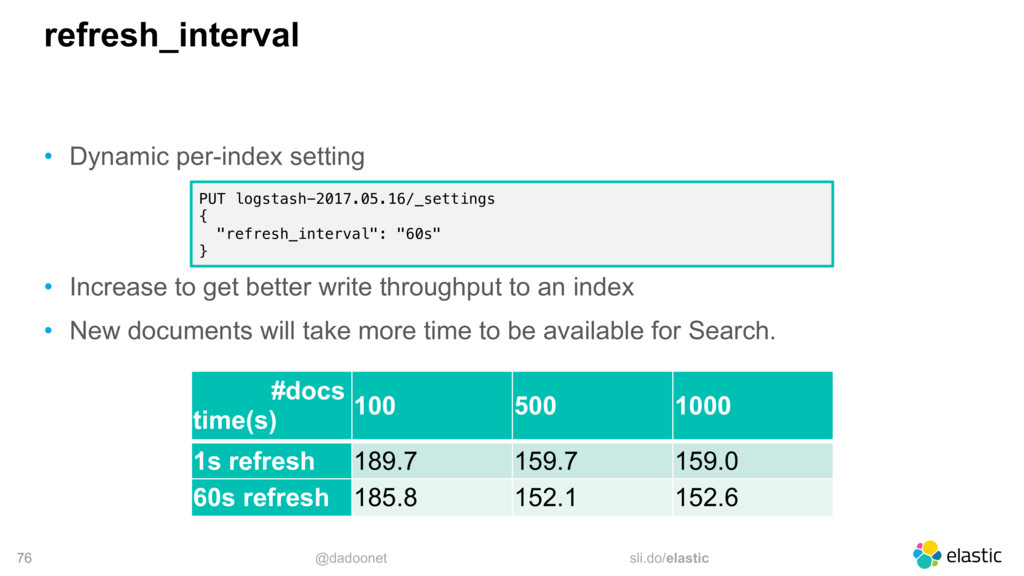
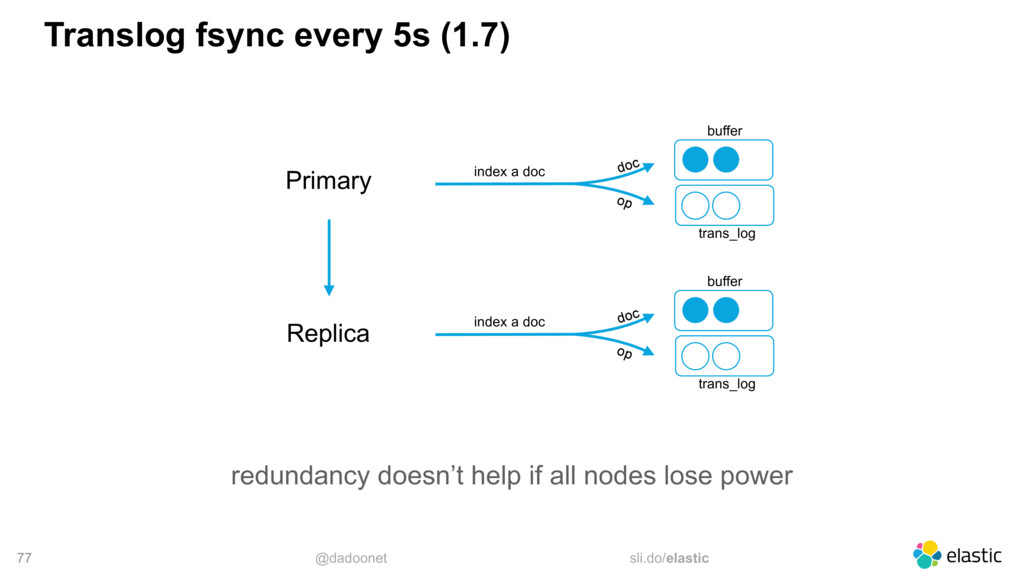
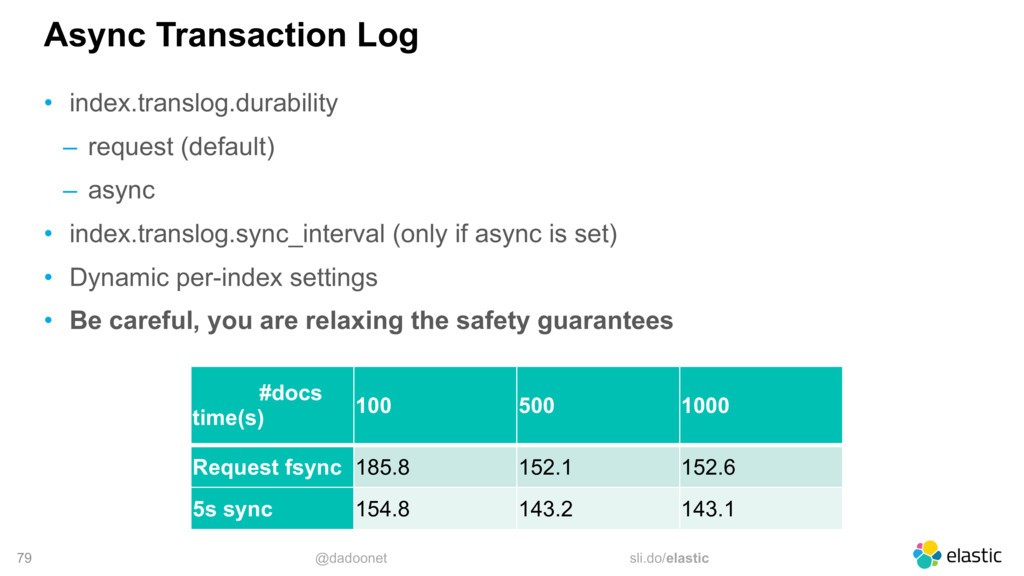
optimizing disk IO
Takeaway: best practices when building a monitoring system with the Elastic Stack, advanced tuning to optimize and increase event ingestion performance.

Elastic Co

November 10, 2017
Tweet

More Decks by Elastic Co

Other Decks in Technology

Transcript

  1. @dadoonet sli.do/elastic 5 Agenda Data Platform Architectures Elasticsearch Cluster Sizing

    Optimal Bulk Size Distribute the Load 1 2 3 4 5 Optimizing Disk IO 6 Final Remarks
  2. APM

  3. APM

  4. @dadoonet sli.do/elastic 18 Provision and manage multiple Elastic Stack environments

    and provide search-aaS, logging-aaS, BI-aaS, data-aaS to your entire organization
  5. @dadoonet sli.do/elastic 19 Hosted Elasticsearch & Kibana Includes X-Pack features

    Starts at $45/mo Available in Amazon Web Service Google Cloud Platform
  6. @dadoonet sli.do/elastic 21 The Elastic Journey of Data Beats Log

    Files Metrics Wire Data your{beat} Elasticsearch Master Nodes (3) Ingest Nodes (X) Data Nodes Hot (X) Data Notes Warm (X)
  7. @dadoonet sli.do/elastic 22 The Elastic Journey of Data Beats Log

    Files Metrics Wire Data your{beat} Elasticsearch Master Nodes (3) Ingest Nodes (X) Data Nodes Hot (X) Data Notes Warm (X) Kibana Instances (X)
  8. @dadoonet sli.do/elastic 23 The Elastic Journey of Data Beats Log

    Files Metrics Wire Data your{beat} Elasticsearch Master Nodes (3) Ingest Nodes (X) Data Nodes Hot (X) Data Notes Warm (X) Logstash Nodes (X) Kibana Instances (X)
  9. @dadoonet sli.do/elastic 24 The Elastic Journey of Data Beats Log

    Files Metrics Wire Data your{beat} Data Store Web APIs Social Sensors Elasticsearch Master Nodes (3) Ingest Nodes (X) Data Nodes Hot (X) Data Notes Warm (X) Logstash Nodes (X) Kibana Instances (X)
  10. @dadoonet sli.do/elastic 25 The Elastic Journey of Data Beats Log

    Files Metrics Wire Data your{beat} Data Store Web APIs Social Sensors Elasticsearch Master Nodes (3) Ingest Nodes (X) Data Nodes Hot (X) Data Notes Warm (X) Logstash Nodes (X) Kibana Instances (X) Notification Queues Storage Metrics
  11. @dadoonet sli.do/elastic 26 The Elastic Journey of Data Beats Log

    Files Metrics Wire Data your{beat} Data Store Web APIs Social Sensors Elasticsearch Master Nodes (3) Ingest Nodes (X) Data Nodes Hot (X) Data Notes Warm (X) Logstash Nodes (X) Kafka Redis Messaging Queue Kibana Instances (X) Notification Queues Storage Metrics
  12. @dadoonet sli.do/elastic 27 The Elastic Journey of Data Beats Log

    Files Metrics Wire Data your{beat} Data Store Web APIs Social Sensors Elasticsearch Master Nodes (3) Ingest Nodes (X) Data Nodes Hot (X) Data Notes Warm (X) Logstash Nodes (X) Kafka Redis Messaging Queue Kibana Instances (X) Notification Queues Storage Metrics X-Pack X-Pack X-Pack
  13. @dadoonet sli.do/elastic 29 Terminology Cluster my_cluster Server 1 Node A

    d1 d2 d3 d4 d5 d6 d7 d8 d9 d10 d11 d12 Index twitter d6 d3 d2 d5 d1 d4 Index logs
  14. @dadoonet sli.do/elastic 30 Partition Cluster my_cluster Server 1 Node A

    d1 d2 d3 d4 d5 d6 d7 d8 d9 d10 d11 d12 Index twitter d6 d3 d2 d5 d1 d4 Index logs Shards 0 1 4 2 3 0 1
  15. @dadoonet sli.do/elastic 31 Distribution Cluster my_cluster Server 1 Node A

    Server 2 Node B twitter shard P4 d1 d2 d6 d5 d10 d12 twitter shard P2 twitter shard P1 logs shard P0 d2 d5 d4 logs shard P1 d3 d4 d9 d7 d8 d11 twitter shard P3 twitter shard P0 d6 d3 d1
  16. @dadoonet sli.do/elastic 32 Replication Cluster my_cluster Server 1 Node A

    Server 2 Node B twitter shard P4 d1 d2 d6 d5 d10 d12 twitter shard P2 twitter shard P1 logs shard P0 d2 d5 d4 logs shard P1 d3 d4 d9 d7 d8 d11 twitter shard P3 twitter shard P0 twitter shard R4 d1 d2 d6 d12 twitter shard R2 d5 d10 twitter shard R1 d6 d3 d1 d6 d3 d1 logs shard R0 d2 d5 d4 logs shard R1 d3 d4 d9 d7 d8 d11 twitter shard R3 twitter shard R0 • Primaries • Replicas
  17. @dadoonet sli.do/elastic 37 Scaling • In Elasticsearch, shards are the

    working unit • More data -> More shards Big Data ... ... But how many shards?
  18. @dadoonet sli.do/elastic 38 How much data? • ~1000 events per

    second • 60s * 60m * 24h * 1000 events => ~87M events per day • 1kb per event => ~82GB per day • 3 months => ~7TB
  19. @dadoonet sli.do/elastic 39 Shard Size • It depends on many

    different factors ‒ document size, mapping, use case, kinds of queries being executed, desired response time, peak indexing rate, budget, ... • After the shard sizing*, each shard should handle 45GB • Up to 10 shards per machine * https://www.elastic.co/elasticon/conf/2016/sf/quantitative-cluster-sizing
  20. @dadoonet sli.do/elastic 40 How many shards? • Data size: ~7TB

    • Shard Size: ~45GB* • Total Shards: ~160 • Shards per machine: 10* • Total Servers: 16 * https://www.elastic.co/elasticon/conf/2016/sf/quantitative-cluster-sizing Cluster my_cluster 3 months of logs ...
  21. @dadoonet sli.do/elastic 41 But... • How many indices? • What

    do you do if the daily data grows? • What do you do if you want to delete old data?
  22. @dadoonet sli.do/elastic 42 Time-Based Data • Logs, social media streams,

    time-based events • Timestamp + Data • Do not change • Typically search for recent events • Older documents become less important • Hard to predict the data size
  23. @dadoonet sli.do/elastic 43 Time-Based Data • Time-based Indices is the

    best option ‒ create a new index each day, week, month, year, ... ‒ search the indices you need in the same request
  24. @dadoonet sli.do/elastic 45 Daily Indices Cluster my_cluster d6 d3 d2

    d5 d1 d4 logs-2017-10-07 d6 d3 d2 d5 d1 d4 logs-2017-10-06
  25. @dadoonet sli.do/elastic 46 Daily Indices Cluster my_cluster d6 d3 d2

    d5 d1 d4 logs-2017-10-06 d6 d3 d2 d5 d1 d4 logs-2017-10-08 d6 d3 d2 d5 d1 d4 logs-2017-10-07
  26. @dadoonet sli.do/elastic 47 Templates • Every new created index starting

    with 'logs-' will have ‒ 2 shards ‒ 1 replica (for each primary shard) ‒ 60 seconds refresh interval PUT _template/logs { "template": "logs-*", "settings": { "number_of_shards": 2, "number_of_replicas": 1, "refresh_interval": "60s" } } More on that later
  27. @dadoonet sli.do/elastic 48 Alias Cluster my_cluster d6 d3 d2 d5

    d1 d4 logs-2017-10-06 users Application logs-write logs-read
  28. @dadoonet sli.do/elastic 49 Alias Cluster my_cluster d6 d3 d2 d5

    d1 d4 logs-2017-10-06 users Application logs-write logs-read d6 d3 d2 d5 d1 d4 logs-2017-10-07
  29. @dadoonet sli.do/elastic 50 Alias Cluster my_cluster d6 d3 d2 d5

    d1 d4 logs-2017-10-06 users Application logs-write logs-read d6 d3 d2 d5 d1 d4 logs-2017-10-07 d6 d3 d2 d5 d1 d4 logs-2017-10-08
  30. @dadoonet sli.do/elastic 52 Do not Overshard • 3 different logs

    • 1 index per day each • 1GB each • 5 shards (default): so 200mb / shard vs 45gb • 6 months retention • ~900 shards for ~180GB • we needed ~4 shards! don't keep default values! Cluster my_cluster access-... d6 d3 d2 d5 d1 d4 application-... d6 d5 d9 d5 d1 d7 mysql-... d10 d59 d3 d5 d0 d4
  31. @dadoonet sli.do/elastic 59 Shards are the working unit • Primaries

    ‒ More data -> More shards ‒ write throughput (More writes -> More primary shards) • Replicas ‒ high availability (1 replica is the default) ‒ read throughput (More reads -> More replicas)
  32. @dadoonet sli.do/elastic 61 What is Bulk? Elasticsearch Master Nodes (3)

    Ingest Nodes (X) Data Nodes Hot (X) Data Notes Warm (X) X-Pack __________ __________ __________ __________ __________ __________ __________ __________ __________ __________ __________ __________ __________ __________ __________ __________ __________ __________ __________ __________ __________ __________ __________ __________ __________ __________ __________ __________ __________ __________ __________ __________ __________ __________ __________ __________ __________ __________ __________ __________ _____ 1000
 log events Beats Logstash Application 1000 index requests with 1 document 1 bulk request with 1000 documents
  33. @dadoonet sli.do/elastic 62 What is the optimal bulk size? Elasticsearch

    Master Nodes (3) Ingest Nodes (X) Data Nodes Hot (X) Data Notes Warm (X) X-Pack __________ __________ __________ __________ __________ __________ __________ __________ __________ __________ __________ __________ __________ __________ __________ __________ __________ __________ __________ __________ __________ __________ __________ __________ __________ __________ __________ __________ __________ __________ __________ __________ __________ __________ __________ __________ __________ __________ __________ __________ _____ 1000
 log events Beats Logstash Application 4 * 250? 1 * 1000? 2 * 500?
  34. @dadoonet sli.do/elastic 63 It depends... • on your application (language,

    libraries, ...) • document size (100b, 1kb, 100kb, 1mb, ...) • number of nodes • node size • number of shards • shards distribution
  35. @dadoonet sli.do/elastic 64 Test it ;) Elasticsearch Master Nodes (3)

    Ingest Nodes (X) Data Nodes Hot (X) Data Notes Warm (X) X-Pack __________ __________ __________ __________ __________ __________ __________ __________ __________ __________ __________ __________ __________ __________ __________ __________ __________ __________ __________ __________ __________ __________ __________ __________ __________ __________ __________ __________ __________ __________ __________ __________ __________ __________ __________ __________ __________ __________ __________ __________ _____ 1000000
 log events Beats Logstash Application 4000 * 250-> 160s 1000 * 1000-> 155s 2000 * 500-> 164s
  36. @dadoonet sli.do/elastic 65 Test it ;) DATE=`date +%Y.%m.%d` LOG=logs/logs.txt exec_test

    () { curl -s -XDELETE "http://USER:PASS@HOST:9200/logstash-$DATE" sleep 10 export SIZE=$1 time cat $LOG | ./bin/logstash -f logstash.conf } for SIZE in 100 500 1000 3000 5000 10000; do for i in {1..20}; do exec_test $SIZE done; done; input { stdin{} } filter {} output { elasticsearch { hosts => ["10.12.145.189"] flush_size => "${SIZE}" } } In Beats set "bulk_max_size" in the output.elasticsearch
  37. @dadoonet sli.do/elastic 66 Test it ;) • 2 node cluster

    (m3.large) ‒ 2 vCPU, 7.5GB Memory, 1x32GB SSD • 1 index server (m3.large) ‒ logstash ‒ kibana # docs 100 500 1000 3000 5000 10000 time(s) 191.7 161.9 163.5 160.7 160.7 161.5
  38. @dadoonet sli.do/elastic 68 Avoid Bottlenecks Elasticsearch X-Pack _________ _________ _________

    _________ _________ _________ _________ _________ _________ _________ _________ _________ _________ _________ _________ _________ _________ _________ _________ _________ _________ _________ _________ _________ _________ _________ _________ _________ _________ _________ _________ _________ _________ _________ _________ 1000000
 log events Beats Logstash Application single node Node 1 Node 2
  39. @dadoonet sli.do/elastic 68 Avoid Bottlenecks Elasticsearch X-Pack _________ _________ _________

    _________ _________ _________ _________ _________ _________ _________ _________ _________ _________ _________ _________ _________ _________ _________ _________ _________ _________ _________ _________ _________ _________ _________ _________ _________ _________ _________ _________ _________ _________ _________ _________ 1000000
 log events Beats Logstash Application Node 1 Node 2 round robin
  40. @dadoonet sli.do/elastic 69 Clients • Most clients implement round robin

    ‒ you specify a seed list ‒ the client sniffs the cluster ‒ the client implement different selectors • Logstash allows an array (no sniffing) • Beats allows an array (no sniffing) • Kibana only connects to one single node output { elasticsearch { hosts => ["node1","node2","node3"] } }
  41. @dadoonet sli.do/elastic 70 Load Balancer Elasticsearch X-Pack _________ _________ _________

    _________ _________ _________ _________ _________ _________ _________ _________ _________ _________ _________ _________ _________ _________ _________ _________ _________ _________ _________ _________ _________ _________ _________ _________ _________ _________ _________ _________ _________ _________ _________ _________ 1000000
 log events Beats Logstash Application LB Node 2 Node 1
  42. @dadoonet sli.do/elastic 71 Coordinating-only Node Elasticsearch X-Pack _________ _________ _________

    _________ _________ _________ _________ _________ _________ _________ _________ _________ _________ _________ _________ _________ _________ _________ _________ _________ _________ _________ _________ _________ _________ _________ _________ _________ _________ _________ _________ _________ _________ _________ _________ 1000000
 log events Beats Logstash Application Node 3
 co-node Node 2 Node 1
  43. @dadoonet sli.do/elastic 72 Test it ;) #docs time(s) 100 500

    1000 NO Round Robin 191.7 161.9 163.5 Round Robin 189.7 159.7 159.0 • 2 node cluster (m3.large) ‒ 2 vCPU, 7.5GB Memory, 1x32GB SSD • 1 index server (m3.large) ‒ logstash (round robin configured) ‒ hosts => ["10.12.145.189", "10.121.140.167"] ‒ kibana
  44. @dadoonet sli.do/elastic 74 Durability index a doc time lucene flush

    buffer index a doc buffer index a doc buffer buffer segment
  45. @dadoonet sli.do/elastic 75 Durability index a doc time lucene flush

    buffer segment trans_log buffer trans_log buffer trans_log elasticsearch flush doc op lucene commit segment segment
  46. @dadoonet sli.do/elastic 76 refresh_interval • Dynamic per-index setting • Increase

    to get better write throughput to an index • New documents will take more time to be available for Search. PUT logstash-2017.05.16/_settings { "refresh_interval": "60s" } #docs time(s) 100 500 1000 1s refresh 189.7 159.7 159.0 60s refresh 185.8 152.1 152.6
  47. @dadoonet sli.do/elastic 77 Translog fsync every 5s (1.7) index a

    doc buffer trans_log doc op index a doc buffer trans_log doc op Primary Replica redundancy doesn’t help if all nodes lose power
  48. @dadoonet sli.do/elastic 78 Translog fsync on every request • For

    low volume indexing, fsync matters less • For high volume indexing, we can amortize the costs and fsync on every bulk • Concurrent requests can share an fsync bulk 1 bulk 2 single fsync
  49. @dadoonet sli.do/elastic 79 Async Transaction Log • index.translog.durability ‒ request

    (default) ‒ async • index.translog.sync_interval (only if async is set) • Dynamic per-index settings • Be careful, you are relaxing the safety guarantees #docs time(s) 100 500 1000 Request fsync 185.8 152.1 152.6 5s sync 154.8 143.2 143.1
  50. @dadoonet sli.do/elastic 81 Final Remarks Beats Log Files Metrics Wire

    Data your{beat} Data Store Web APIs Social Sensors Elasticsearch Master Nodes (3) Ingest Nodes (X) Data Nodes Hot (X) Data Notes Warm (X) Logstash Nodes (X) Kafka Redis Messaging Queue Kibana Instances (X) Notification Queues Storage Metrics X-Pack X-Pack X-Pack
  51. @dadoonet sli.do/elastic 82 Final Remarks • Primaries ‒ More data

    -> More shards ‒ Do not overshard! • Replicas ‒ high availability (1 replica is the default) ‒ read throughput (More reads -> More replicas) Big Data ... ... ... ... ... ... U s e r s
  52. @dadoonet sli.do/elastic 83 Final Remarks • Bulk and Test •

    Distribute the Load • Refresh Interval • Async Trans Log (careful) #docs 100 500 1000 Default 191.7s 161.9s 163.5s RR+60s+Async5s 154.8s 143.2s 143.1s
  53. Elastic{ON} 2018 The Official Elasticsearch User Conference February 28 -

    March 1, San Francisco Call for Presentations Open through October 31 Cause Awards Applications Open through December 15
  54. Elastic{ON} 2018 Opportunity Grant Providing discounted conference tickets and travel

    + accommodation assistance for select individuals elastic.co/elasticon/grant Applications open through December 1
  55. Upcoming Trainings training.elastic.co • Dec 4-5: Elasticsearch Operations I -

    Paris, France **20% off with code 5587-4EFF-8B38** (not for virtual courses) • Dec 4-7: Elasticsearch Developer I (Virtual Classroom) • Dec 11-14: Elasticsearch Developer II (Virtual Classroom) • Dec 18-21: Elasticsearch Operations I (Virtual Classroom)