Upgrade to Pro — share decks privately, control downloads, hide ads and more …

Opening Keynote: From ELK to Elastic Stack

Elastic Co
October 19, 2016

Opening Keynote: From ELK to Elastic Stack

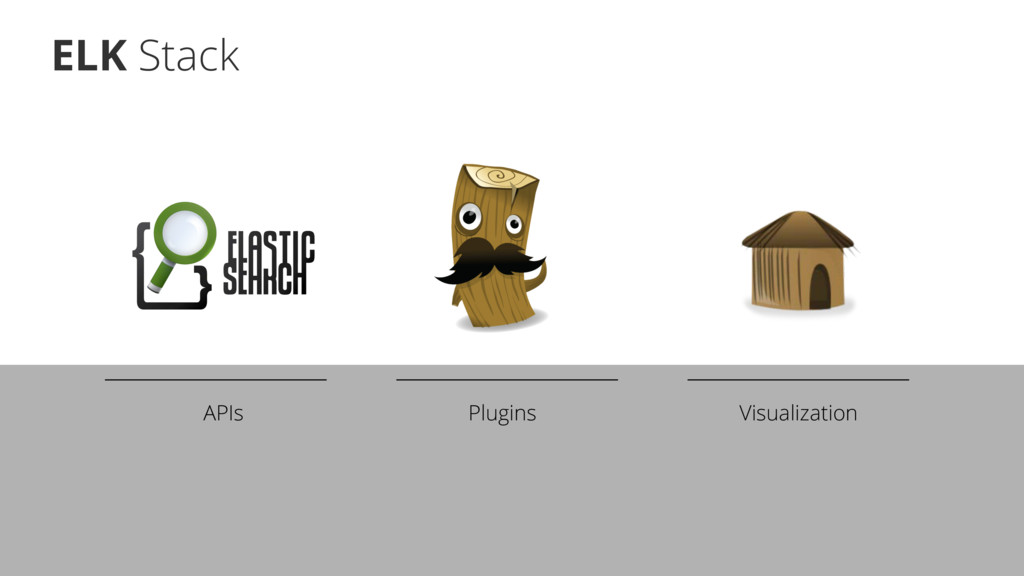
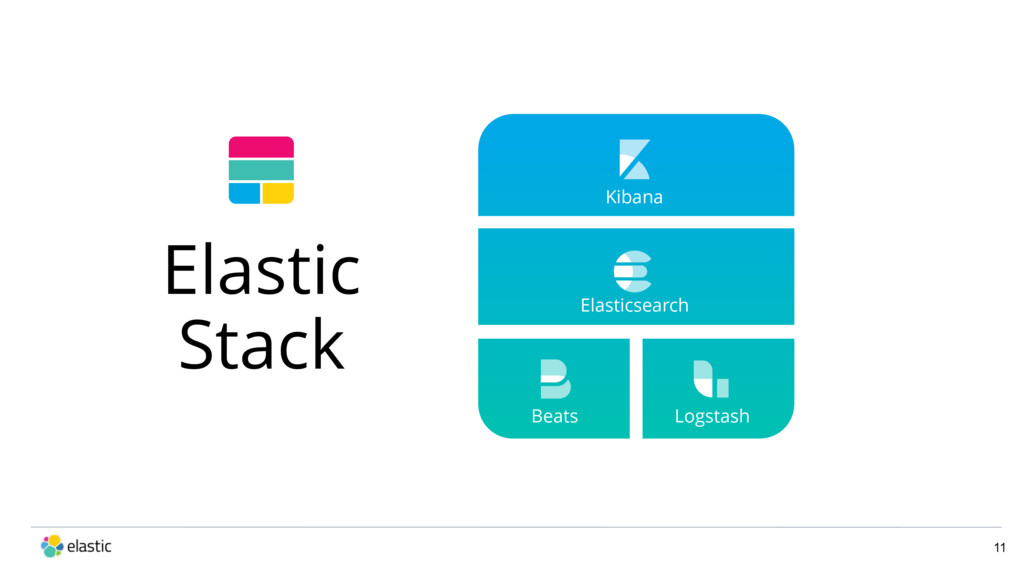
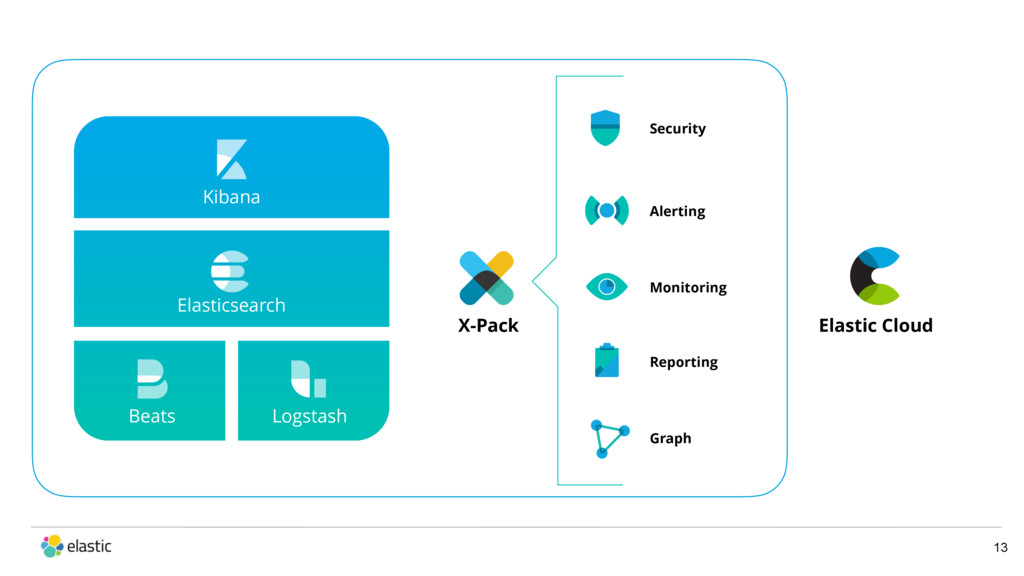
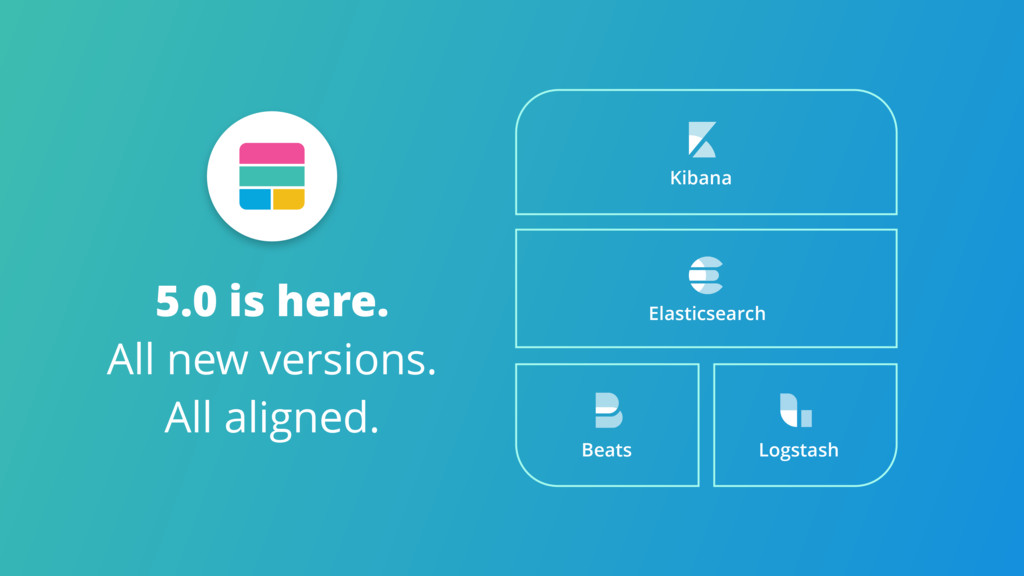
The Elastic Stack is a new name and vision for our open source projects: Elasticsearch, Kibana, Logstash, and Beats. But what does that really mean, and where are we headed? This session will set the stage (literally) for the day.

Elastic Co

October 19, 2016
Tweet

More Decks by Elastic Co

Other Decks in Technology

Transcript

  1. Shay Banon, Co-Founder & CTO, Creator of Elasticsearch 1 New

    York City | October 19 2016 WIFI: Network: Elasticon Password: Tour2016 OPENING KEYNOTE From ELK to the Elastic Stack
  2. 2 2010 2012 2013 2014 2015 2016 First version of

    Elasticsearch
 released in February
  3. 3 2010 2012 2013 2014 2015 2016 Elasticsearch founded as

    a company Total cumulative downloads 2M
  4. 2010 Kibana and Logstash open source projects join Elasticsearch Total

    cumulative downloads 5M 2012 2013 2014 2015 2016 4
  5. 2010 1st Elastic{ON} user conference Company name changed to “Elastic”

    Found acquired (now Elastic Cloud) Packetbeat team joins Elastic (now Beats) Total cumulative downloads 45M 2012 2013 2014 2015 2016 6
  6. 2010 2nd Elastic{ON} user conference ELK “Elastic Stack” Prelert acquisition

    Total cumulative downloads … 2012 2013 2014 2015 2016 7
  7. 14 Jun 9, 2015 1.6 Jul 16, 2015 1.7 Feb

    19, 2015 4.0 Jun 10, 2015 4.1 May 14th, 2015 1.5 May 27th, 2015 1.0 Beta 1 July 13th, 2015 1.0 Beta 2 Sept 4 th, 2015 1.0 Beta 3 May 23, 2015 1.5 Nov 5, 2014 1.4 It’s complicated es kibana ls beats
  8. Search and analytics, it all started here More than 60%

    of our customers have a search or analytics use case
  9. 18

  10. 19

  11. Logs Logs Logs, 
 many devices,
 many systems More than

    40% of our
 customers use our products
 for operational log analysis
  12. We collect more than 1.2 TB logs every day from

    our infrastructure, web servers, and applications. 21
  13. 22 We handle more than 3 Billion daily events while

    meeting our all of our data security requirements.
  14. Sniff sniff sniff,
 find the bad actors
 in your data

    200% YoY growth in security use cases with our products
  15. The Elastic Stack: 
 A foundation to solve many use

    cases 75% of our customers use our products for more than one use case SEARCH SECURITY CUSTOM APPS METRICS OPERATIONAL
 ANALYTICS LOG ANALYSIS
  16. 28 Enterprise search Intranet search Real-time log analytics Legal contract

    repository Trade tracking application HR recruiting application
  17. Cloud is 4real, let us host and manage the stack

    250% growth in our cloud business since March 2015
  18. 30 elastic cloud Hosted Elasticsearch & Kibana From the Source

    Log into Elastic Cloud Login Password [email protected] Forgot your password? We’ll help. Don't have an account? Sign up. by
  19. 31 Elastic Cloud as a Product In ANY cloud …

    In YOUR cloud … Many clusters / use cases Single use case, as a service Available in AWS today
  20. 32 Provisioning, orchestration, and management of multiple Elastic Stacks Expected

    GA Q1 2017 Same technical foundation as the Elastic Cloud service
  21. 34 Thank you sponsors March 7-9, 2017 Pier 48 San

    Francisco, CA 2,500 attendees Thank you speakers 3rd Annual Elastic User Conference SUBMIT A TALK: Call for Speakers Open SUBMIT A CAUSE: First Cause Awards https://www.elastic.co/elasticon/conf/2017/sf/registration
  22. Better support for Numb3rs • BKD Trees • Lower heap

    usage • IPv6 Support 39 Faster & reduced memory/disk for many use cases
  23. 0 10000 20000 30000 40000 50000 60000 70000 80000 float

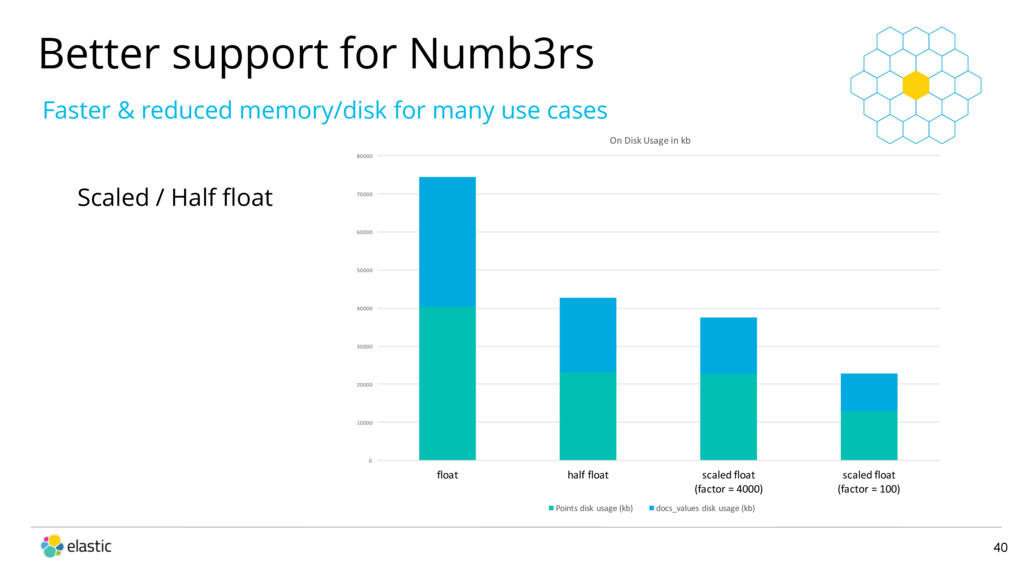
    half float scaled float (factor = 4000) scaled float (factor = 100) On Disk Usage in kb Points disk usage (kb) docs_values disk usage (kb) Better support for Numb3rs Scaled / Half float 40 Faster & reduced memory/disk for many use cases
  24. Fast, Safe Scripting Language 42 • Both static and dynamic

    types • List, map, and array initializers • Built-in regular expressions • Lambda expressions Say “Heya” to Painless
  25. 43 • Automatic time-series index management • Rollover APIs Logs-0001

    Logs-0002 Logs-0003 1000 docs 800 docs 0 docs Logs (alias) Simplified Architecture
  26. Simplified Architecture 44 • Automatic time-series index management • Shrink

    APIs Shard 1 Compressed Shard 2 /_shrink API High-volume Writes Hot nodes Lower-resource warm nodes Compressed Shard 1 Shard 2 Shard 3 Shard 4
  27. Simplified Architecture 45 • Simplified experience for interactive pages •

    Wait-for-Refresh • Simplified getting started experience • Ingest Node: More to come on this today
  28. Resiliency and Safety Improvements 46 • We saw some common

    problems when getting started or new users on a multi-tenant environment • Bootstrap checks • Circuit breakers • Safeguards
  29. Resiliency and Safety Improvements 48 • Understanding and preventing a

    terrible Friday afternoon • 2 phase cluster state commit • safe primary relocations
  30. Faster, more normal DSL and responses 49 • Completion Suggester

    v2 • Percolation is now a normal query • Profile API expansion to include aggregations and not just queries
  31. Beyond 5.0 50 • Higher timestamp resolution (great for logging

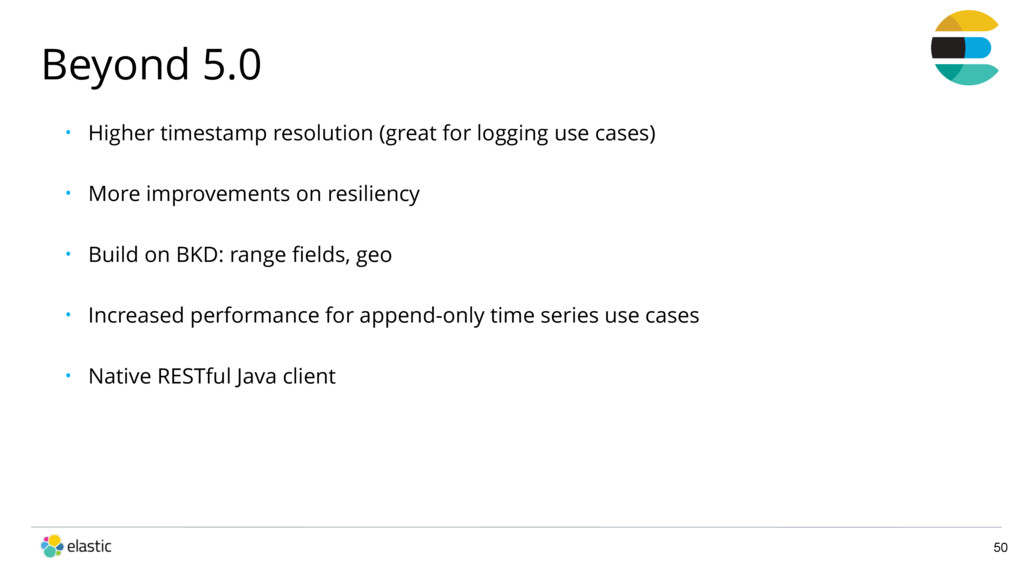
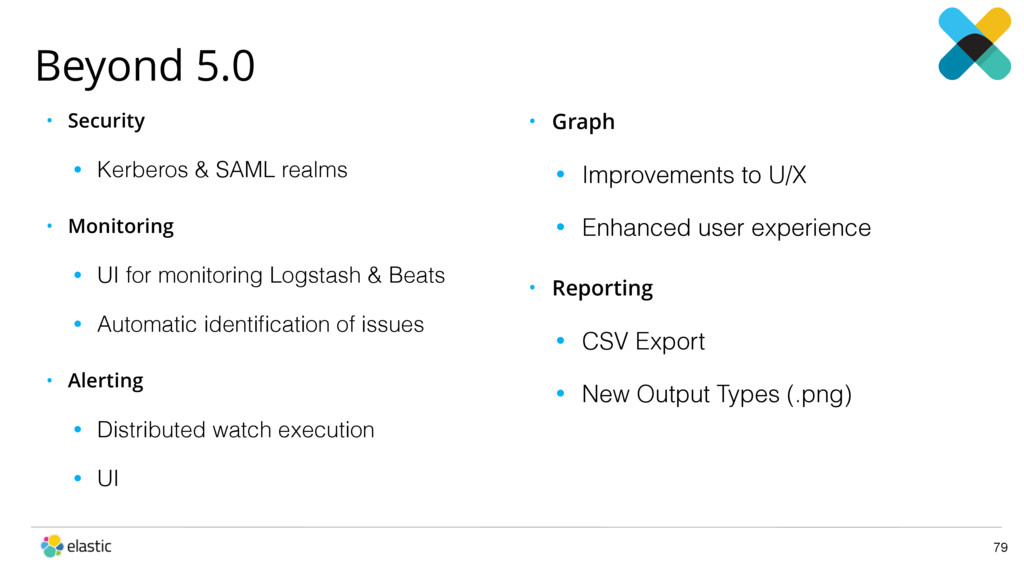
    use cases) • More improvements on resiliency • Build on BKD: range fields, geo • Increased performance for append-only time series use cases • Native RESTful Java client
  32. Kibana Evolution: 5.0 Discover Dashboard Graph Settings Users DevTools Data

    Visualization Management Timelion Monitoring Visualize Console
  33. Beyond 5.0 60 • Kibana is the Window into the

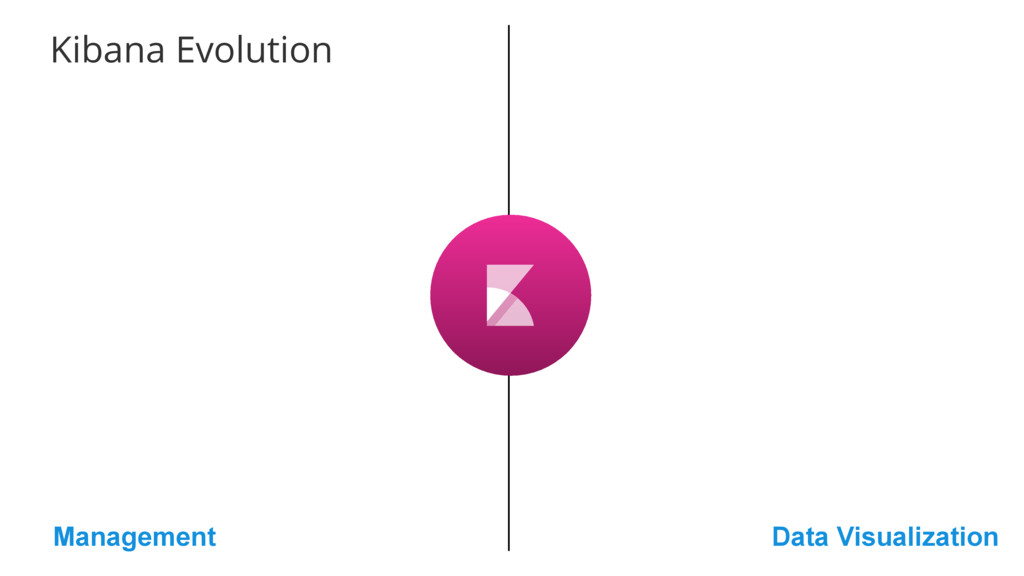
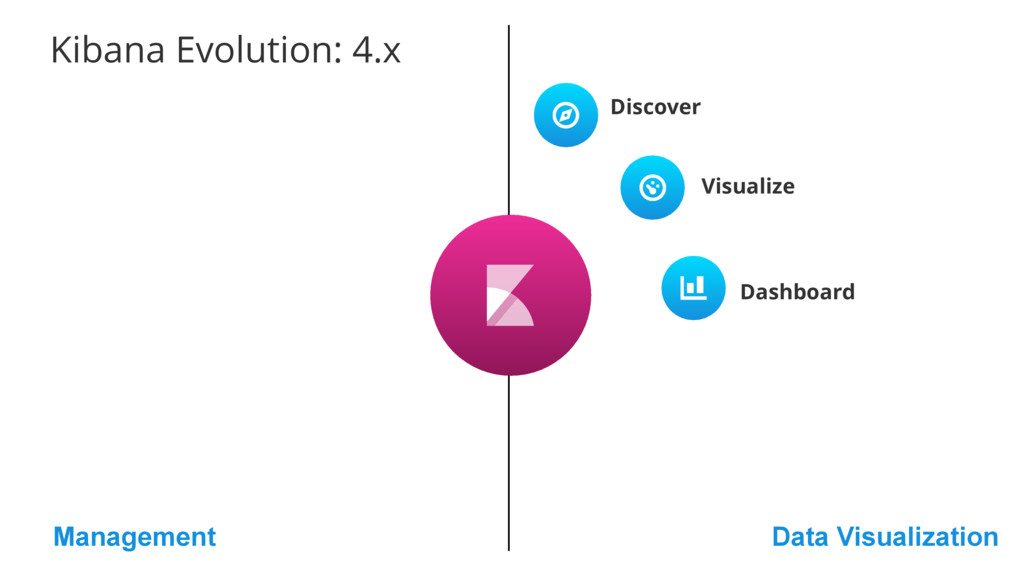
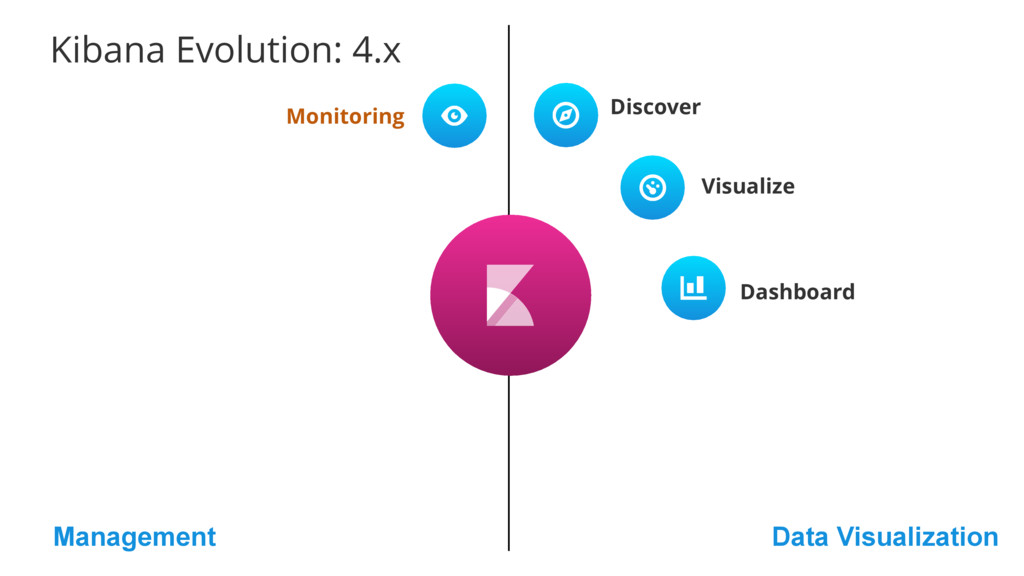
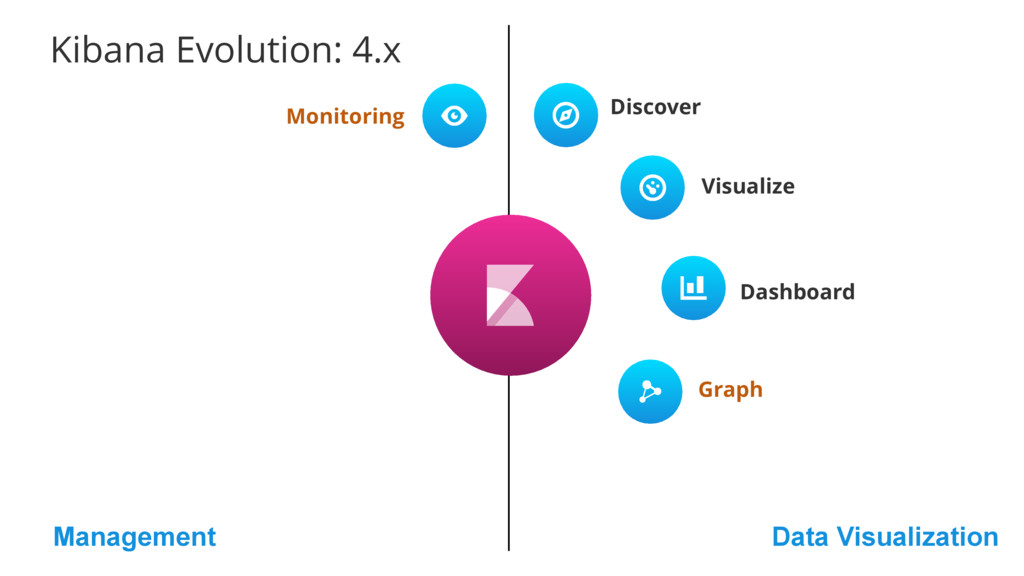
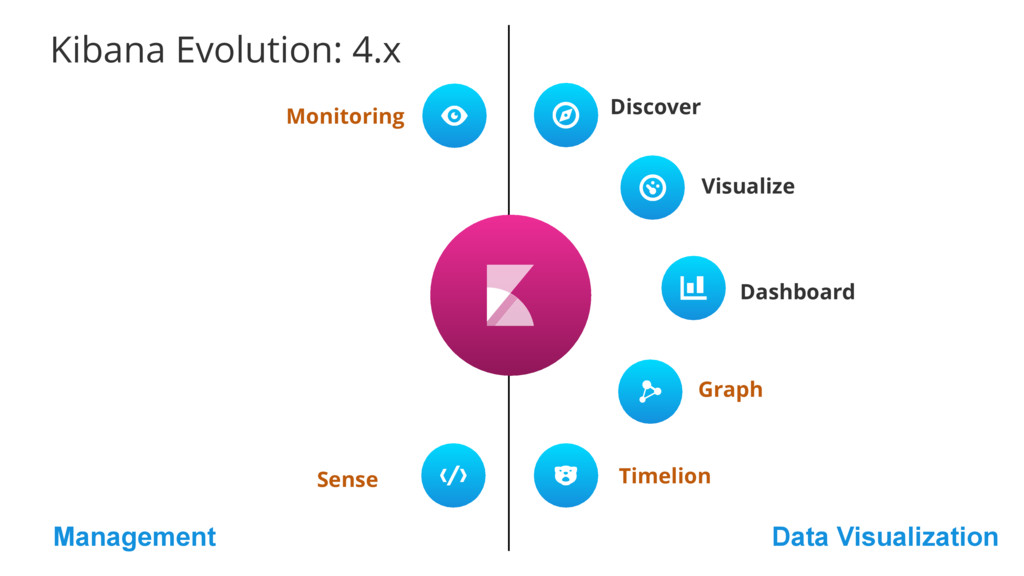
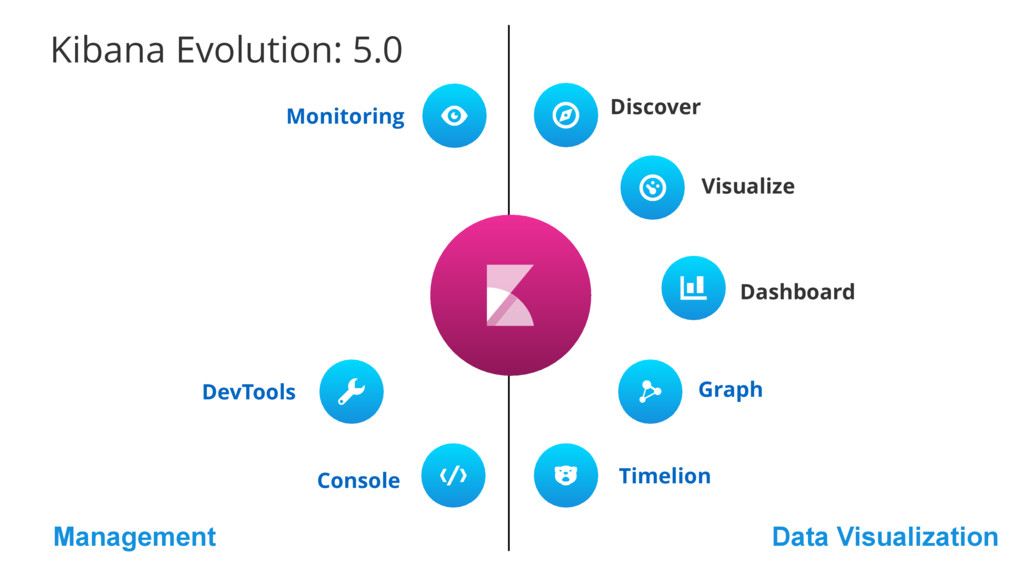
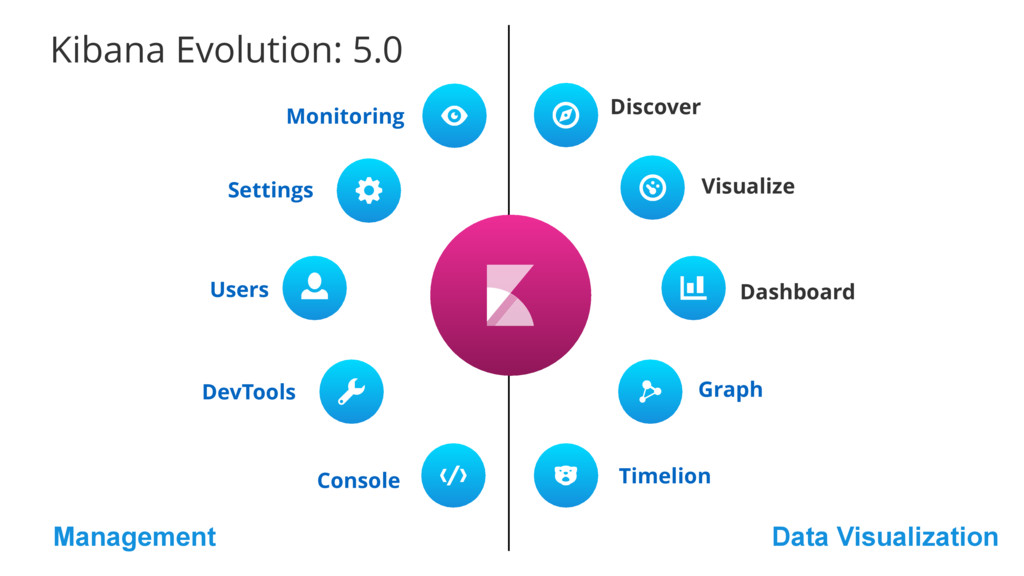
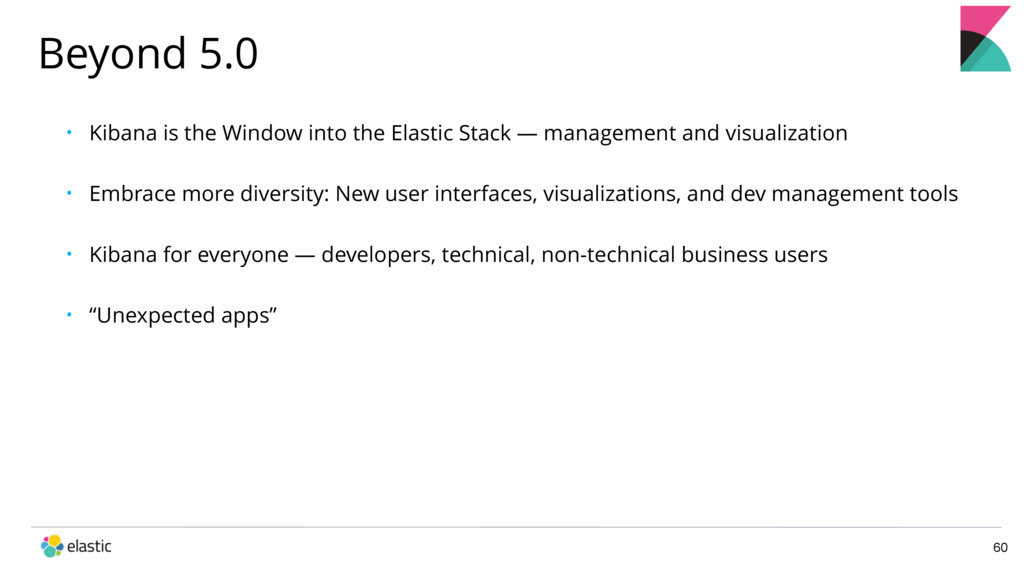
    Elastic Stack — management and visualization • Embrace more diversity: New user interfaces, visualizations, and dev management tools • Kibana for everyone — developers, technical, non-technical business users • “Unexpected apps”
  34. X-pack X-pack Nodes (X) Logstash Messaging Queue Kafka Redis Elasticsearch

    Master Nodes (3) Data Nodes - Warm (X) Instances (X) Kibana Custom UI Datastore Web APIs Social Sensors Log Files Beats Metrics Wire Data your{beat} Hadoop Ecosystem ES-Hadoop Ingest Nodes (X) Data Nodes - Hot (X) Authentication Notification LDAP AD SSO
  35. New in 5.0 65 Streamline network & storage Count and

    bytes on the TCP/IP layer not application layer No more double Logstash Beats Processors Packetbeat Kafka output for Beats
  36. Logstash: Goodbye Black Box! 68 logstash:9600/ _node Node Info
 Node

    Stats
 Plugins
 Hot Threads Monitoring API Debug active pipelines with new logging API Component level logging granularity Log4j2 Internal Logging
  37. Logstash: Performance++ 69 20%+ increase in overall pipeline performance 50%

    performance boost ingesting from Beats New Java Event Beats Input Java Rewrite
  38. Logstash: Plugin Features 70 Developers can generate new plugins in

    seconds Kafka 0.10 Support Basic Auth & SSL/TLS Plugin Generator Kafka Support++ Kinesis Input
 Protobuf Codec
 Dissect Filter IPv6 Support with GeoIP2 New Plugins
  39. 71 Elasticsearch Kibana ES-Hadoop Backup Elasticsearch with HDFS Efficiently move

    data between Elasticsearch & Hadoop Elasticsearch-Hadoop 5.0 Spark 2.0 & Better Streaming Support Ingest Node Pipeline Integration Elasticsearch 5.0 Parallel Reader
  40. Beyond 5.0 (Beats) 72 • Moar modules in Metricbeat •

    Moar Beats • Even easier getting started experience • Centralized configuration & monitoring
  41. Beyond 5.0 (Logstash) 73 • Logstash persistence (disk-based queuing) •

    Monitoring UI & centralized configuration • Multiple pipelines, one JVM • Error event routing
  42. X-Pack: One Pack. Many Features. 76 Kibana Elasticsearch Beats Logstash

    Security Alerting Monitoring Reporting X-Pack Graph 76
  43. Beyond 5.0 79 • Security • Kerberos & SAML realms

    • Monitoring • UI for monitoring Logstash & Beats • Automatic identification of issues • Alerting • Distributed watch execution • UI • Graph • Improvements to U/X • Enhanced user experience • Reporting • CSV Export • New Output Types (.png)
  44. 81 • How do I know my systems are behaving

    normally? • Where to set thresholds for good alerting?
 • How to find the root cause of problems when I don’t know what to look for? IT Operations
  45. 82 • Do I have systems that are compromised with

    malware?
 • Which users could be an insider threat? IT Security
  46. 83 • Is my factory working normally?
 • What do

    I do with thousands of time-series data?
 • Which traffic incidents are causing the most delay? Other
  47. Example: Detecting anomalies in data 85 Notify when current behavior

    deviates significantly from the predictive model Unsupervised machine learning automatically models behaviors in data
  48. Coming Soon 87 • Beta available for download now •

    Working on tighter integration into the Elastic Stack • GA targeted in first half of 2017
  49. Detecting Insider Threats with the Elastic Stack Red Owl Analytics

    Russel Snyder, Principal Engineer Adam Reeve, Principal Architect