Upgrade to Pro — share decks privately, control downloads, hide ads and more …

Web site performance improvement

Web site performance improvement

A document for in-house training (live web site optimization).

Kengo TODA

June 03, 2014
Tweet

More Decks by Kengo TODA

Other Decks in Technology

Transcript

  1. Web site performance improvement
    ● Goal
    ● Policy to improve performance
    ● How to research points to improve
    ● Case study

    View Slide

  2. Goal
    ● Draw pages quickly
    – This slide explains only about client side
    performance but generally you also need to
    care about server side.

    View Slide

  3. What we should care
    when developer improves performance?

    View Slide

  4. Policy 1
    ● Start when you need, from most effective
    point
    – “premature optimization is the root of all evil”
    (Donald Knuth)
    – the law of the instrument: “Give a small boy a
    hammer, and he will find that everything he
    encounters needs pounding.”
    (Abraham Kaplan)

    View Slide

  5. Policy 2
    ● Understand pros and cons of your
    improvement
    – Optimization may make your product and/or
    build system complex
    ● e.g. JS/CSS Minification, CSS Image Sprites
    – Is it enough simple for long-life system? Tricky
    solution may make maintenance difficult.

    View Slide

  6. Policy 3
    ● Make your improvement evaluable
    – Do not 
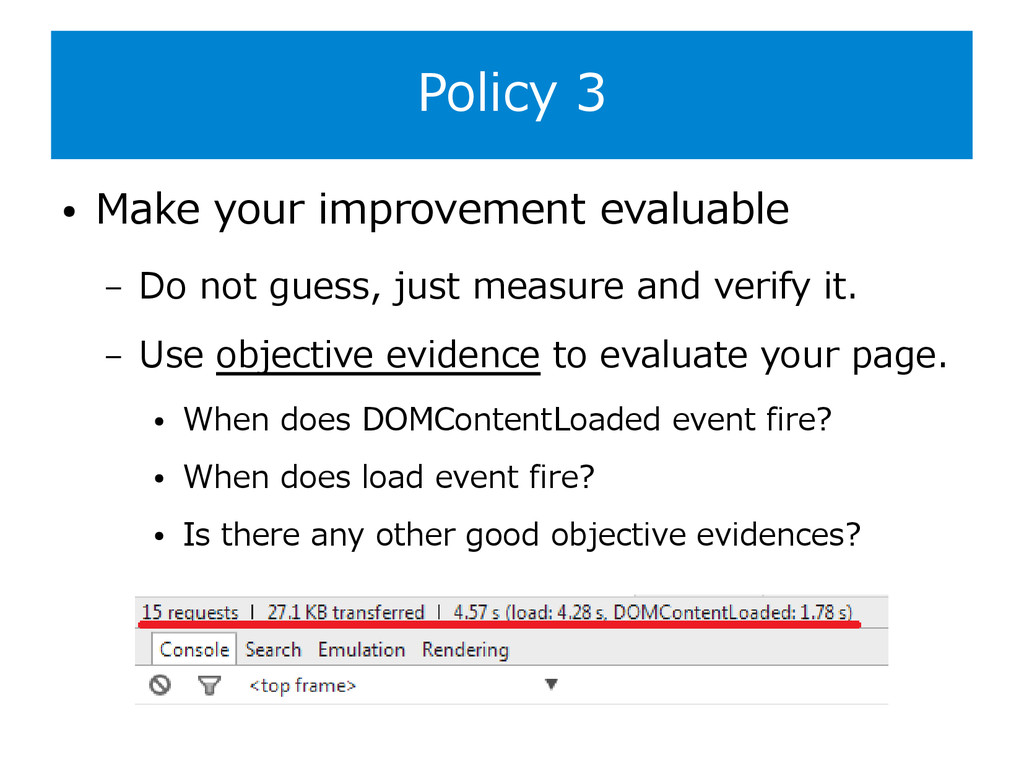
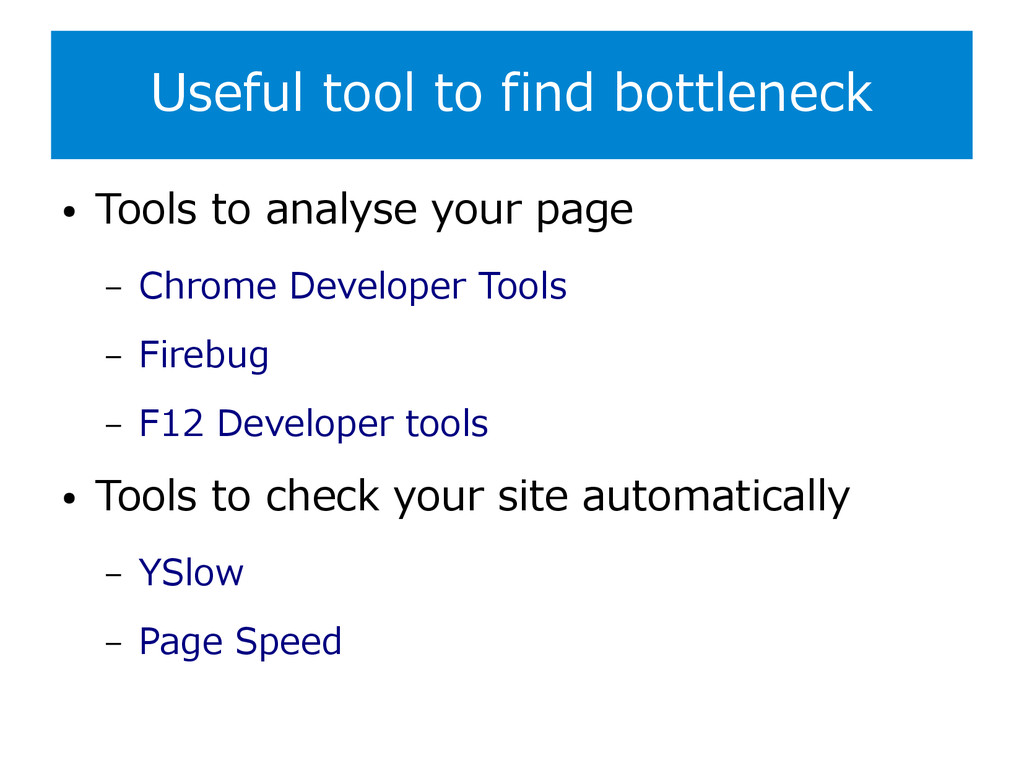
guess, just measure and verify it.
    – Use objective evidence to evaluate your page.
    ● When does DOMContentLoaded event fire?
    ● When does load event fire?
    ● Is there any other good objective evidences?

    View Slide

  7. Problem: How to find 'most effective point'?

    View Slide

  8. Basic knowledge
    ● To build hypothesis, learn general
    examples and best practices
    – High Performance Web Sites (O'Reilly)
    – Even Faster Web Sites (O'Reilly)
    – High Performance JavaScript (O'Reilly)
    – Web Performance Best Practices
    – Yahoo!'s Exceptional Performance

    View Slide

  9. Basic knowledge
    ● To use correct tool, you need 'tool box'
    – To choose, you need choices.
    TNT

    View Slide

  10. Useful tool to find bottleneck
    ● Tools to analyse your page
    – Chrome Developer Tools
    – Firebug
    – F12 Developer tools
    ● Tools to check your site automatically
    – YSlow
    – Page Speed

    View Slide

  11. Problem: How to evaluate my challenge?

    View Slide

  12. Useful tool to archive performance
    ● HTTP Archive (HAR) format
    – JSON based, supported by modern browsers
    – Good to compare result with previous state

    View Slide

  13. Case Study:
    http://career.worksap.com/index.html

    View Slide

  14. Overview

    View Slide

  15. What is problem?
    ● 'Wait' means that browser waits response
    from server.
    – Latency problem: server is too far from client
    ● 'Receive' means that browser receives data
    from server.
    – Too much data to download

    View Slide

  16. Which data is so huge?
    ● JavaScript and Image are heavy
    – JavaScript: 5 files, 144.4 KiB
    – Image: 49 files, 593.2KiB
    – YSlow reported that content isn't gzipped
    – jquery.js (105.3 KB) is the
    biggest resource

    View Slide

  17. Does browser cache works?
    ● You can see that it 
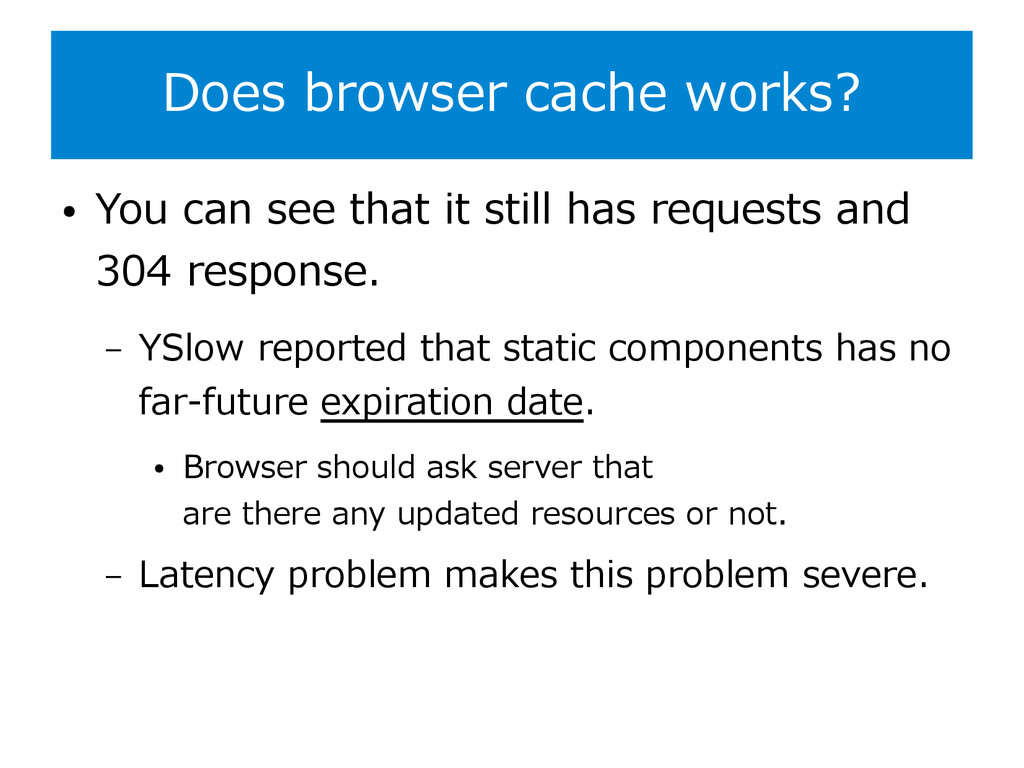
still has requests and
    304 response.
    – YSlow reported that static components has no
    far-future expiration date.
    ● Browser should ask server that
    are there any updated resources or not.
    – Latency problem makes this problem severe.

    View Slide

  18. Problem
    ● Controlable
    – JS/CSS is not gzipped
    – Size of images are too heavy
    – No expiration date in HTTP response
    ● Uncontrolable
    – Latency
    ● to solve, we need new server or CDN

    View Slide

  19. Solution 1: mod_deflate
    ● Compress text data (JS/CSS)
    – JQuery.js:
    105Kib -> 37.1KiB (x2.83)
    – jquery.smoothScroll.js:
    15.3KiB -> 6.6KiB (x2.32)
    AddOutputFilterByType DEFLATE
    text/html text/plain text/xml
    application/x-javascript text/css

    View Slide

  20. Solution 2: Image compression
    ● JPEGmini and TinyPNG to compress images
    – Result: 593.2KiB -> 453.8KiB (x1.3)

    View Slide

  21. Solution 3: mod_expires
    ● Add expiration date to HTTP response
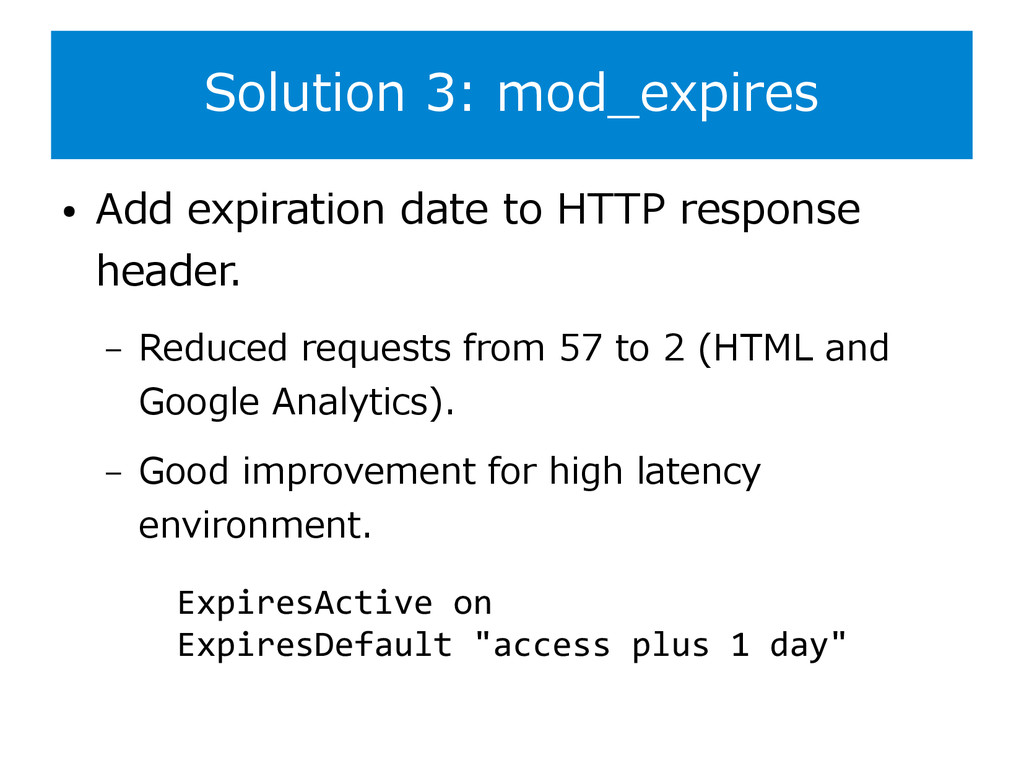
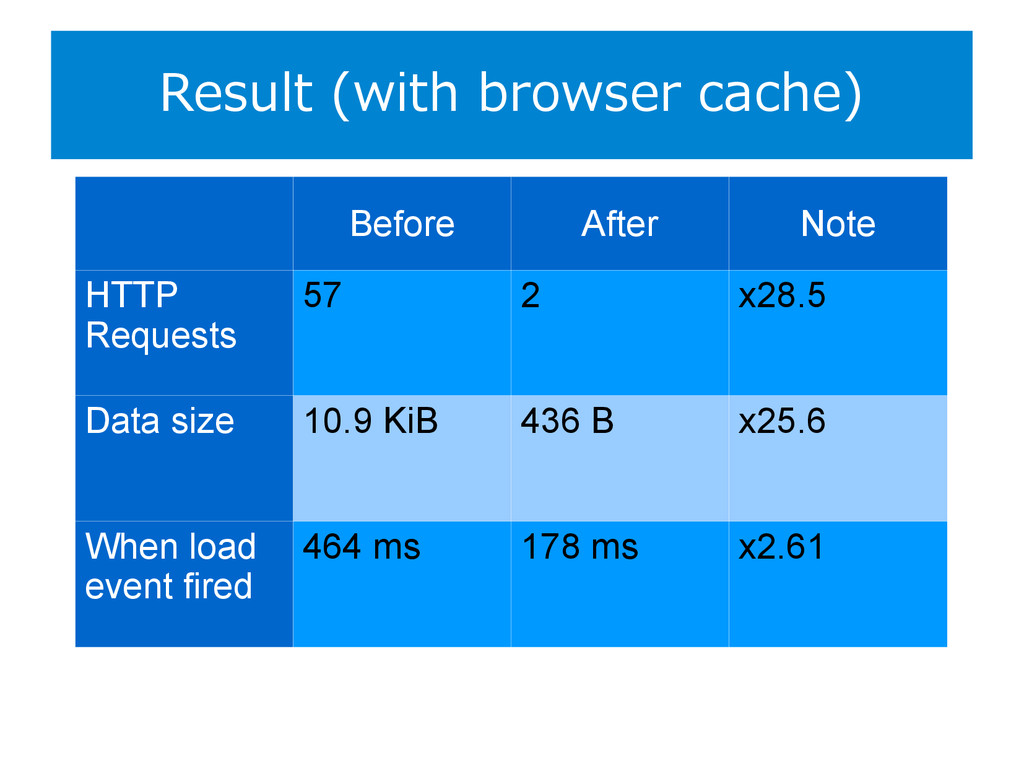
    header.
    – Reduced requests from 57 to 2 (HTML and
    Google Analytics).
    – Good improvement for high latency
    environment.
    ExpiresActive on
    ExpiresDefault "access plus 1 day"

    View Slide

  22. Result (without browser cache)
    Before After Note
    HTTP
    Requests
    57 57 x1.00
    Data size 754 KiB 629 KiB x1.20
    When load
    event fired
    1.61s 1.33s x1.21

    View Slide

  23. Result (with browser cache)
    Before After Note
    HTTP
    Requests
    57 2 x28.5
    Data size 10.9 KiB 436 B x25.6
    When load
    event fired
    464 ms 178 ms x2.61

    View Slide

  24. Conclusion
    ● Learn general examples and best practices
    ● Dig and find why your page is so slow
    ● Use proper method to make it better

    View Slide

  25. Appendix: What is F5 (reload)?
    Send request to
    download
    resources?
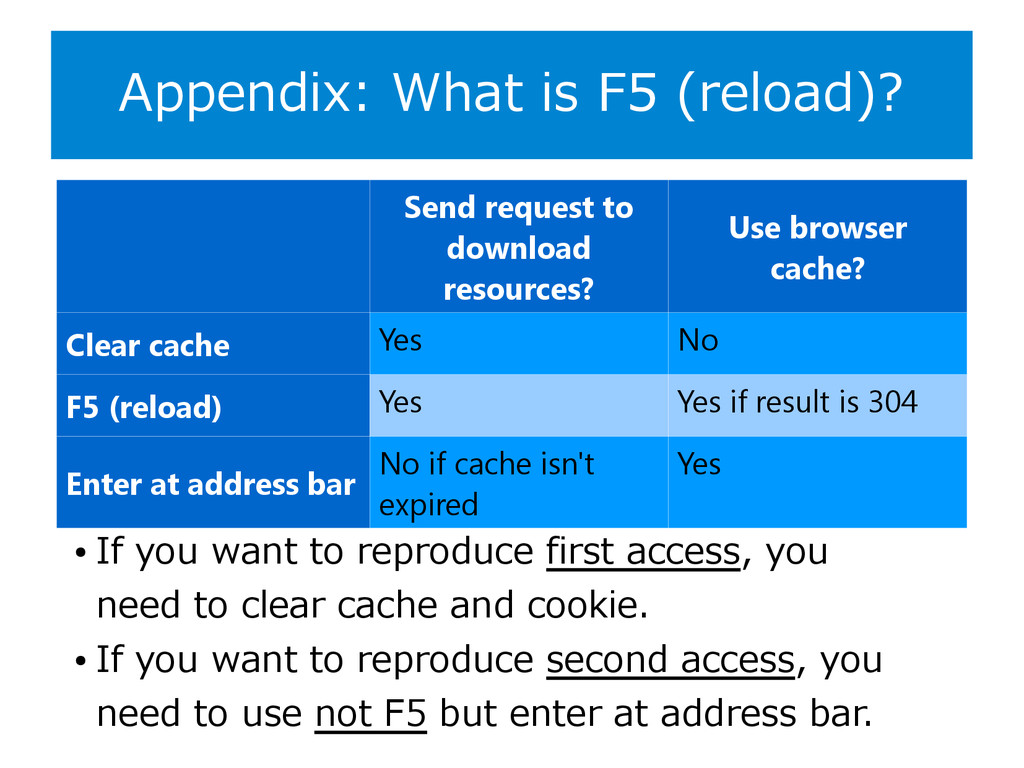
    Use browser
    cache?
    Clear cache Yes No
    F5 (reload) Yes Yes if result is 304
    Enter at address bar
    No if cache isn't
    expired
    Yes
    ● If you want to reproduce first access, you
    need to clear cache and cookie.
    ● If you want to reproduce second access, you
    need to use not F5 but enter at address bar.

    View Slide

  26. Thanks for your reading!
    Written by Kengo TODA (@eller86)
    Visit http://career.worksap.com/ to join us!

    View Slide