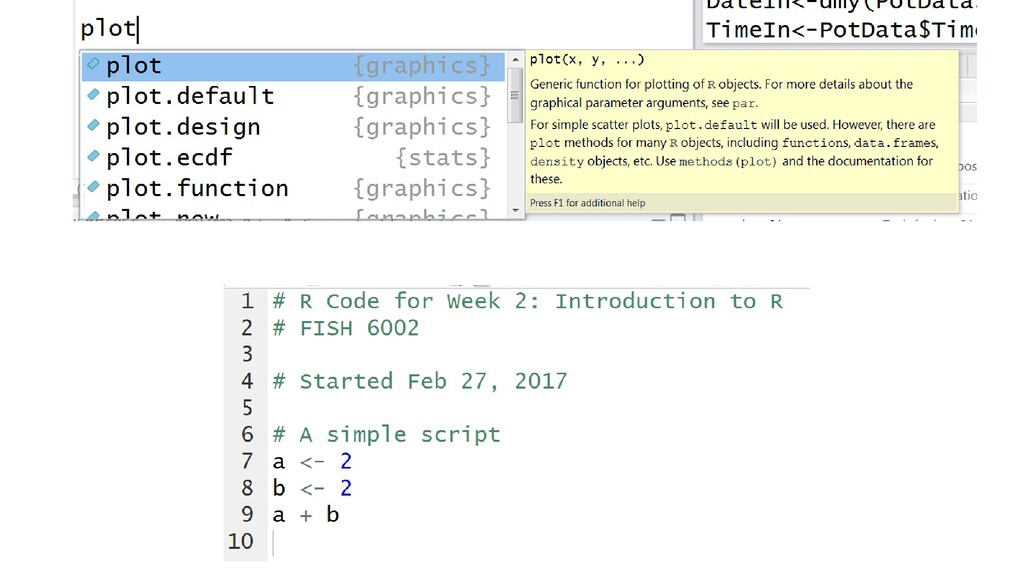
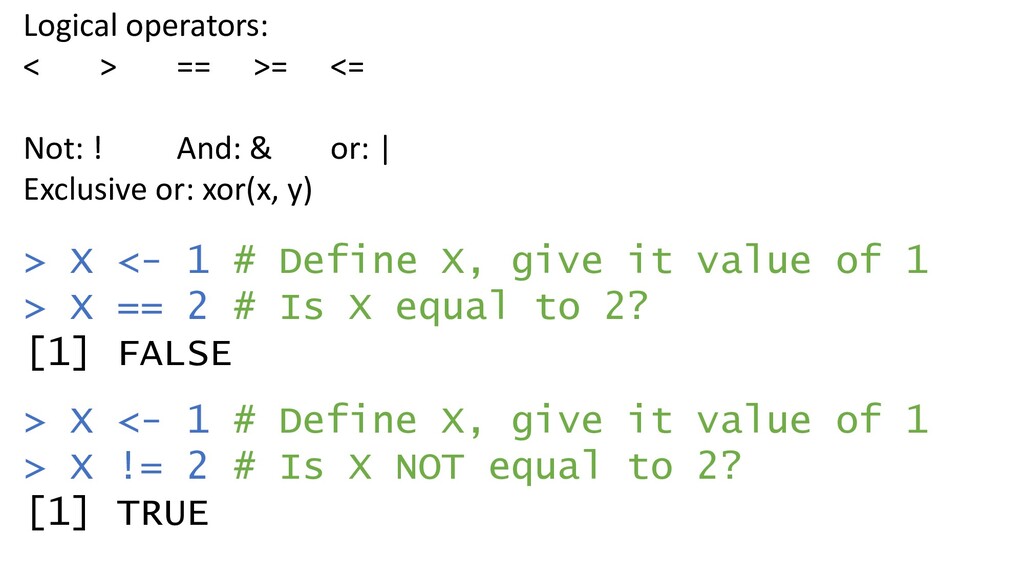
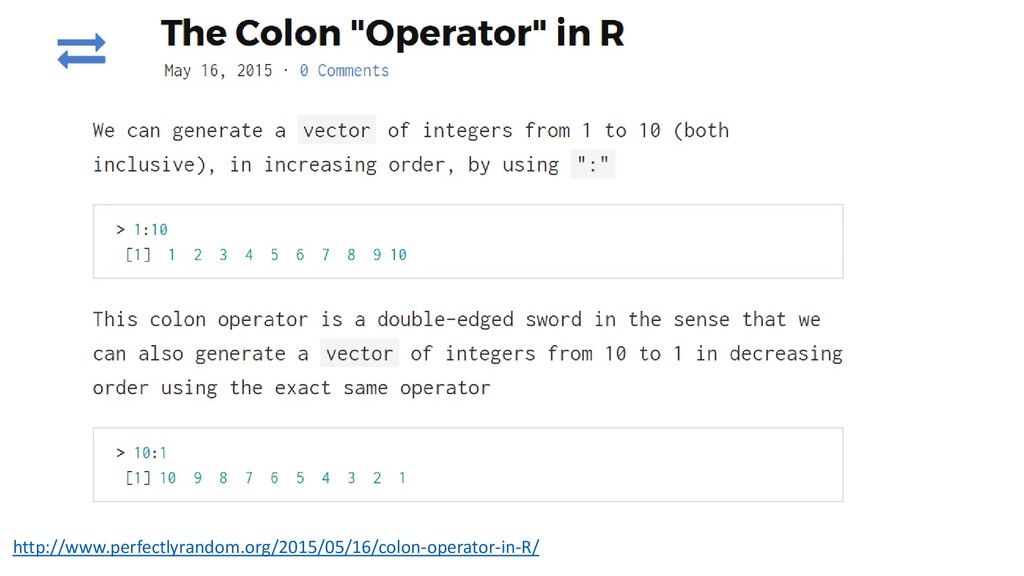
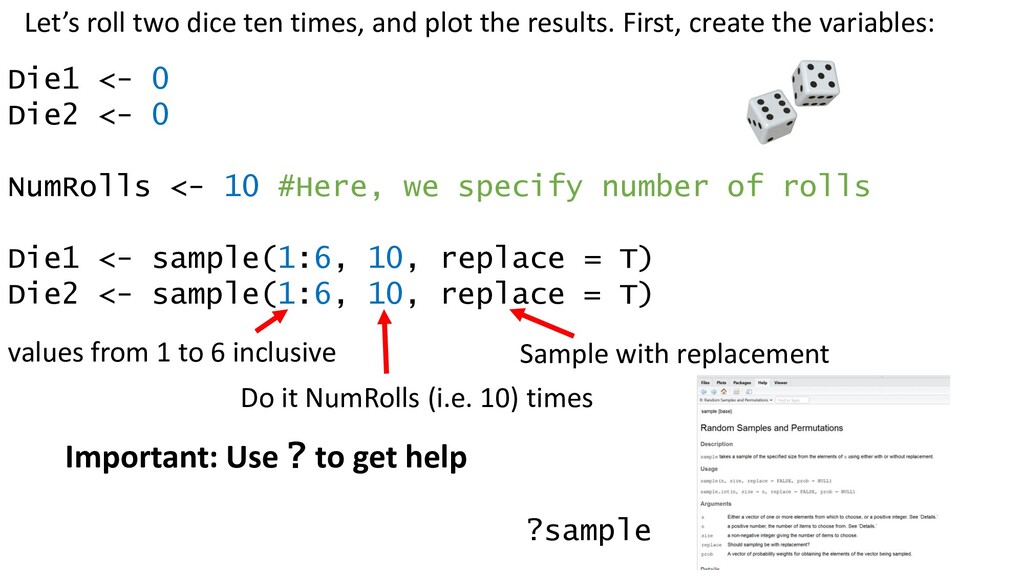
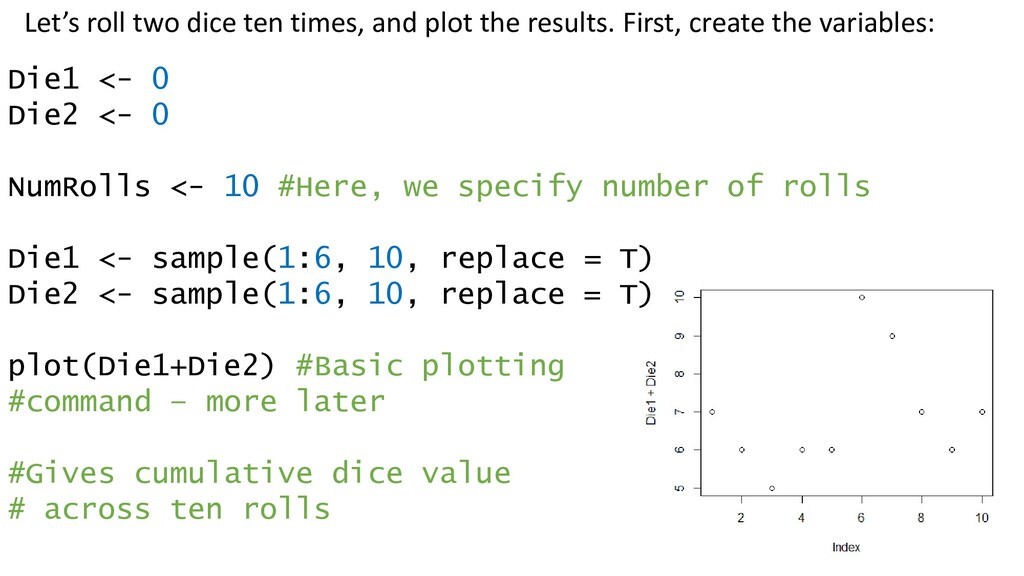
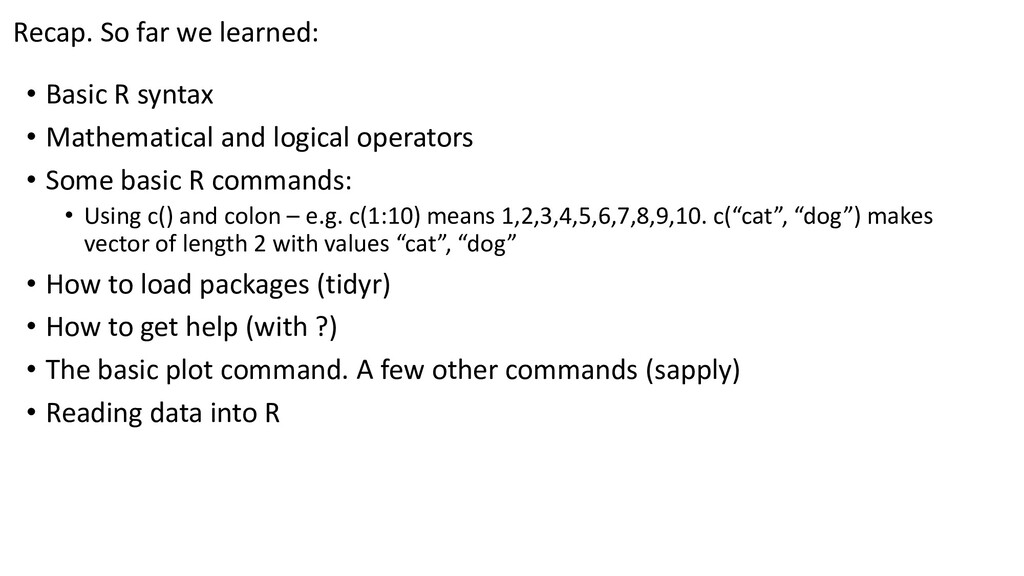
Mathematical and logical operators • Some basic R commands: • Using c() and colon – e.g. c(1:10) means 1,2,3,4,5,6,7,8,9,10. c(“cat”, “dog”) makes vector of length 2 with values “cat”, “dog” • How to load packages (tidyr) • How to get help (with ?) • The basic plot command. A few other commands (sapply) • Reading data into R
![[1] 4 # A simple script a <- 2 b](https://files.speakerdeck.com/presentations/b092a60be26e42108c6623f4b212c7ce/slide_23.jpg)
![[1] 4 # A simple script a <- 2 b](https://files.speakerdeck.com/presentations/b092a60be26e42108c6623f4b212c7ce/slide_24.jpg)
![> 2 [1] 2 R is a calculator > 2](https://files.speakerdeck.com/presentations/b092a60be26e42108c6623f4b212c7ce/slide_30.jpg)
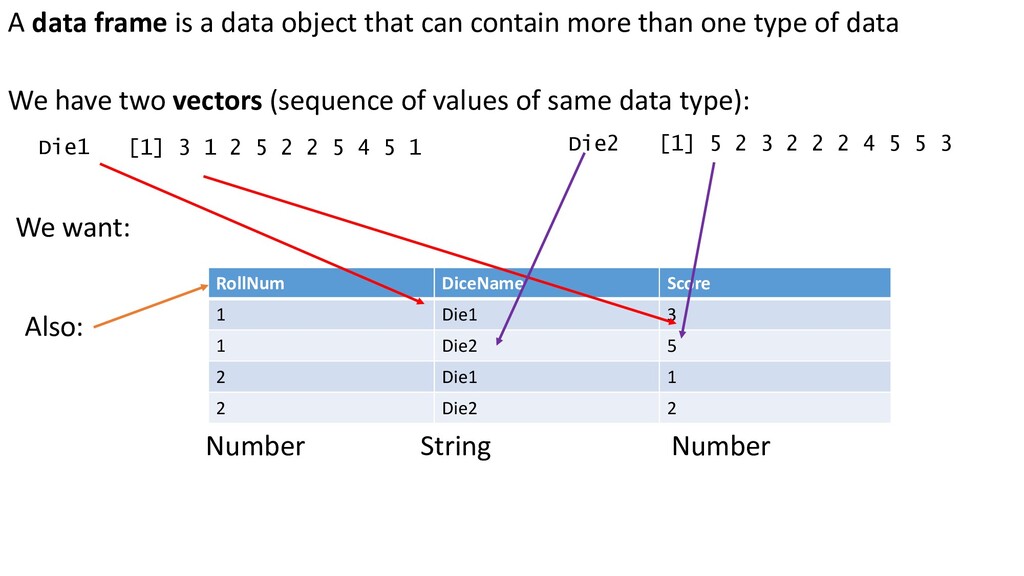
![Die1 [1] 3 1 2 5 2 2 5 4](https://files.speakerdeck.com/presentations/b092a60be26e42108c6623f4b212c7ce/slide_44.jpg)
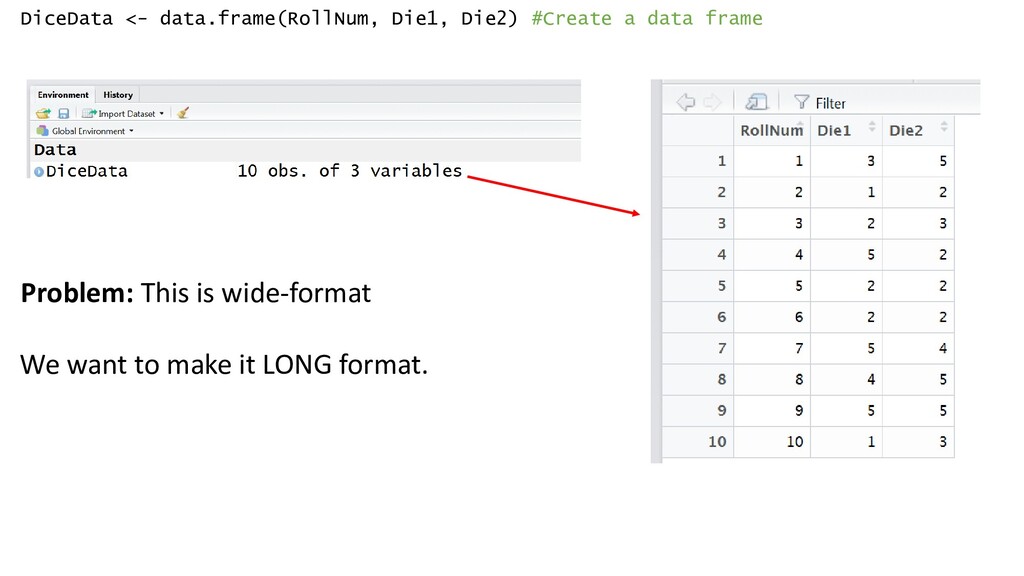
![Die1 [1] 3 1 2 5 2 2 5 4](https://files.speakerdeck.com/presentations/b092a60be26e42108c6623f4b212c7ce/slide_45.jpg)
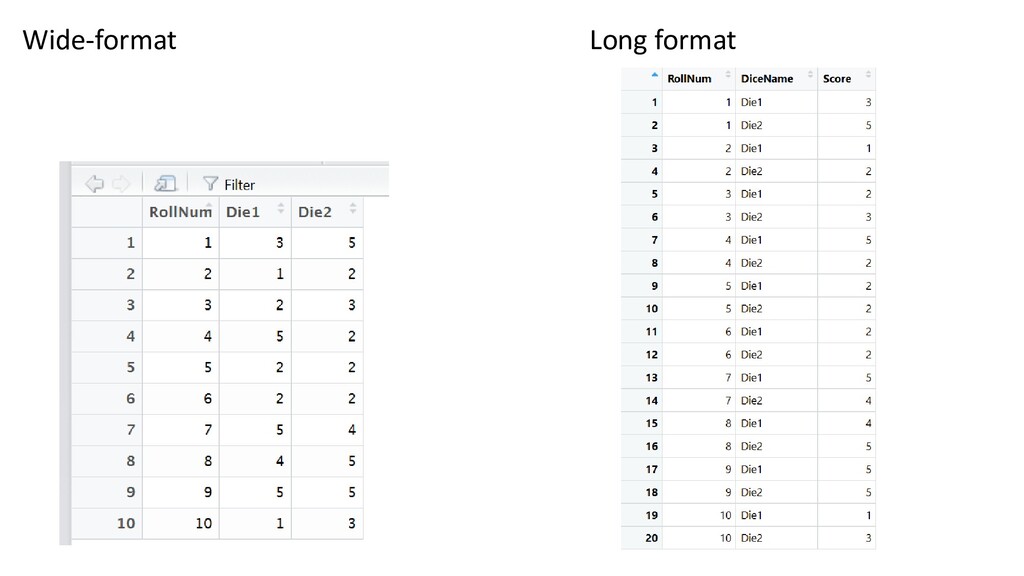
![Die1 [1] 3 1 2 5 2 2 5 4](https://files.speakerdeck.com/presentations/b092a60be26e42108c6623f4b212c7ce/slide_51.jpg)
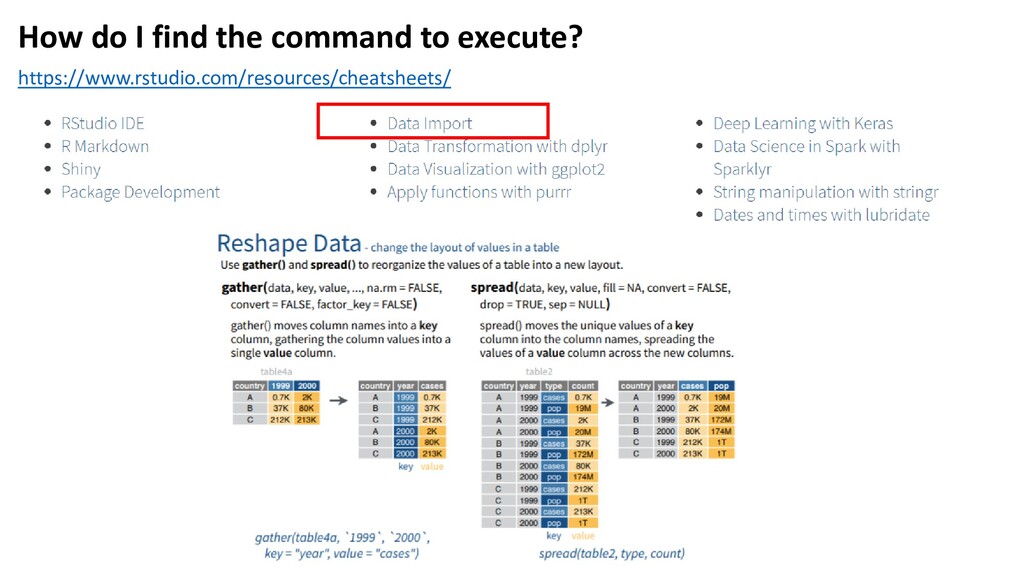
![Die1 [1] 3 1 2 5 2 2 5 4](https://files.speakerdeck.com/presentations/b092a60be26e42108c6623f4b212c7ce/slide_54.jpg)