Analytics is a huge field, this can only be a small, Kaggle-specific view • Much of the structure is “borrowed” from David Kofoed Wind’s blog post and Thesis on Kaggle Best Practices
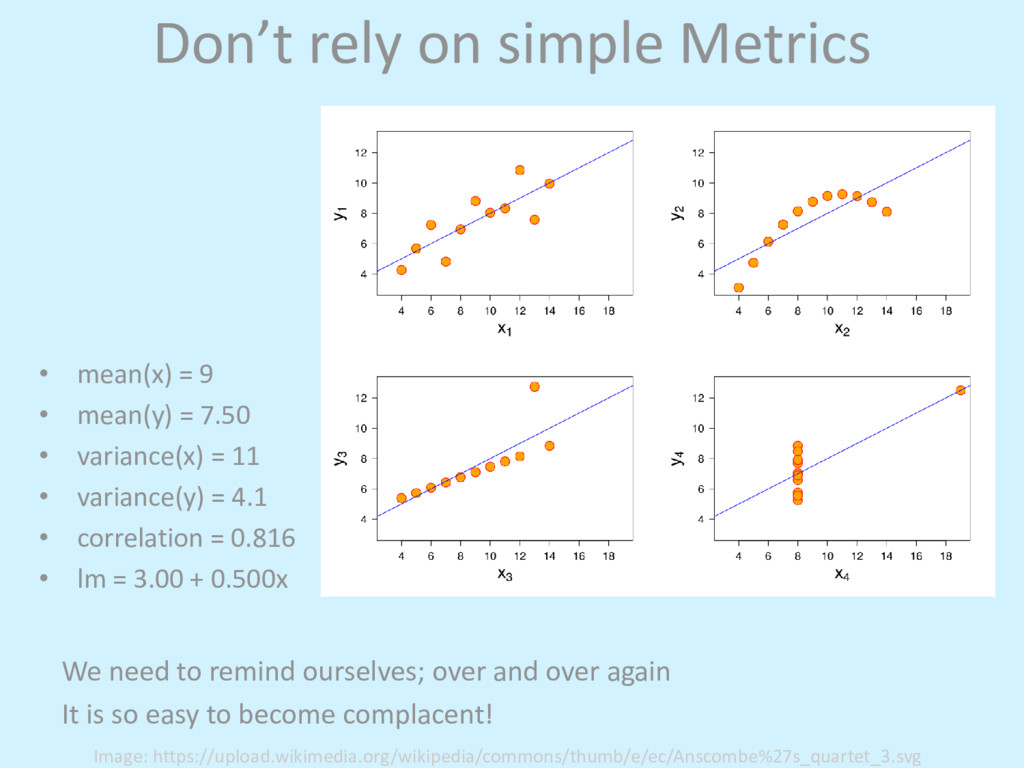
over and over again It is so easy to become complacent! • mean(x) = 9 • mean(y) = 7.50 • variance(x) = 11 • variance(y) = 4.1 • correlation = 0.816 • lm = 3.00 + 0.500x Image: https://upload.wikimedia.org/wikipedia/commons/thumb/e/ec/Anscombe%27s_quartet_3.svg
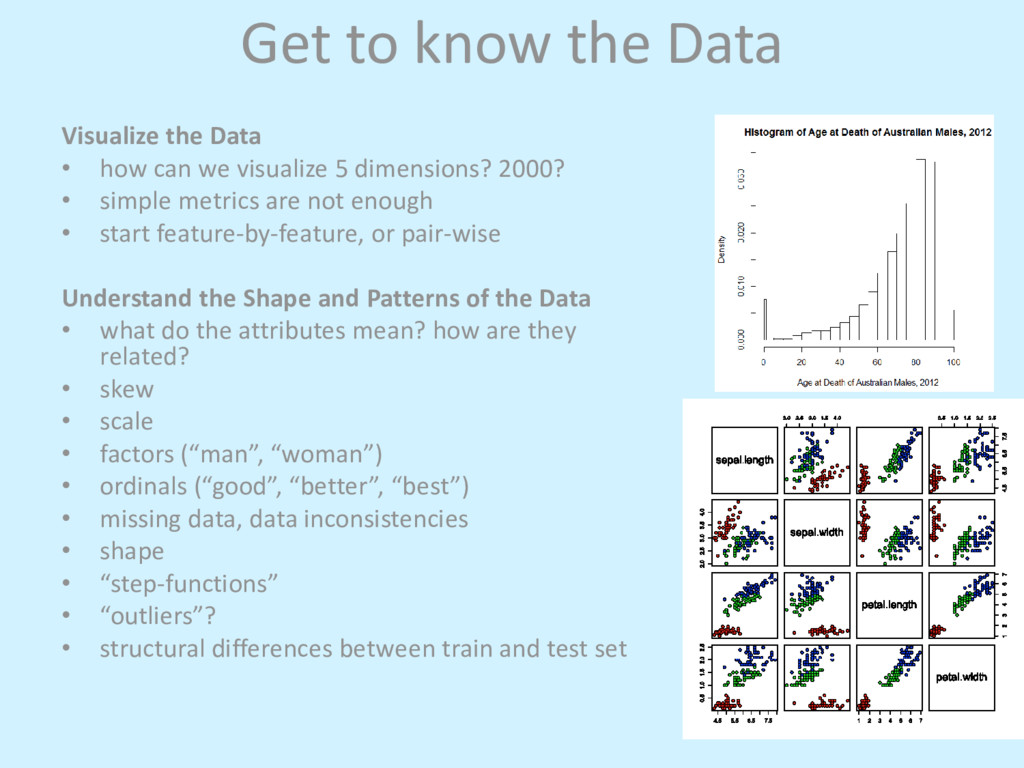
can we visualize 5 dimensions? 2000? • simple metrics are not enough • start feature-by-feature, or pair-wise Understand the Shape and Patterns of the Data • what do the attributes mean? how are they related? • skew • scale • factors (“man”, “woman”) • ordinals (“good”, “better”, “best”) • missing data, data inconsistencies • shape • “step-functions” • “outliers”? • structural differences between train and test set
use same few algorithms (logistic regression, random forest, gbm) • Subject matter expertise often not a huge factor • Err on the side of too many features. Thousands of features usually not a problem • Examples – pairwise: a-b, a/b, a*b, 1/a, log(a), |a| – date => weekday, day of month, time – GPS locations => velocity, acceleration, angular acceleration, segment into stops, segment into accelerating and braking phases, mean/median/stddev/centiles/min/max, etc. – text => ngrams, tokenize, stemming, stopwords Image: https://content.etilize.com/images/300/300/1017951585.jpg
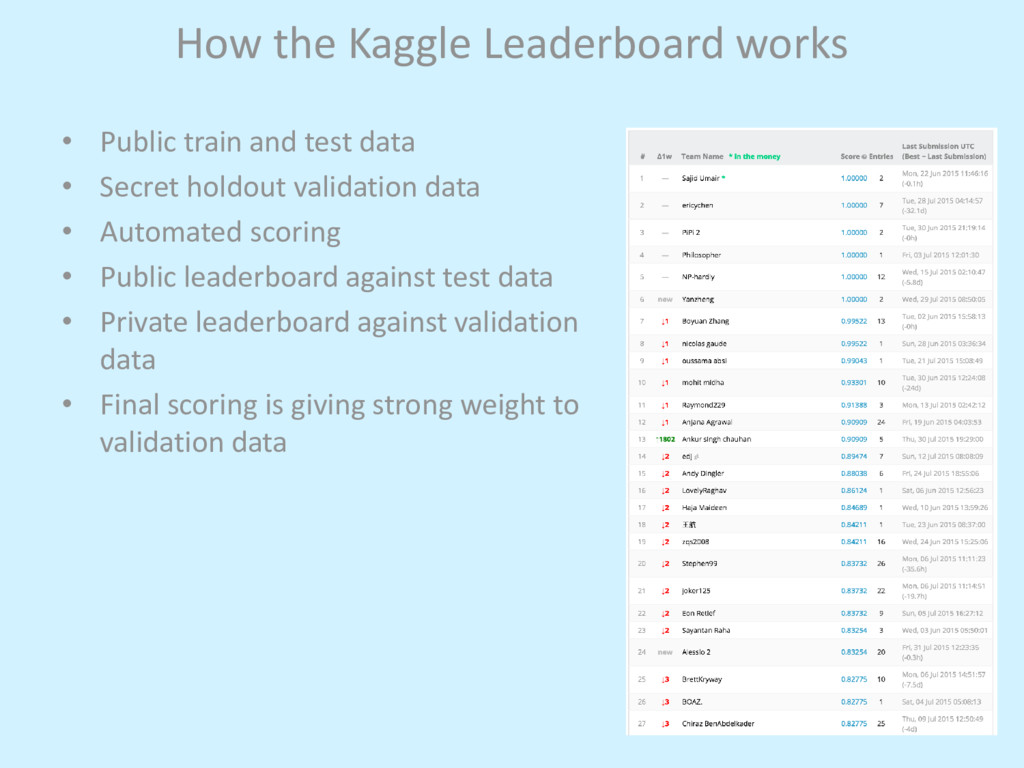
data • Secret holdout validation data • Automated scoring • Public leaderboard against test data • Private leaderboard against validation data • Final scoring is giving strong weight to validation data
lets you choose two final submissions • Strong temptation to submit dozens or hundreds of solutions and to pick the ones that are performing “best” • This leads to “manual overfitting” • “The most brutal way to learn about overfitting? Watching yourself drop hundreds of places when a @kaggle final leaderboard is revealed” @benhammer Image: https://republic.ru/images2/blog_photo_18/2013_06_10/listalka/rastyagivanie.jpg
strong intrinsic measure of performance from train-set alone – k-fold cross-validation – bagging • Possible to use public leaderboard in an intelligent way to glean information or in a weighted manner with CV score • But resist the temptation to just pick the “best” two submissions • Sidenote: the same “manual overfitting” issue applies to hyper-parameters as well, if we are not careful Image: http://img.sparknotes.com/content/sparklife/sparktalk/tightfitting_Large.jpg
beginners sometimes just start to “throw” algorithms at a problem without first getting to know the data. I also think that beginners sometimes also go too-complex-too-soon” – Steve Donoho • Start with a simple baseline • Usually “logistic regression” or “random forest” will get you very far. And even “random forest” is far from “simple” • Complex algorithms often run much slower, reducing speed of learning iterations • More model parameter means more risk of overfitting, and more arduous parameter- tweaking Image: http://www.jeffbullas.com/wp-content/uploads/2013/07/The-Power-of-Simple-Writing.jpg
the last 10 competitions, model combination and ensembling was a key part of the final submission” • Improves accuracy at the cost of explanatory value and performance • Do it as a last step • Works best if the models are less correlated and of reasonably high quality; ideally ensemble different algorithmic approaches • Another opportunity for overfitting; what data to train/test them on? • Needs to be use in a disciplined, well-founded manner, not just ad-hoc • Methods: – naive weighting – bagging – AdaBoost – random forest already an ensemble Image: https://pbs.twimg.com/profile_images/3536053177/89a7cf7df33fea05522399484b7b28f9_400x400.jpeg
be predicting – correct derived variable – correct loss function • Metric/loss function often given on Kaggle – AUC – Gini – MSE, MAE • Understand what metric underlies your favorite algorithms • But also more subtle understanding of the independent and dependent variables • How to translate the outcome formulation into the correct derived variable; in the face of inconsistent and noisy data Image: https://theosophywatch.files.wordpress.com/2012/09/seeing-the-future1.jpg?w=500
on the leaderboard • Understand the subtleties of different algorithms; prefer an algorithm you understand over a shiny new one • Perform feature selection (i.e. random forest), and plug the features back into your “favorite” tool. (redundant variables, some collinearity) • Imputation of missing data (i.e. using clustering) • “Think more, try less” • Choose the right tool for the right job (Excel, SQL, R, Spark, etc.) Image: http://static.zoonar.com/img/www_repository5/f1/09/f1/8_42d970eeb4f447d441415716a2c7b439.jpg