Data visualization is an increasingly popular way to communicate ideas and tell a story with data. We're going to examine the process of design and visualization from start to finish, beginning with how to examine a data set and ending with tools and best practices for achieving a balance between form and function.
Insights from:
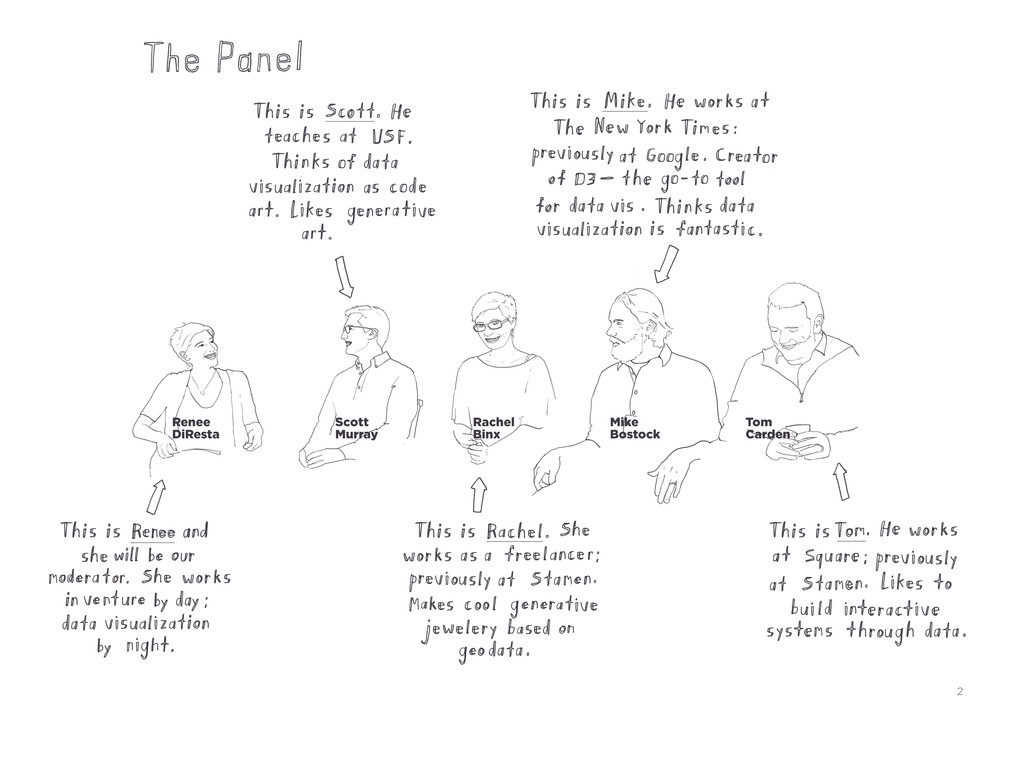
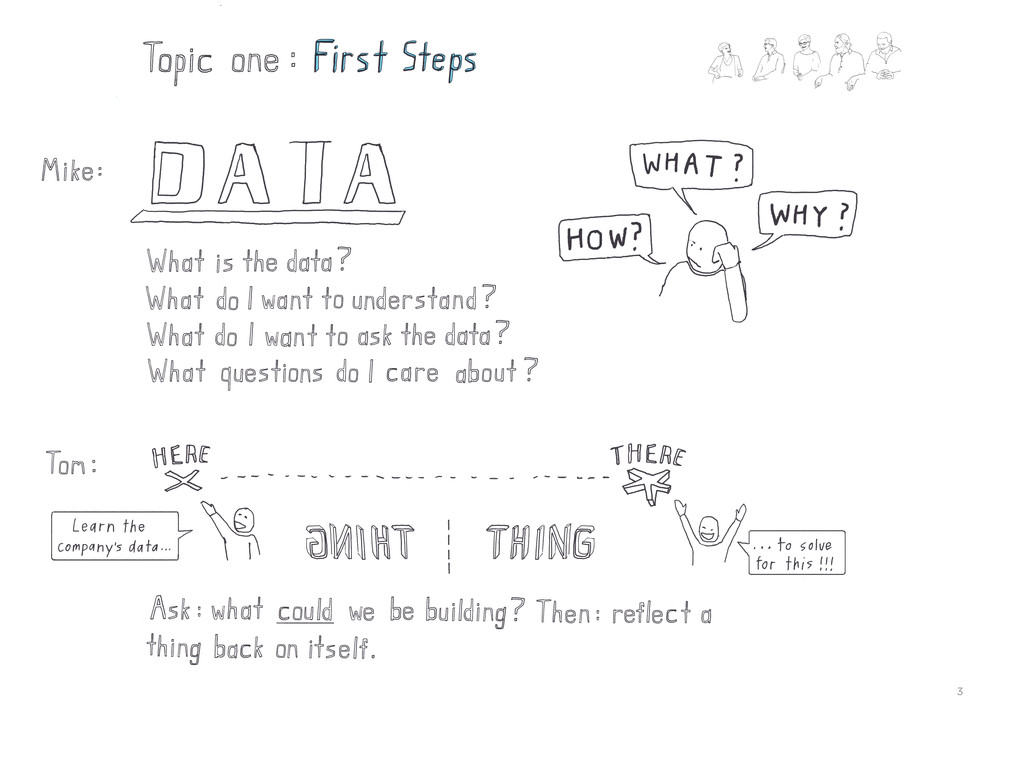
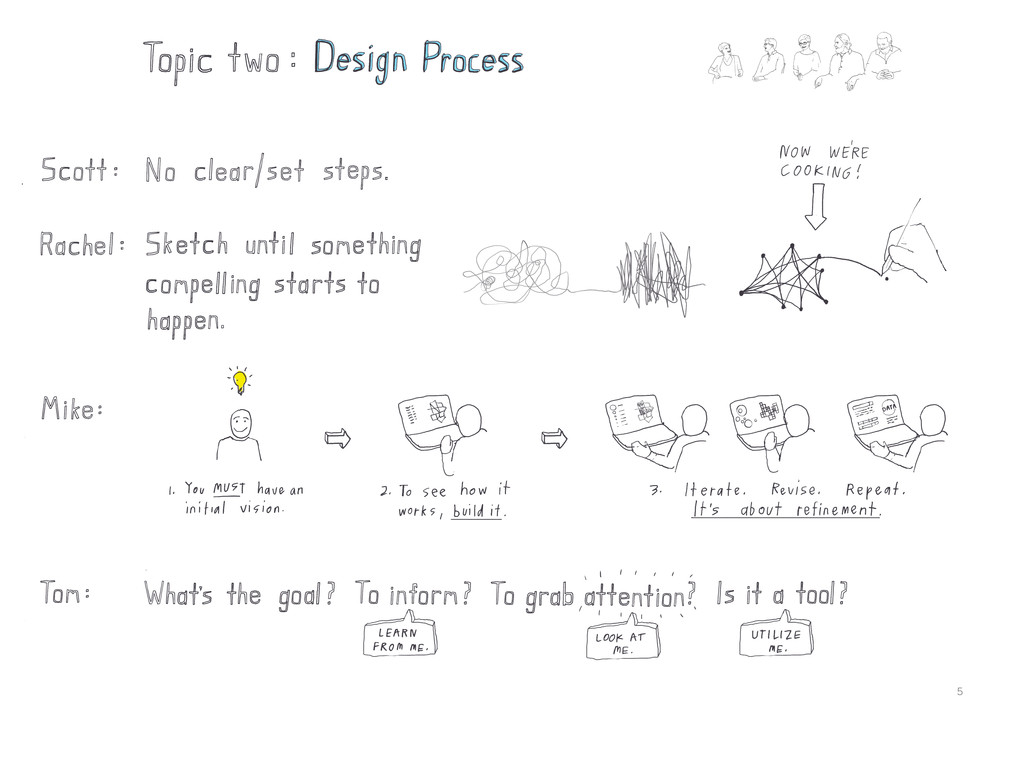
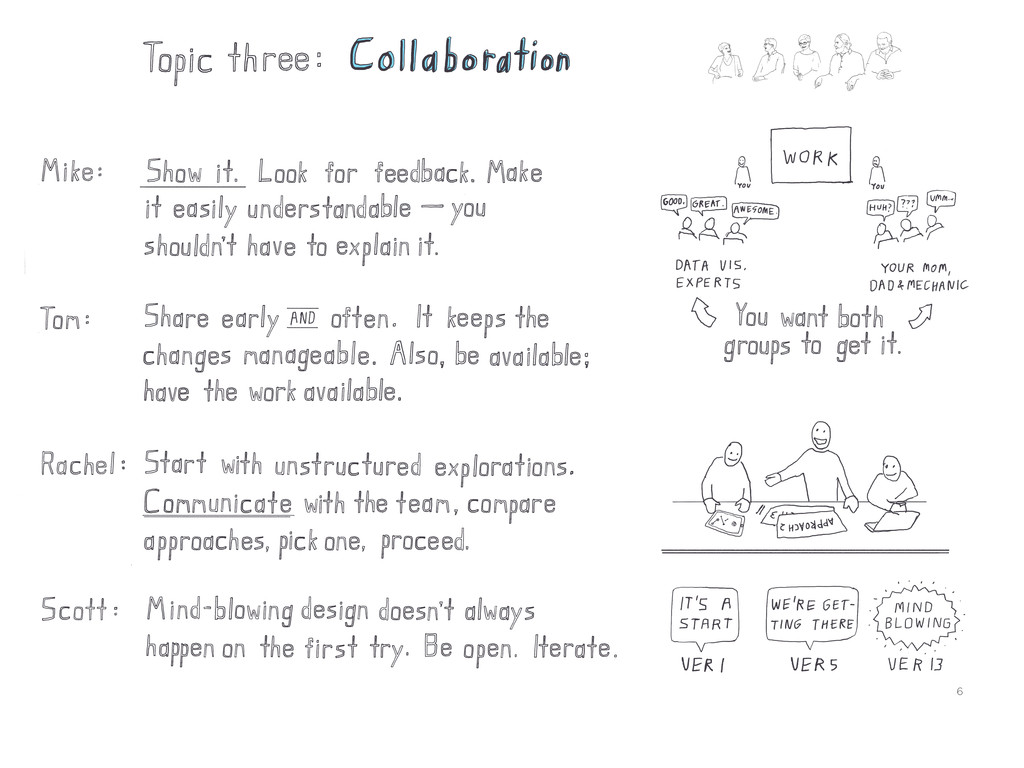
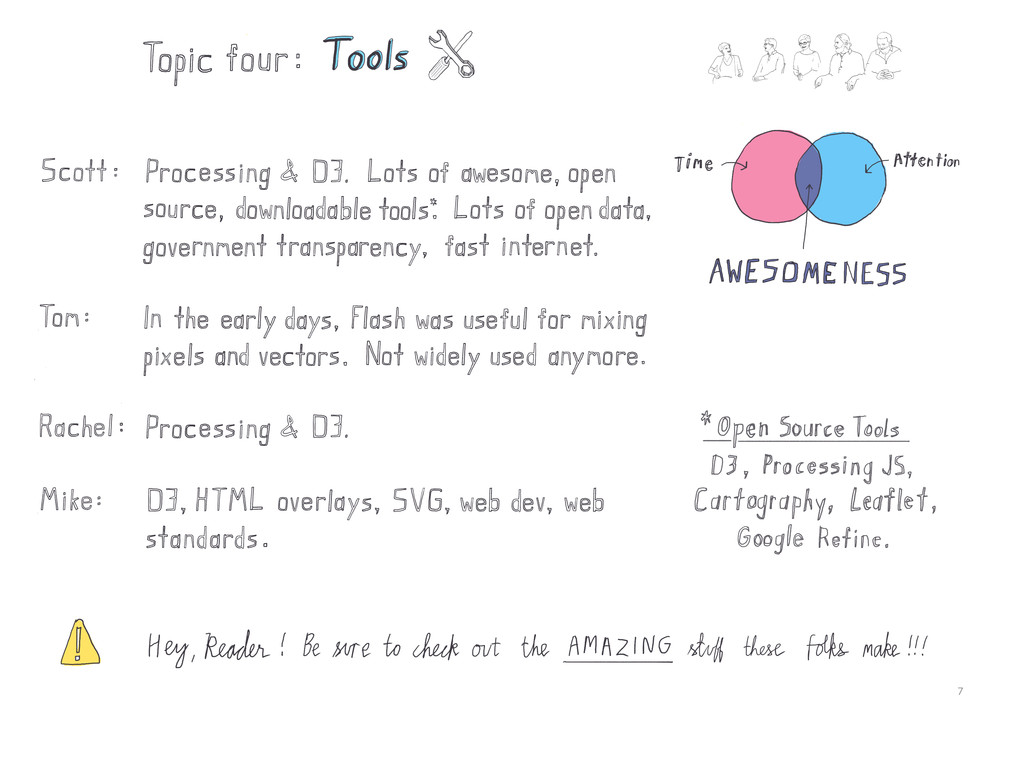
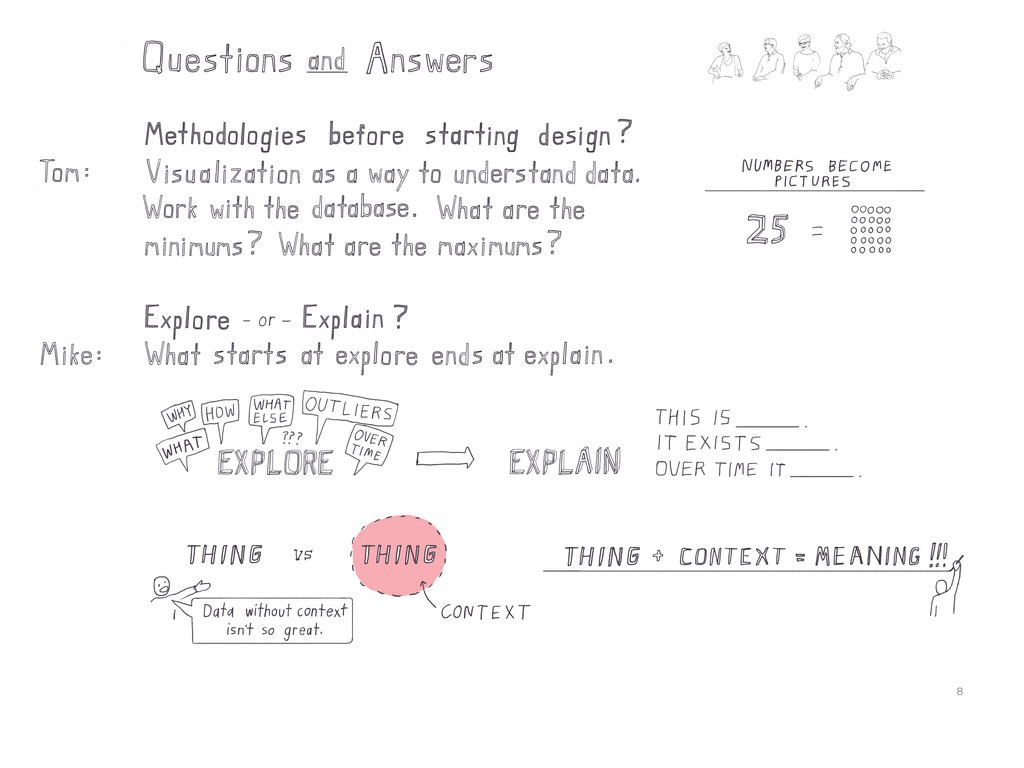
Mike Bostock, Graphics Editor at The New York Times
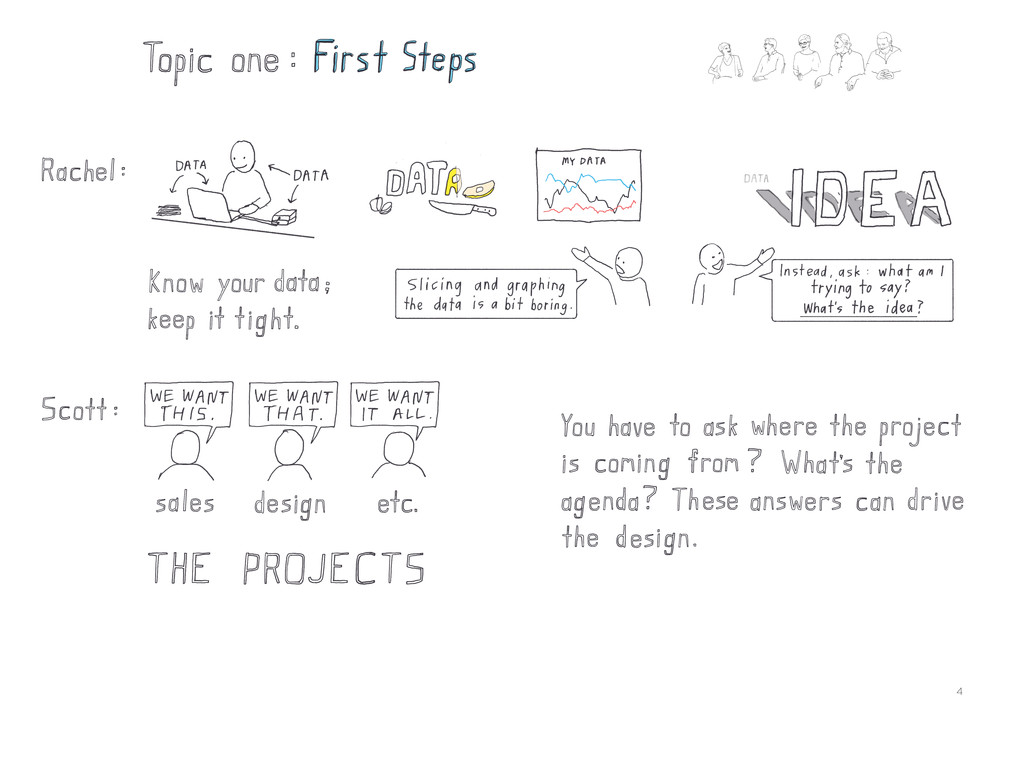
Rachel Binx, Data Visualizer
Tom Carden, Data Visualization Engineer at Square
Scott Murray, Code Artist and Assistant Professor of Design at USF
Renee DiResta, Associate at O'Reilly AlphaTech Ventures (Moderator)