Fun with D3.js & PubNub: Data Visualization Eye...

Fun with D3.js & PubNub: Data Visualization Eye Candy with Streaming JSON
D3.js is a JavaScript library that lets you bring data to create interactive graphs and charts that run on a browser. It is a very powerful tool for creating eye-catching data visualization.
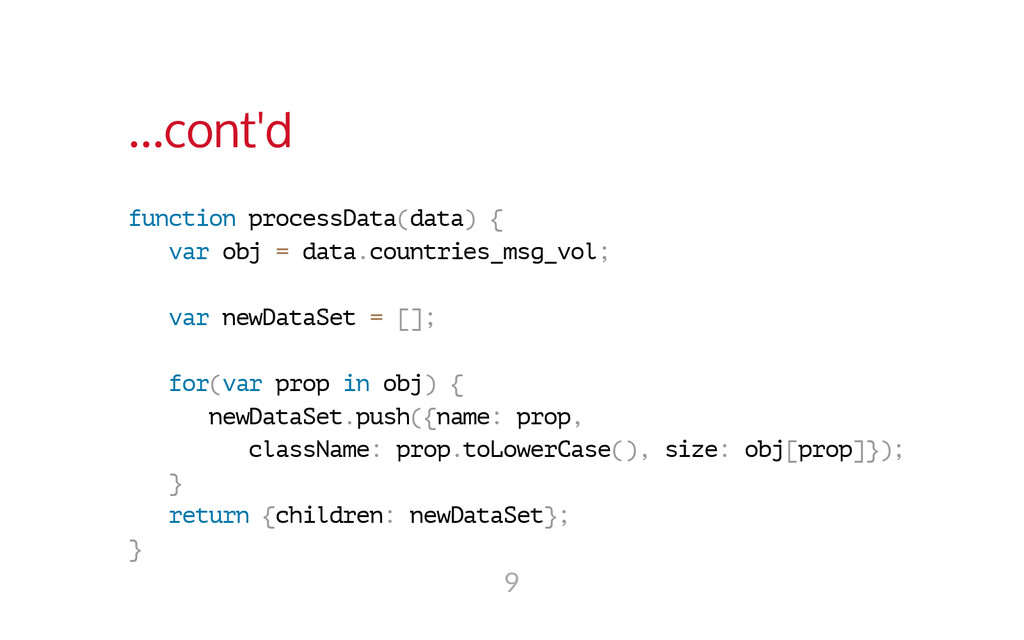
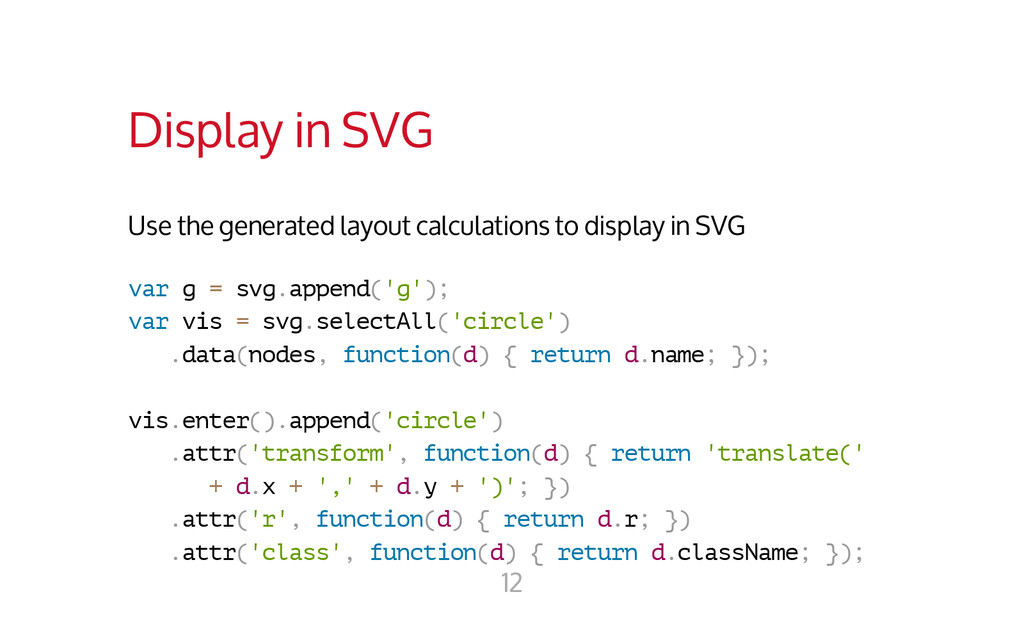
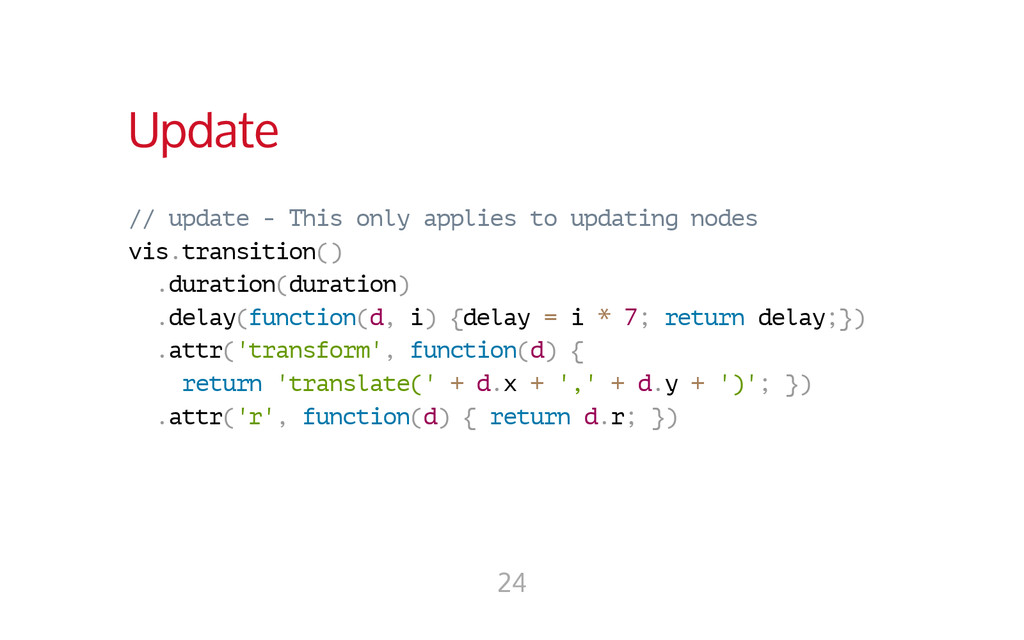
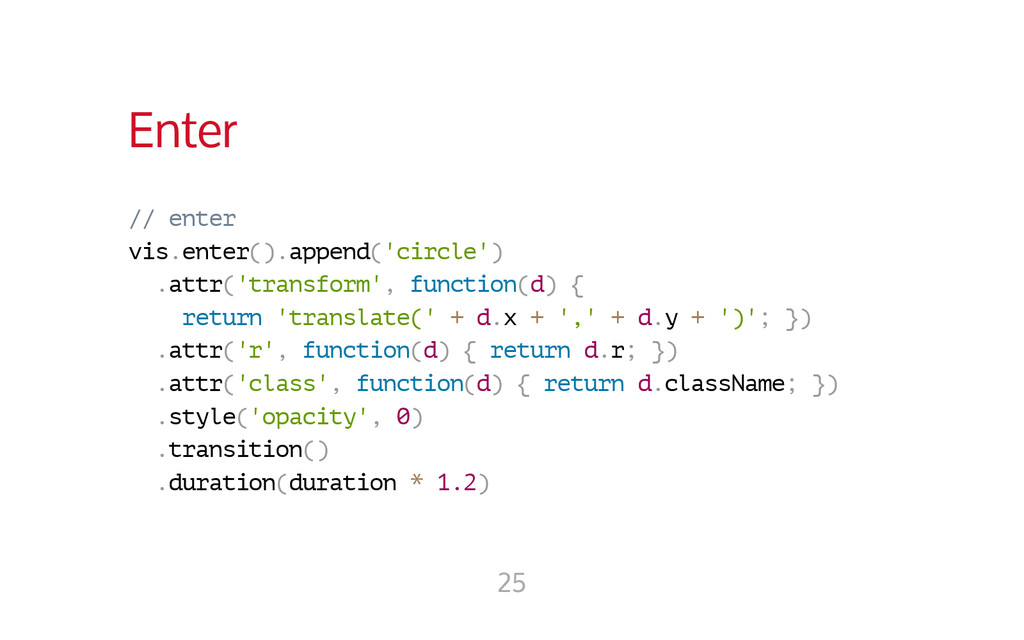
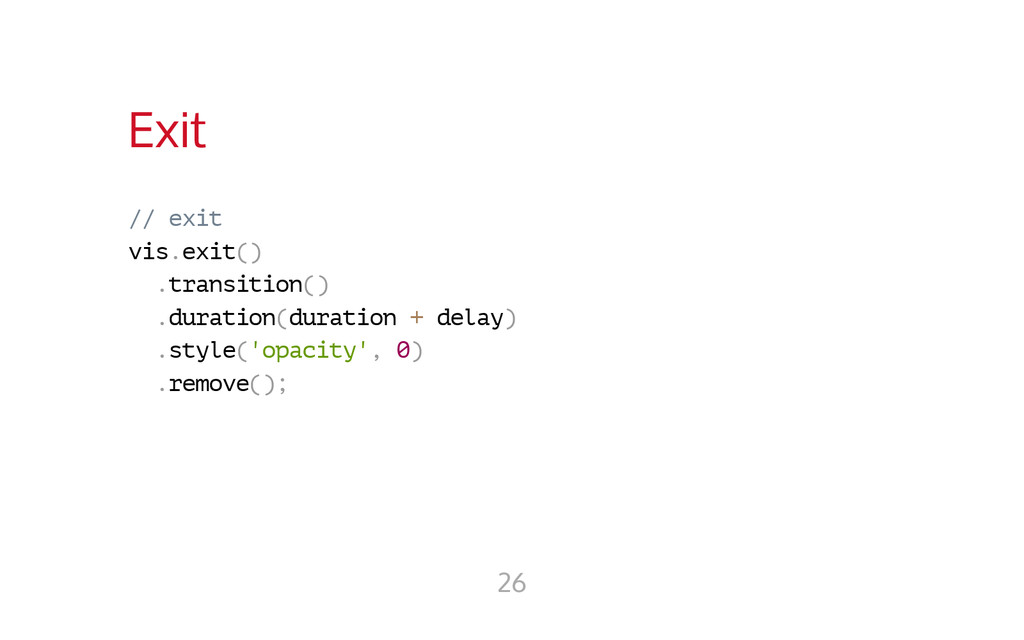
This slide deck is a quick showcase of what can be done with D3 and PubNub data stream. Let's get visual with a bubble chart!
Full tutorial:
http://www.pubnub.com/blog/fun-with-d3js-data-visualization-eye-candy-with-streaming-json/

Tomomi Imura
October 07, 2014
 girlie_mac
 ama_ch
 henryofficial
 shift_evolve
 masspeaks
 tsho
 sioncojp
 ryudai
 ayaka_egaaa
 tkazuaki0820
 amixedcolor
 inariku
 daishukojima
 iamctodd
 aleyda
 sugarenia
 baasie
 skipperchong
 katarinadahlin
 tammyeverts
 chriscoyier
 gurzu
 chrislema
 marketingsoph