published in 1988! ! ! Currently 5 statistical consultants on the editorial board ! Guidelines developed based on experience of all consultants to make clear expectations to those submitting research, and highlight common errors _____________________________________________ [1] Guidelines for data reporting and nomenclature for The Annals of Thoracic Surgery. Ann Thorac Surg 1988;46:260–1. 0.0 5.0 10.0 15.0 20.0 25.0 30.0 2005 2006 2007 2008 2009 2010 2011 2012 2013 2014 2015 (Jan-June) Approximately 1 in 4 manuscripts submitted to EJCTS are referred for statistical review % of submitted manuscripts statistically reviewed
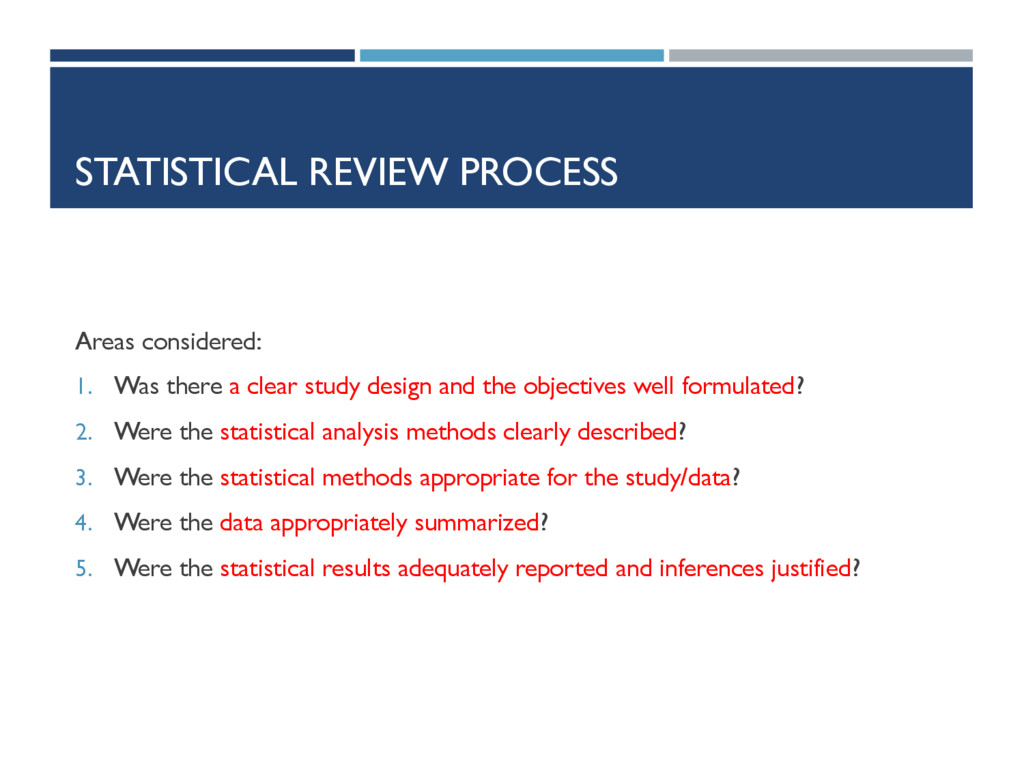
study design and the objectives well formulated? 2. Were the statistical analysis methods clearly described? 3. Were the statistical methods appropriate for the study/data? 4. Were the data appropriately summarized? 5. Were the statistical results adequately reported and inferences justified?
type of study ! Data acquisition methods (incl. post-discharge follow-up) ! Inclusion and exclusion criteria ! Sample size rationale – calculations should be reproducible ! Randomization and blinding (if relevant) ! Potential sources of bias ! statistical adjustment methods used
‘(Peri-)operative mortality’ – in-hospital or 30-day? ! Time origin for time-to-event variables – surgery, randomisation, discharge, etc.? ! All-cause or cause-specific mortality? ! Use accepted definitions where available ! E.g. valve [1] & TAVI [2] ! Avoid ambiguous or undefined study variables ! E.g. ‘normal’ vs. ‘abnormal’ white cell count _____________________________________________ [1] Akins CW, et al. Guidelines for reporting mortality and morbidity after cardiac valve interventions. Eur J Cardiothorac Surg 2008;33: 523–8. [2] Kappetein AP, et al. Updated standardized endpoint definitions for transcatheter aortic valve implantation: the Valve Academic Research Consortium-2 consensus document (VARC-2). Eur J Cardiothorac Surg 2012;42:S45–60.
methods used, and when they were used ! Additional information request for advanced statistical methods ! Handling of missing data ! Phrasing and terminology, e.g. incidence vs. prevalence or multivariate vs. multivariable
adjustment covariates ! Univariable screening ! Stepwise regression methods (details of algorithm required) ! Covariates forced into model ! All covariates included ! Consideration to over-fitting and stability? ! Functional form of continuous covariates (e.g. transformations, dichotomization)
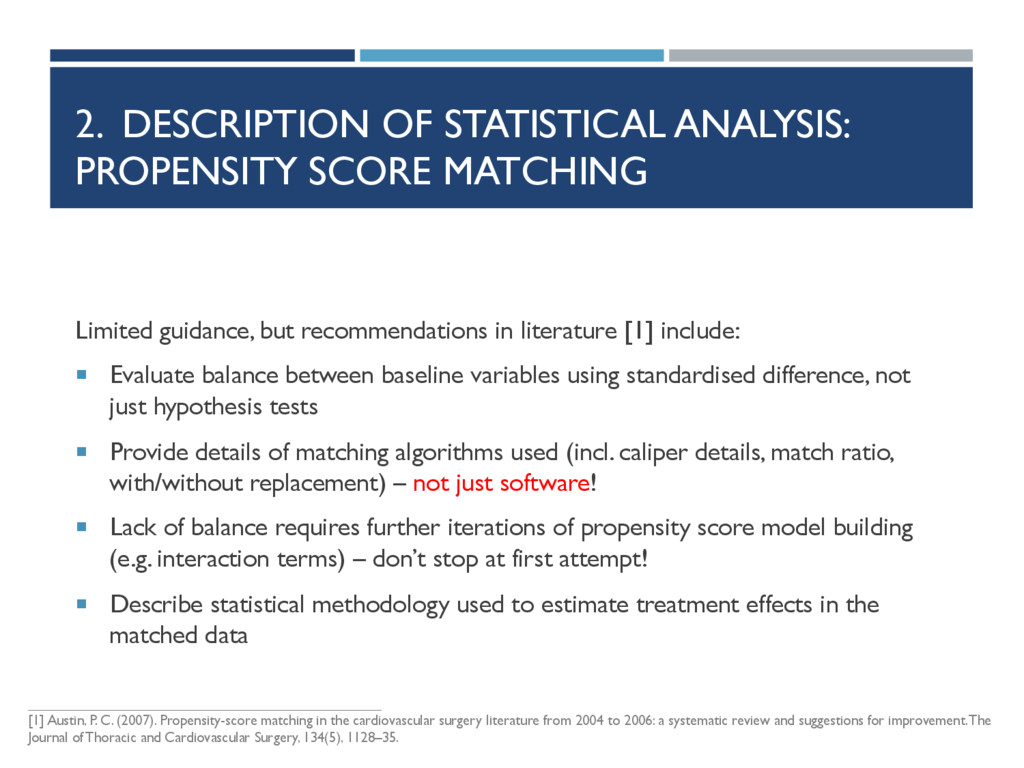
but recommendations in literature [1] include: ! Evaluate balance between baseline variables using standardised difference, not just hypothesis tests ! Provide details of matching algorithms used (incl. caliper details, match ratio, with/without replacement) – not just software! ! Lack of balance requires further iterations of propensity score model building (e.g. interaction terms) – don’t stop at first attempt! ! Describe statistical methodology used to estimate treatment effects in the matched data _____________________________________________ [1] Austin, P. C. (2007). Propensity-score matching in the cardiovascular surgery literature from 2004 to 2006: a systematic review and suggestions for improvement. The Journal of Thoracic and Cardiovascular Surgery, 134(5), 1128–35.
and if necessary be assessed using suitable diagnostics and goodness-of-fit tests ! E.g. Proportional hazards assumption for Cox regression models ! Correct statistical model / methodology for data ! E.g. using logistic regression when a Cox model should have been used ! E.g. independent samples test for paired data ! Multivariable models should have an adequate event-per-variable ratio ! E.g. fitting a logistic regression model with 7 covariates to data with 20 events and 1000 subjects using maximum likelihood would be inappropriate
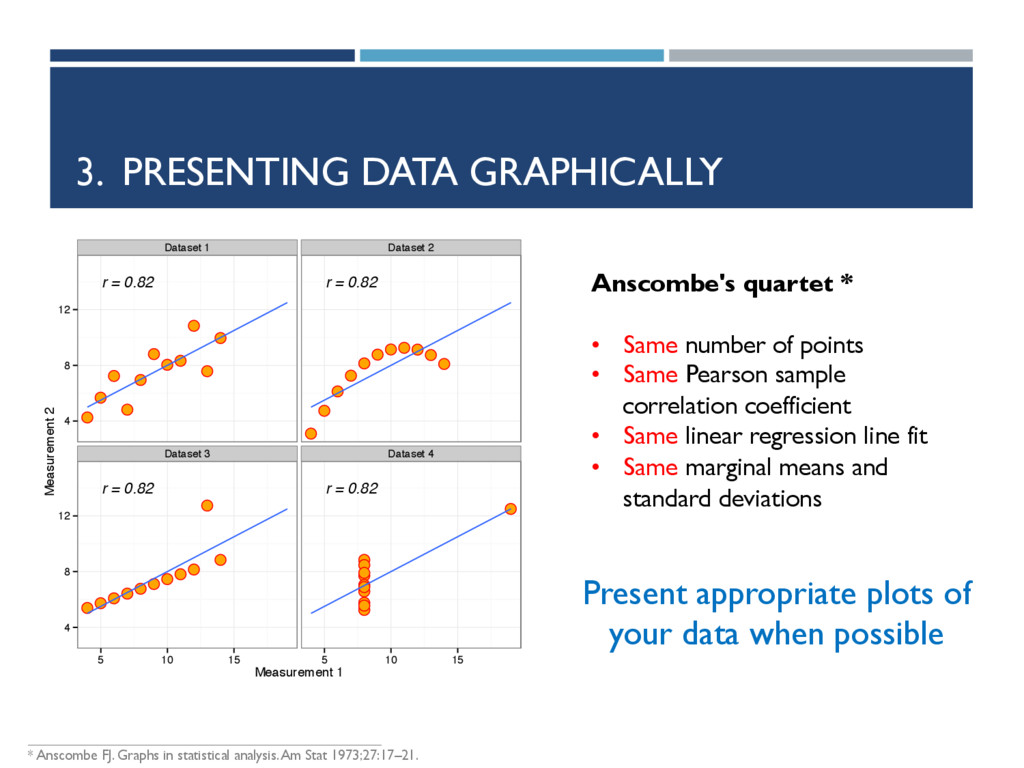
• • • • • r = 0.82 • • • • • • • • • • • r = 0.82 • • • • • • • • • • • r = 0.82 • • • • • • • • • • • r = 0.82 Dataset 1 Dataset 2 Dataset 3 Dataset 4 4 8 12 4 8 12 5 10 15 5 10 15 Measurement 1 Measurement 2 Anscombe's quartet * • Same number of points • Same Pearson sample correlation coefficient • Same linear regression line fit • Same marginal means and standard deviations Present appropriate plots of your data when possible _____________________________________________ * Anscombe FJ. Graphs in statistical analysis. Am Stat 1973;27:17–21.
stratified by treatment groups if a comparison study ! Location statistics (e.g. mean, median) should always be reported with appropriate measure of variability (e.g. median, IQR) ! Always report what summary statistics are reported ! “average age was 65 years (41-79) years” – is it mean and range, median and (1st, 3rd) quartiles?
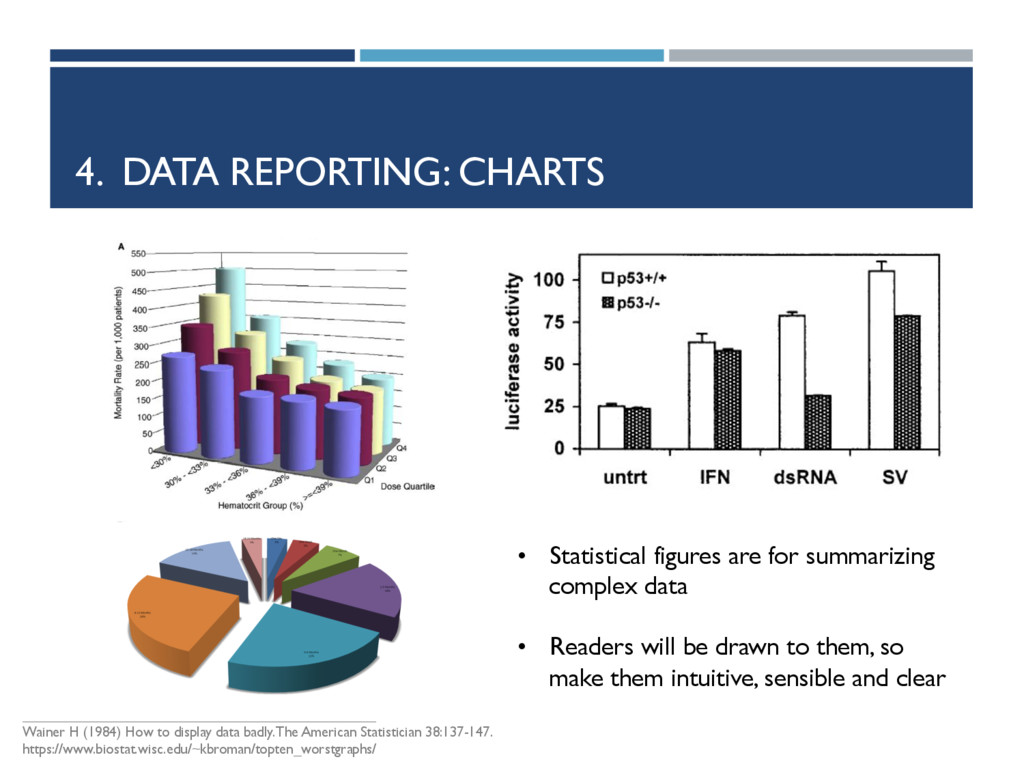
display data badly. The American Statistician 38:137-147. https://www.biostat.wisc.edu/~kbroman/topten_worstgraphs/ • Statistical figures are for summarizing complex data • Readers will be drawn to them, so make them intuitive, sensible and clear
and confidence intervals ! Full regression models should be reported – not just significant terms ! Details of any deviations from the planned study ! P-values and statistics reported to appropriate precision
≠ probability null hypothesis is true ! Absence of evidence ≠ evidence of absence, e.g. P=0.60 only tells us there is insufficient evidence for an effect, which might be due to: ! No effect being present ! Large variability ! Insufficient information in the data due to small sample size ! Statistical significance ≠ clinical significance ! Study weaknesses should go beyond commenting on the sample size and observational data
inform authors on what statistical reviewers are looking for ! A well analyzed study allows reviewers to focus on what is important—the science! ! It is advised that a biostatistician be involved in the analysis ! Correct and well-reported (and correct) statistical analysis essential to getting your paper published!
Editor) Judy Gaillard (Managing Editor) Franziska Lueder (Editorial Manager) Assistant Editors (Statistical Consultants) Burkhardt Seifert Gottfried Sodeck Matthew J. Carr Hans Ulrich Burger Graeme L. Hickey + all other editorial members
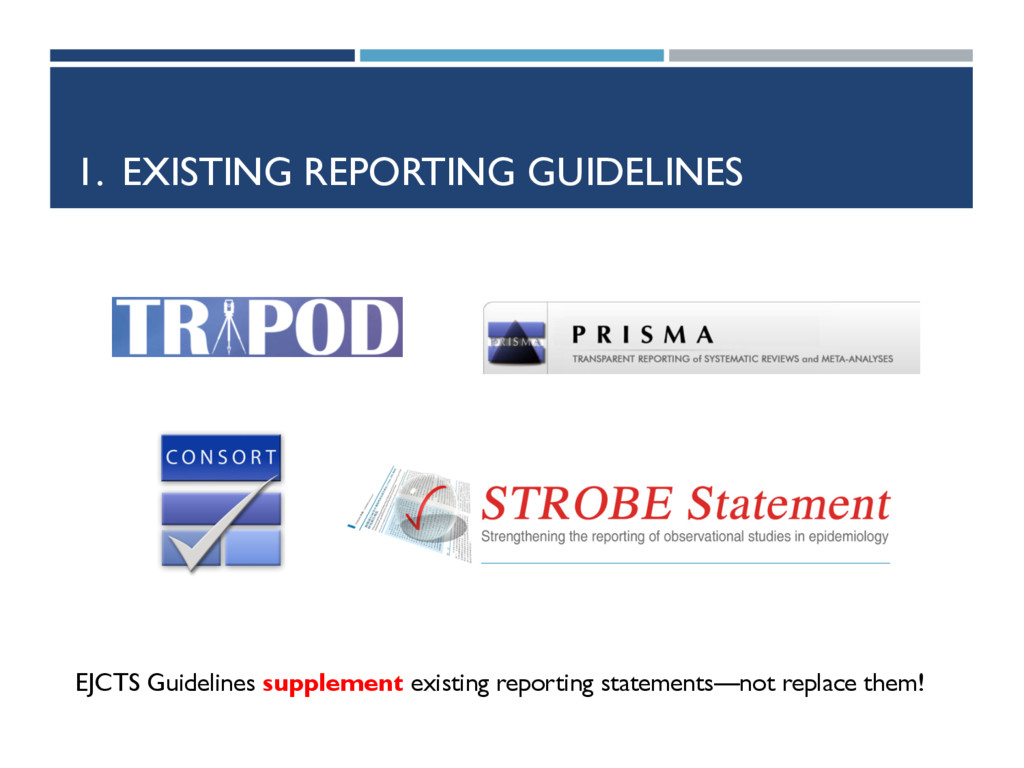
![SUMMARY ! Existing recommended guidelines [1] for data reporting were](https://files.speakerdeck.com/presentations/84a783fe033d4b4fa260912453f92a28/slide_3.jpg)