Upgrade to Pro
— share decks privately, control downloads, hide ads and more …
Speaker Deck
Features
Speaker Deck
PRO
Sign in
Sign up for free
Search
Search
Grafana datasource plugin
Search
gree_tech
PRO
May 24, 2016
Technology
390
0
Share
Embed
Copy iframe code
Copy JS code
Copy link
Start on current slide
Grafana datasource plugin
gree_tech
PRO
May 24, 2016
More Decks by gree_tech
See All by gree_tech
我々はどう生きるか
gree_tech
PRO
0
4
変わるもの、変わらないもの :OSSアーキテクチャで実現する持続可能なシステム
gree_tech
PRO
0
5.1k
マネジメントに役立つ Google Cloud
gree_tech
PRO
0
72
今この時代に技術とどう向き合うべきか
gree_tech
PRO
3
2.8k
生成AIを開発組織にインストールするために: REALITYにおけるガバナンス・技術・文化へのアプローチ
gree_tech
PRO
0
470
安く・手軽に・現場発 既存資産を生かすSlack×AI検索Botの作り方
gree_tech
PRO
0
470
生成AIを安心して活用するために──「情報セキュリティガイドライン」策定とポイント
gree_tech
PRO
1
2.4k
あうもんと学ぶGenAIOps
gree_tech
PRO
0
590
MVP開発における生成AIの活用と導入事例
gree_tech
PRO
0
620
Other Decks in Technology
See All in Technology
それでも、技術なブログを書く理由 #kichijojipm / Why I Still Write Tech Blogs Even Now
shinkufencer
0
1.4k
基調講演:人とAIをつなぐIoTの今と未来 ー 「フィジカル」と「デジタル」が出会うその先へ【SORACOM Discovery 2026】
soracom
PRO
0
360
AI工学特論: MLOps・継続的評価
asei
11
3.1k
『モンスターストライク』 の運営に伴走する! データ民主化への 解析グループの3つのアプローチ
mixi_engineers
PRO
0
180
オートマトンと字句解析でRoslynを読む
tomokusaba
0
130
検索技術知識0のエンジニアが広告検索システムを内製化して運用するまで
lycorptech_jp
PRO
0
170
A Bag-of-Documents Model for Query Specificity
dtunkelang
0
180
実践が先生だった— 新卒サーバーエンジニア1年目のリアル
mixi_engineers
PRO
0
210
AIエージェントの知識表現と推論に なぜグラフが使われるのか - 記号的AIの復権とニューラルAIとの統合
yohei1126
1
230
「休む」重要さ
smt7174
7
1.8k
1台から試せる!Edge IoTを使った位置情報の活用設計【SORACOM Discovery 2026】
soracom
PRO
0
110
MCPをつなげて作る組織横断のAIエージェント基盤
tsubakimoto_s
0
430
Featured
See All Featured
Embracing the Ebb and Flow
colly
88
5.1k
Google's AI Overviews - The New Search
badams
0
1.1k
How to optimise 3,500 product descriptions for ecommerce in one day using ChatGPT
katarinadahlin
PRO
1
3.7k
Lightning talk: Run Django tests with GitHub Actions
sabderemane
0
230
The agentic SEO stack - context over prompts
schlessera
0
860
How to audit for AI Accessibility on your Front & Back End
davetheseo
0
480
We Have a Design System, Now What?
morganepeng
55
8.2k
10 Git Anti Patterns You Should be Aware of
lemiorhan
PRO
659
62k
Making the Leap to Tech Lead
cromwellryan
135
10k
For a Future-Friendly Web
brad_frost
183
10k
Connecting the Dots Between Site Speed, User Experience & Your Business [WebExpo 2025]
tammyeverts
11
980
Highjacked: Video Game Concept Design
rkendrick25
PRO
1
420
Transcript
Grafana Datasource plugin
自己紹介 • 反田 光洋 • グリー株式会社 インフラストラクチャ部 • 2011年1月入社 •
AWSで運用しているサービスのモニタリング構築を担当
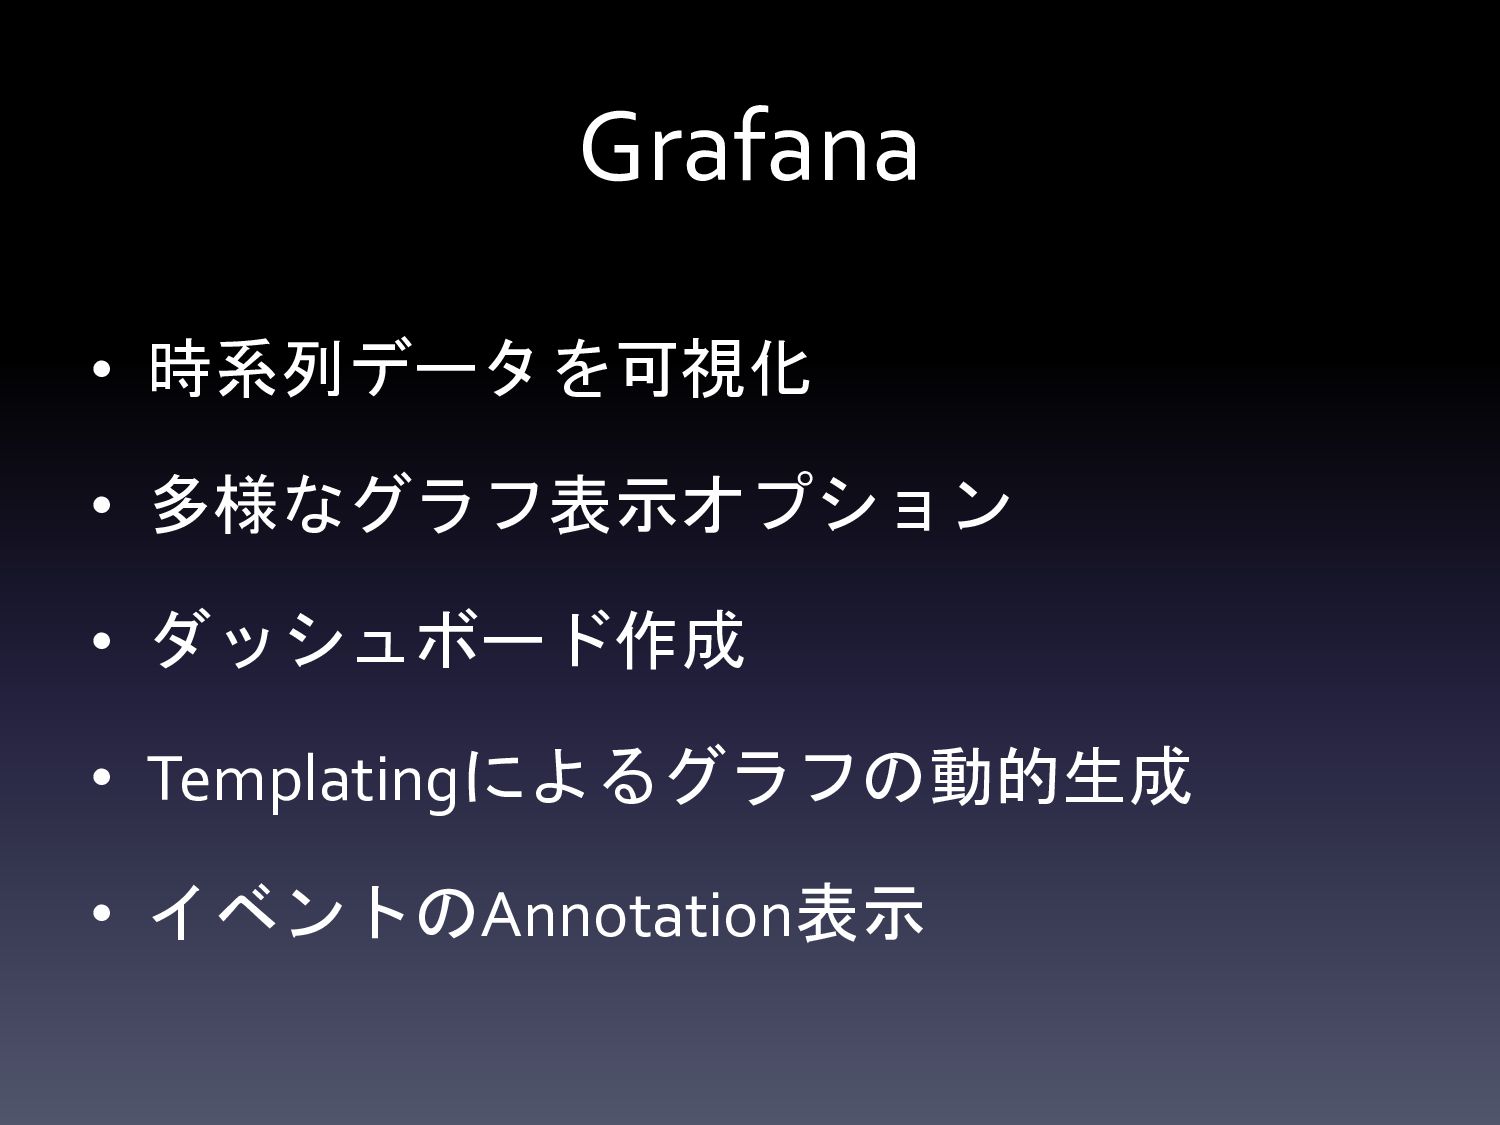
Grafana • 時系列データを可視化 • 多様なグラフ表示オプション • ダッシュボード作成 • Templatingによるグラフの動的生成 •
イベントのAnnotation表示
None
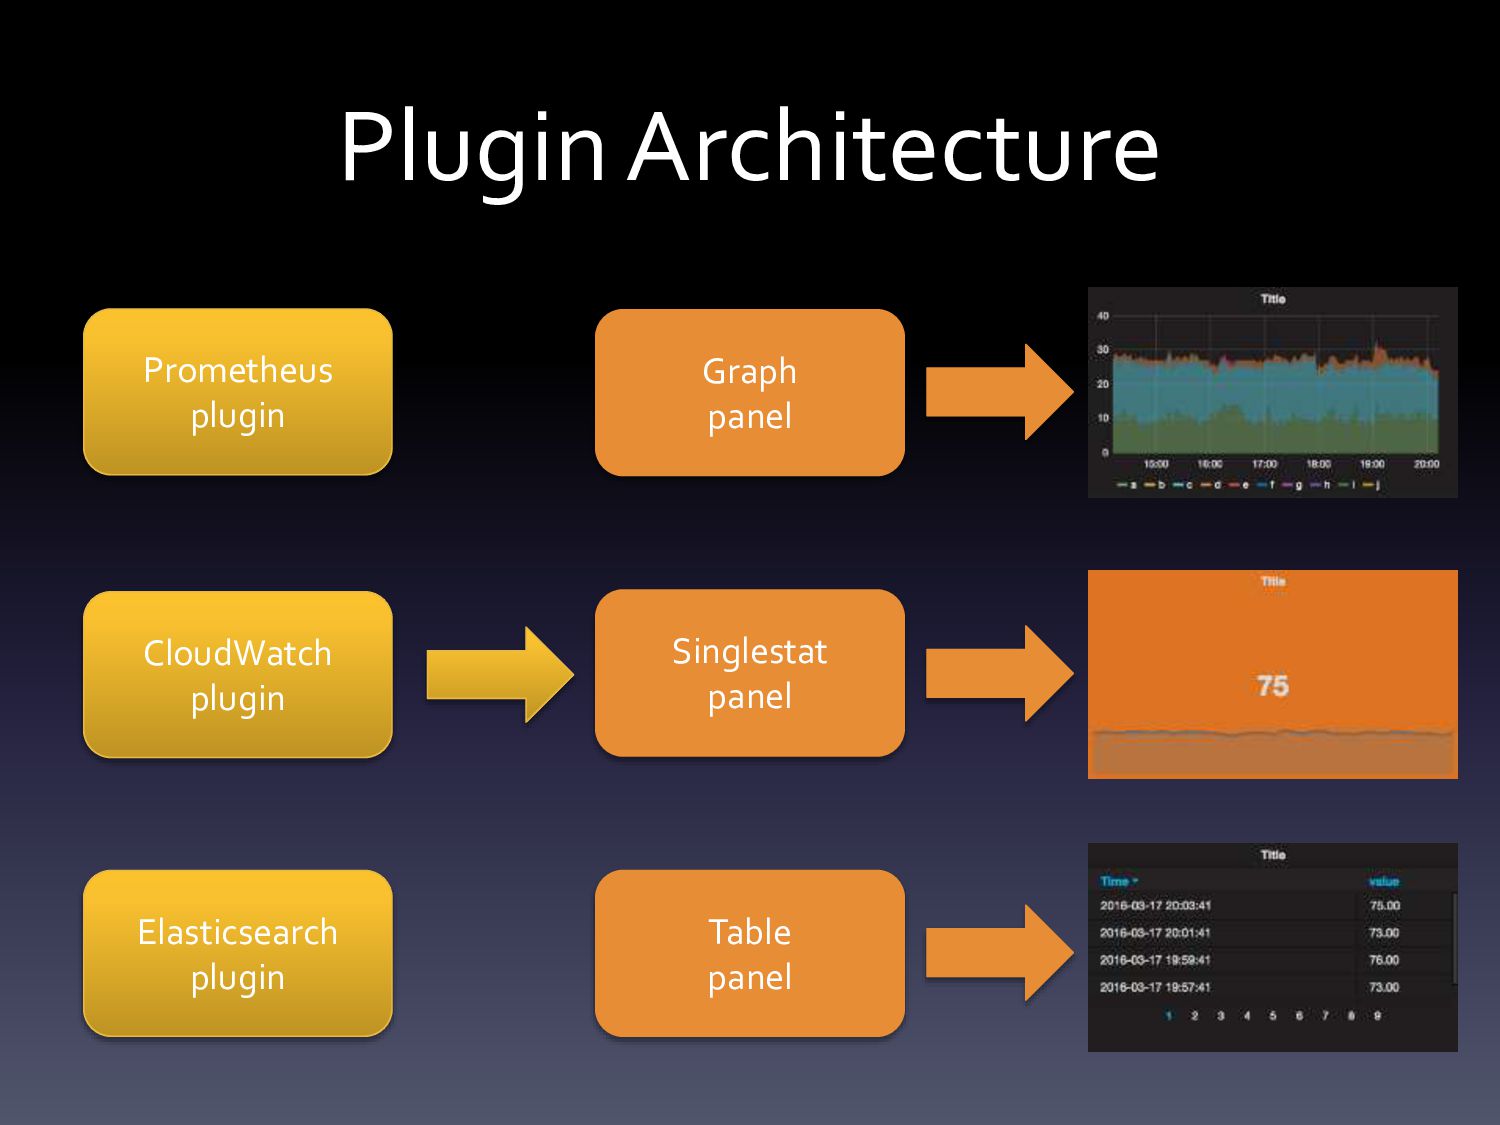
Graph panel Singlestat panel Table panel Elasticsearch plugin CloudWatch plugin
Prometheus plugin Plugin Architecture
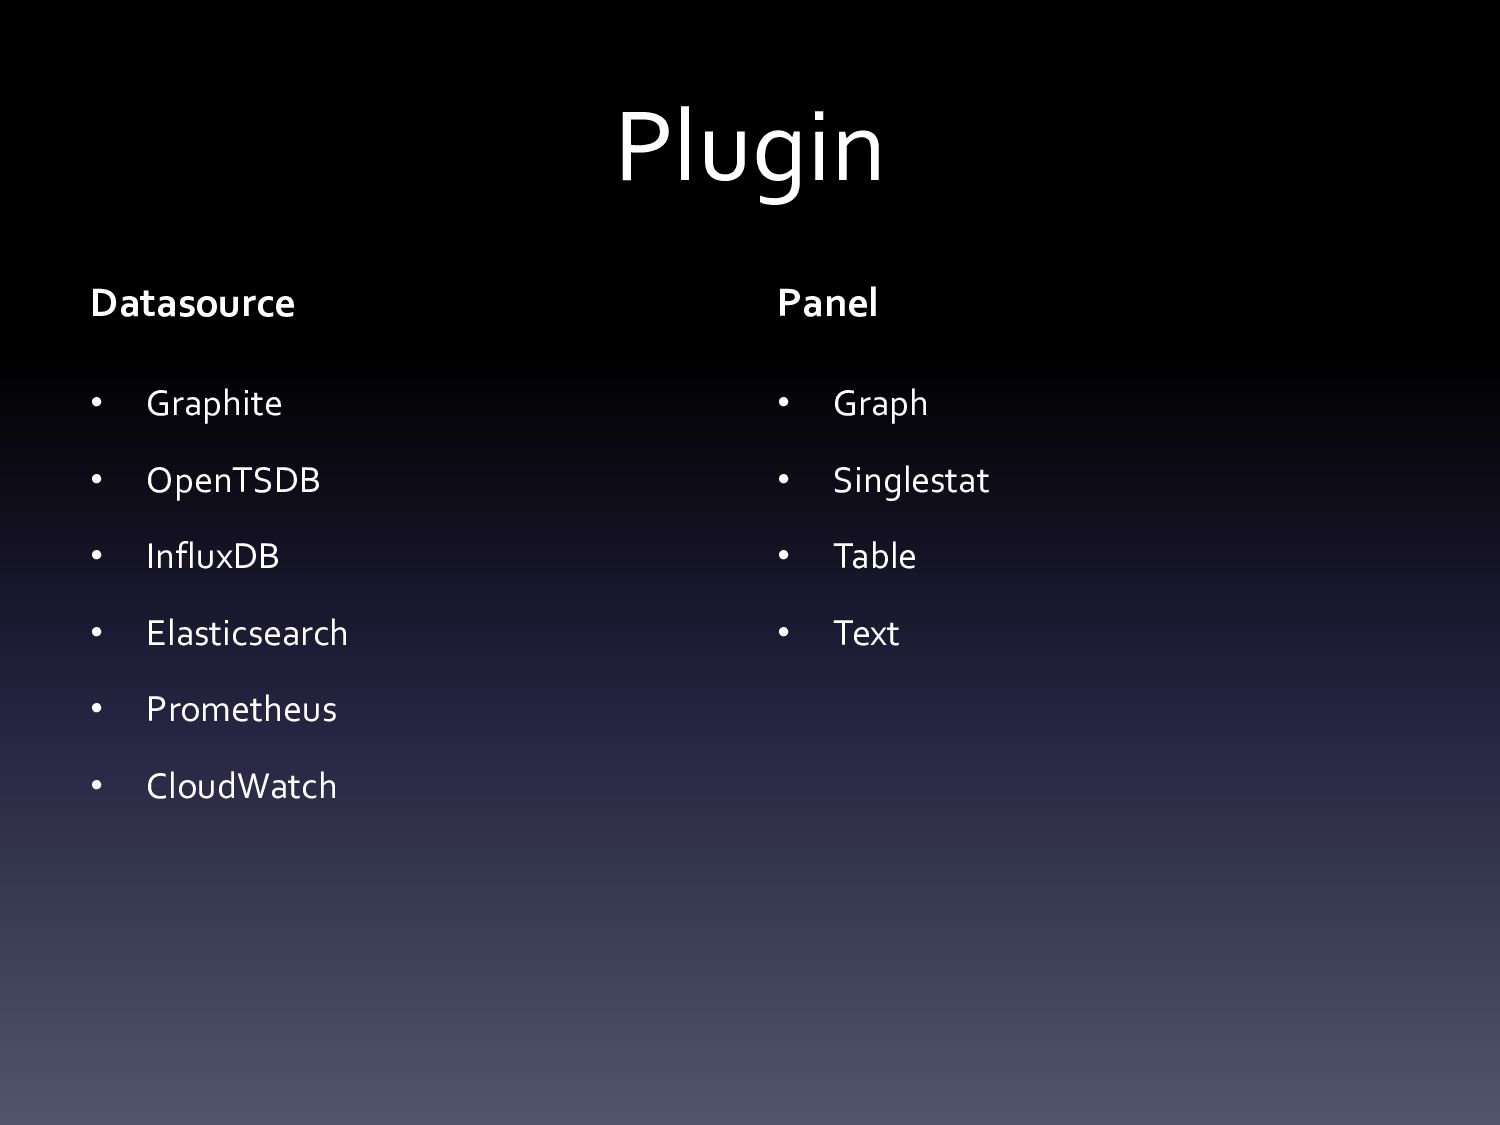
Plugin Datasource • Graphite • OpenTSDB • InfluxDB • Elasticsearch
• Prometheus • CloudWatch Panel • Graph • Singlestat • Table • Text
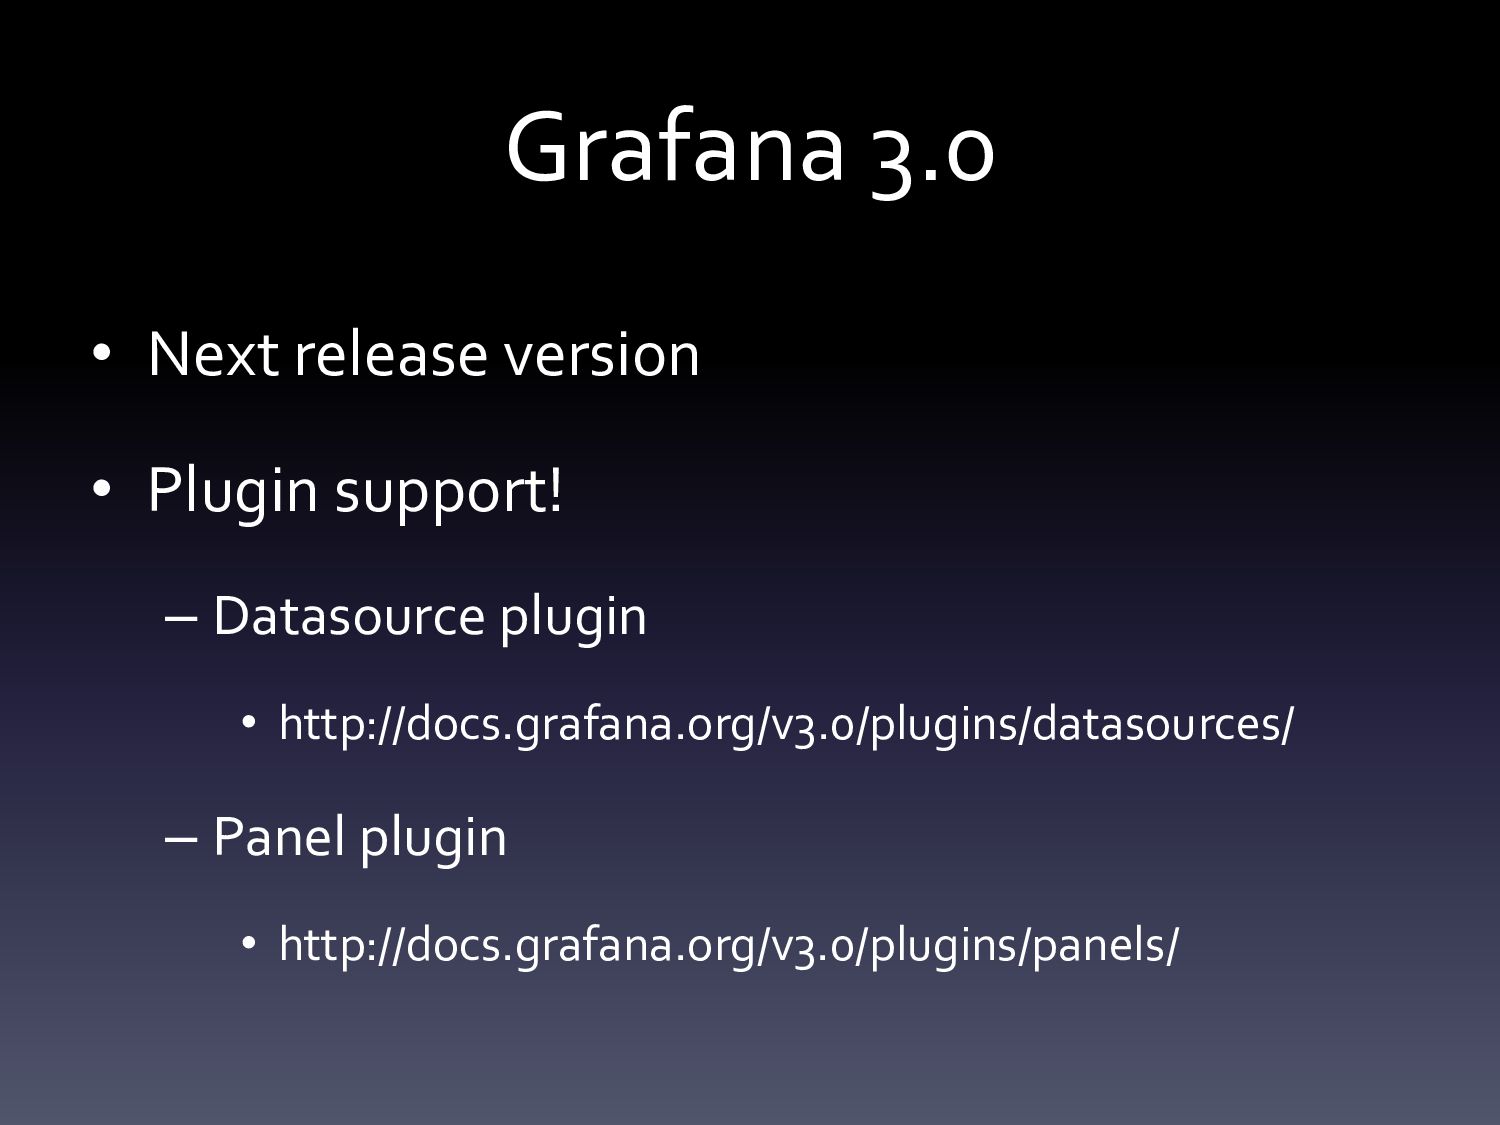
Grafana 3.0 • Next release version • Plugin support! –
Datasource plugin • http://docs.grafana.org/v3.0/plugins/datasources/ – Panel plugin • http://docs.grafana.org/v3.0/plugins/panels/
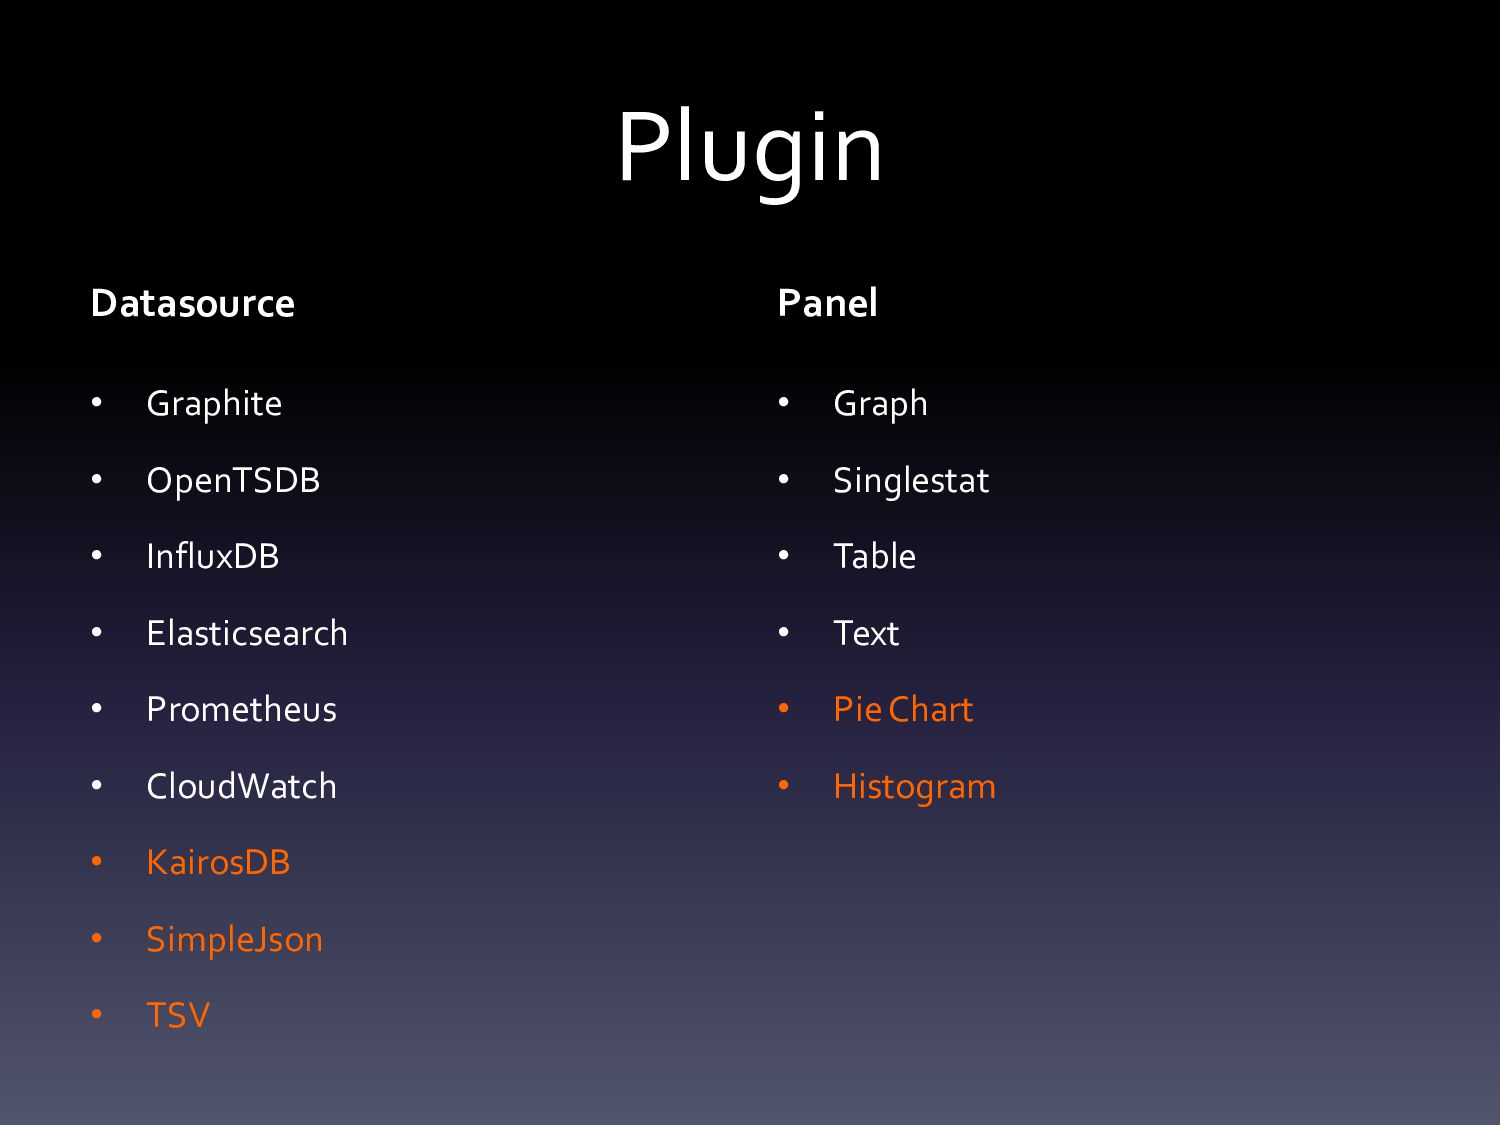
Plugin Datasource • Graphite • OpenTSDB • InfluxDB • Elasticsearch
• Prometheus • CloudWatch • KairosDB • SimpleJson • TSV Panel • Graph • Singlestat • Table • Text • Pie Chart • Histogram
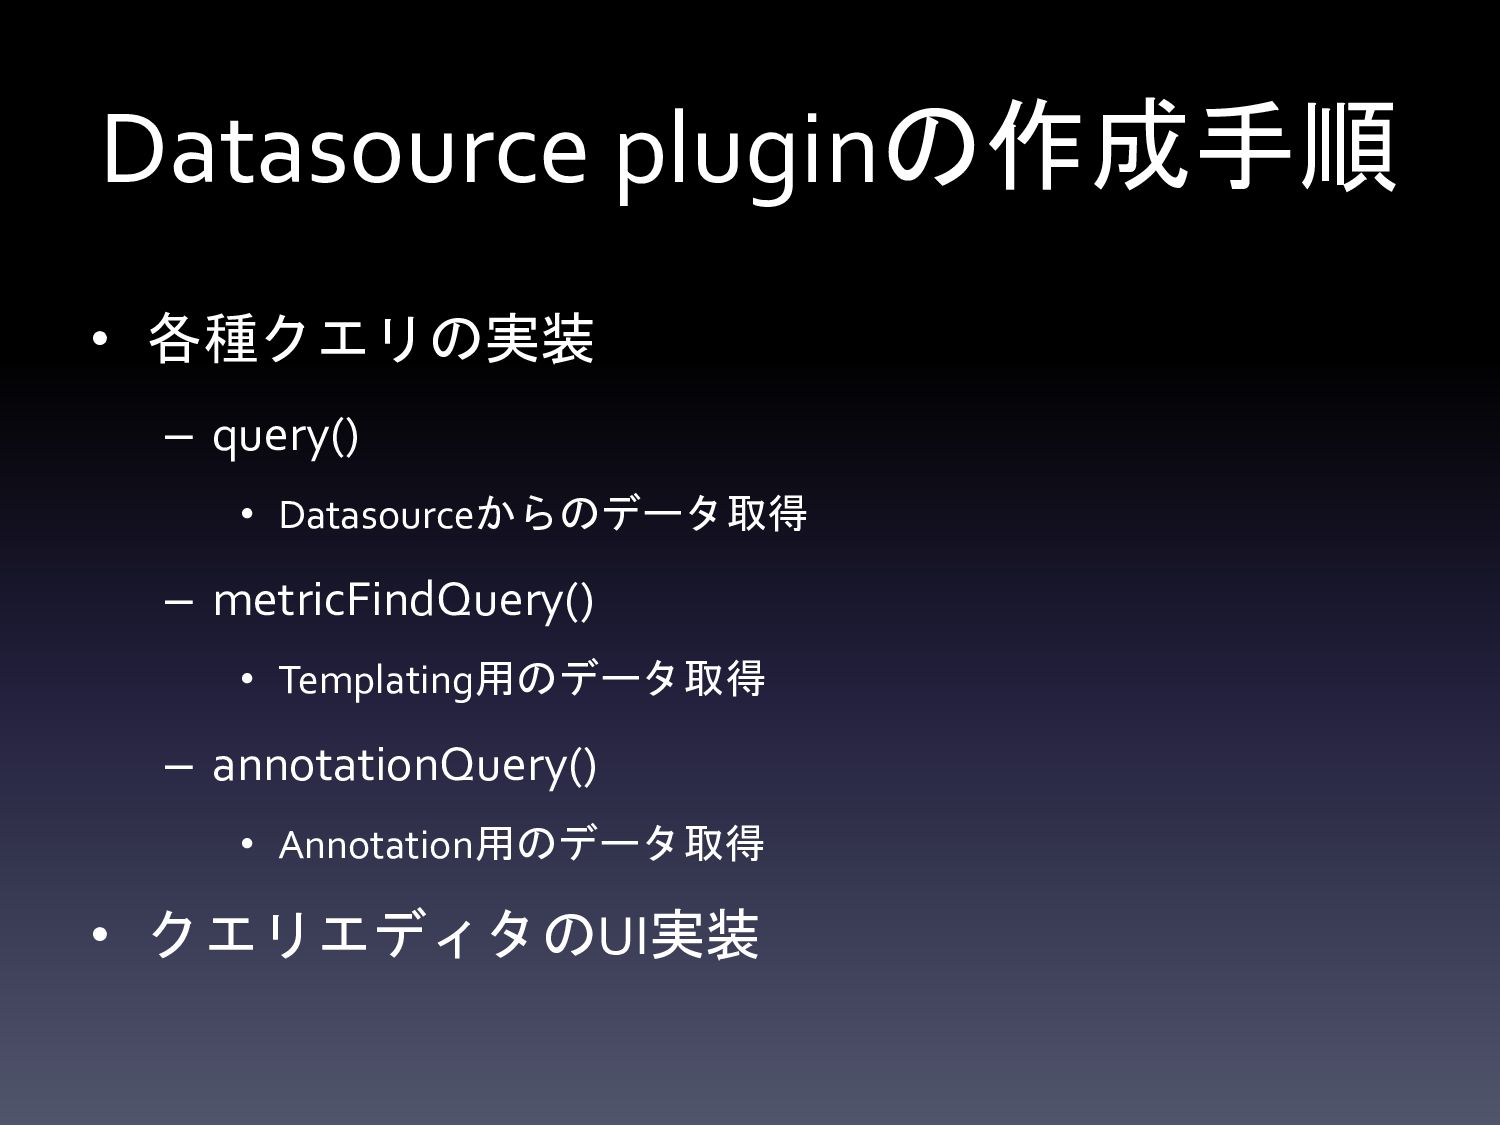
Datasource pluginの作成手順 • 各種クエリの実装 – query() • Datasourceからのデータ取得 – metricFindQuery()
• Templating用のデータ取得 – annotationQuery() • Annotation用のデータ取得 • クエリエディタのUI実装
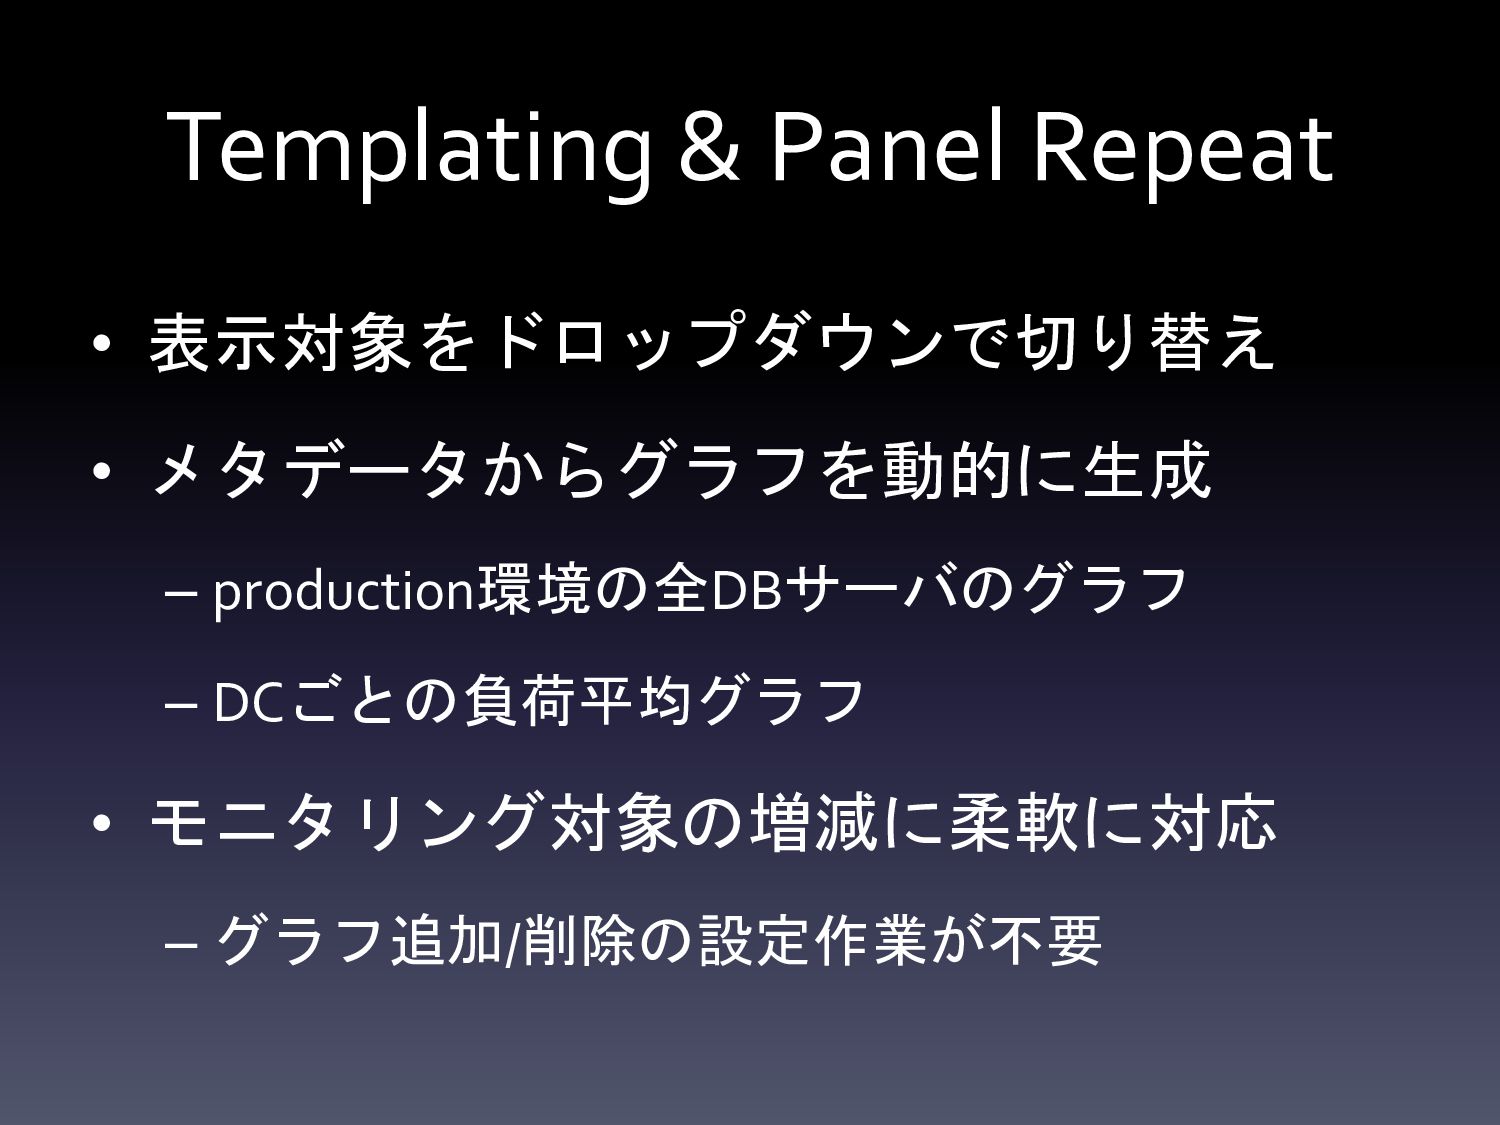
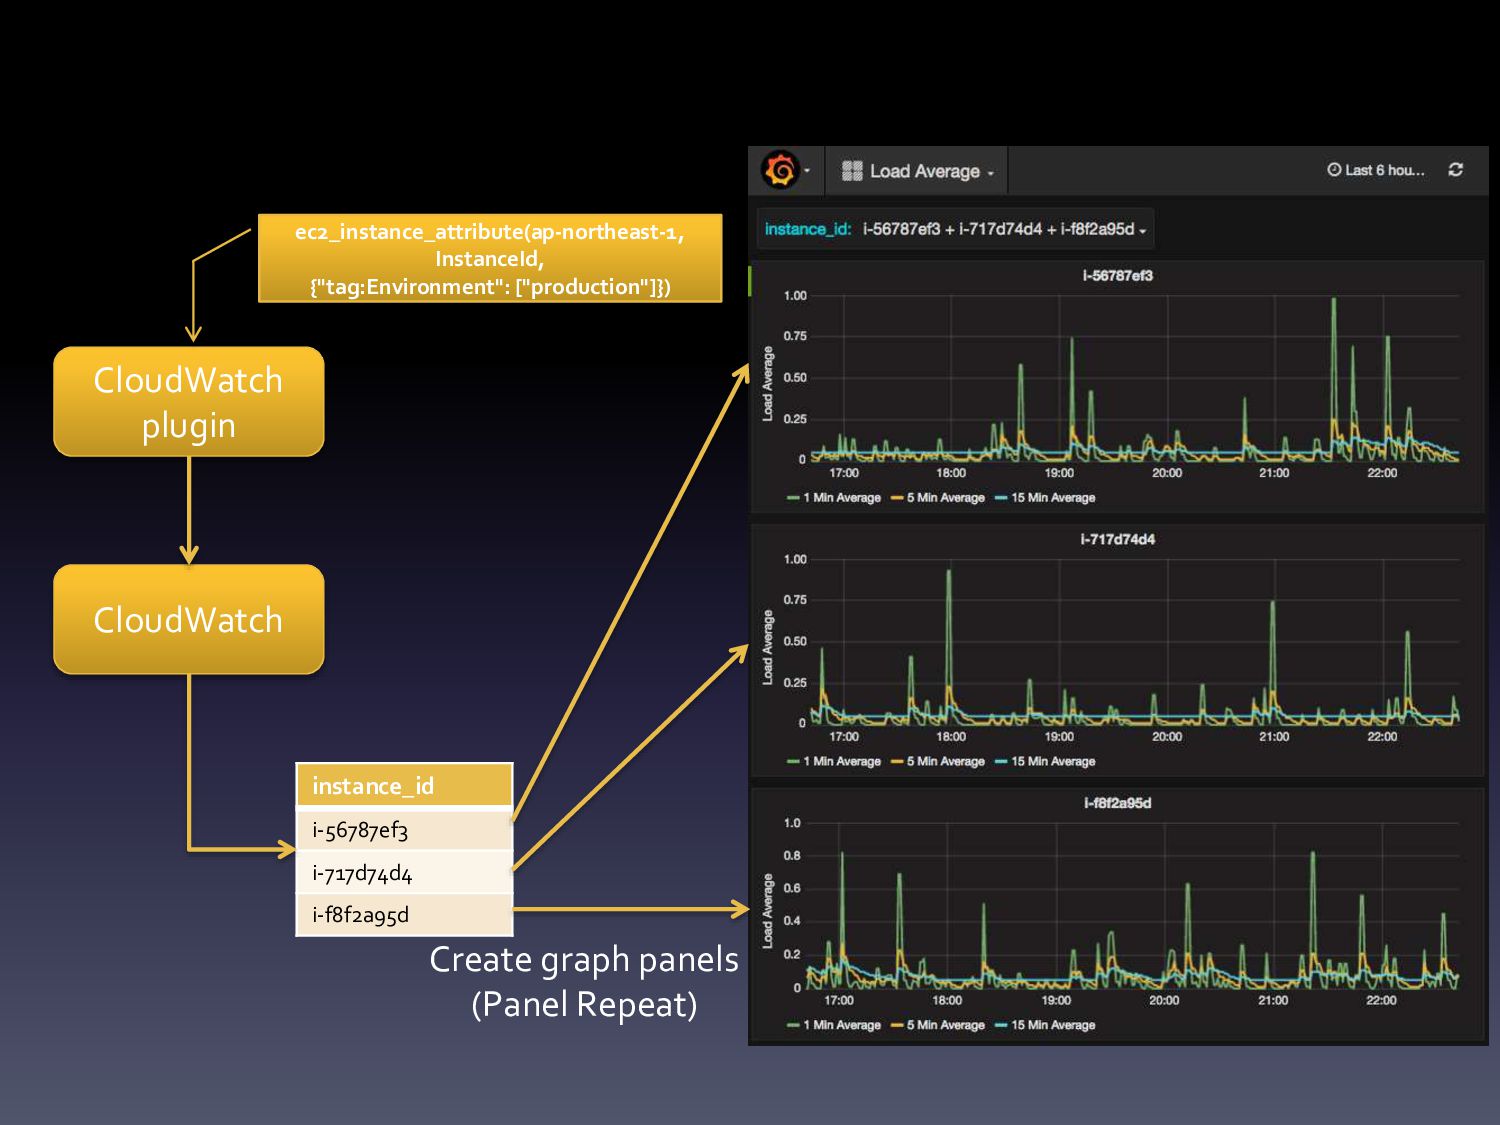
Templating & Panel Repeat • 表示対象をドロップダウンで切り替え • メタデータからグラフを動的に生成 – production環境の全DBサーバのグラフ
– DCごとの負荷平均グラフ • モニタリング対象の増減に柔軟に対応 – グラフ追加/削除の設定作業が不要
CloudWatch plugin CloudWatch instance_id i-56787ef3 i-717d74d4 i-f8f2a95d Create graph panels
(Panel Repeat) ec2_instance_attribute(ap-northeast-1, InstanceId, {"tag:Environment": ["production"]})
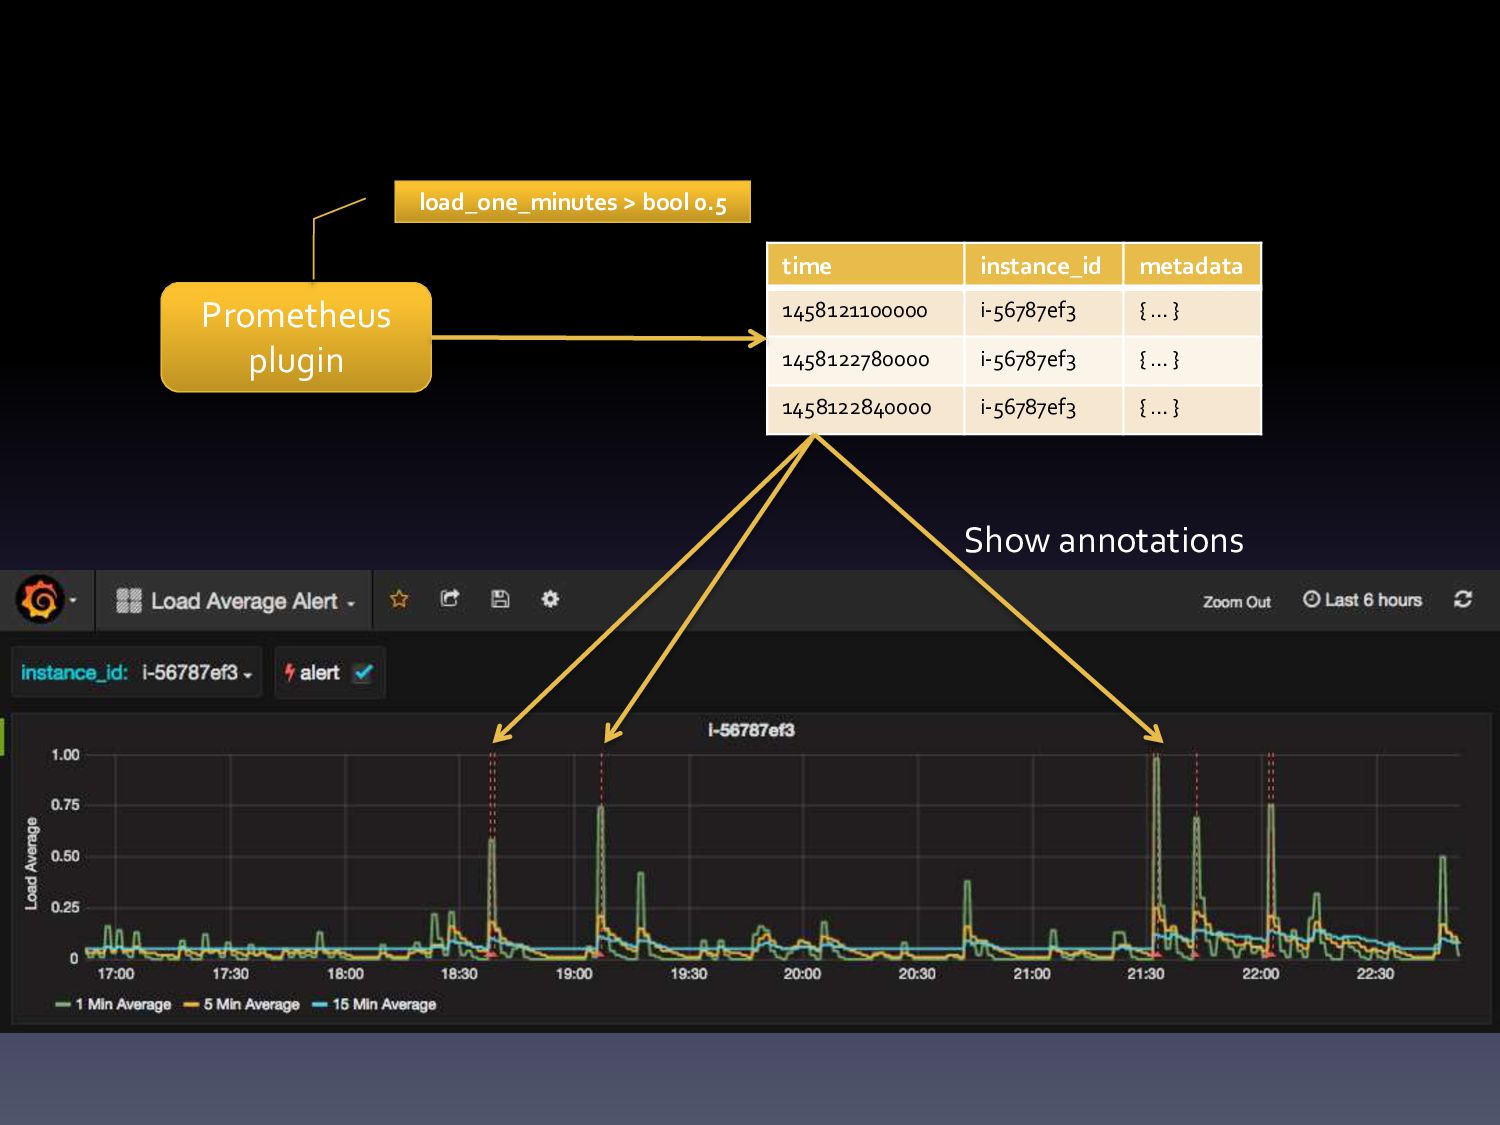
Annotation • グラフ上にイベント発生の時系列を表示 – アラート発生時点のメトリクス確認 – デプロイ前後での負荷傾向の変化を確認
time instance_id metadata 1458121100000 i-56787ef3 { … } 1458122780000 i-56787ef3
{ … } 1458122840000 i-56787ef3 { … } Prometheus plugin load_one_minutes > bool 0.5 Show annotations
まとめ • Datasource plugin対応で、より汎用的な可 視化ツールとして使える • Templatingにより動的な環境にも対応 • Annotationによりグラフ内でより詳細な分 析が可能